1. Executive summary
Consumer Scotland has been tracking consumers’ perceptions of the affordability of energy bills since March 2022. This report summarises the findings from the eighth wave of our energy tracker survey, fieldwork for which was undertaken in winter 2026 (between January and February).
Our tracker captured consumer views prior to the start of the conflict in the Middle East. The situation is likely to have an impact on the price consumers in Scotland pay for their energy, which could affect trends in affordability and debt. Great Britain is, to a significant degree, reliant on natural gas as part of its energy mix. While only a small proportion of our gas is sourced from the Middle East, we are not immune from the effects the conflict has had on prices.
The current price cap, which is fixed until the end of June, protects the vast majority of consumers for now, though we are likely to see prices increase from July. At present, these are forecast to be much smaller than the increases we saw following Russia’s invasion of Ukraine in 2022 and 2023. They will nevertheless put additional pressure on those households that are already struggling to meet their energy needs and may increase the proportion of households in debt.
The energy price cap has decreased over the past 12 months, from £1,849 in April 2025 to £1,641 in April 2026,[1] mainly due to the UK Government shifting some policy costs off energy bills and onto general taxation. While energy bills are significantly down from their peak in winter 2022-2023, they remain above pre-2022 levels. The legacy of these high prices is a significant growth in energy debt and arrears for GB households, reaching £4.55bn in Q4 2025, an increase of £700 million in a year.[2]
Key findings
- Household energy indebtedness in Scotland has risen to record levels. The proportion of households in energy debt has risen steadily since 2023, rising to 15% last year and is currently 19%. Most energy debt is new (under a year old) and does not involve a formal debt repayment plan or debt recovery action. Of those in energy debt, 36% report having been put on a prepayment meter due to their debt.
- Energy affordability challenges still affect a considerable number of consumers in Scotland. 38% of households cannot afford to heat their home to a comfortable level and 16% find it difficult to keep up with their energy bills.
- Energy debt and affordability challenges are more prevalent among households facing financial or health‑related pressures, such as those receiving means-tested benefits, households where a member has a disability or health condition, low-income households, and working-age households.
- Satisfaction with energy suppliers is high. 76% of respondents reported being satisfied with their energy supplier.
Implications from our findings
Energy affordability remains a key concern for consumers in Scotland. While the proportion of consumers that find it difficult to meet their energy needs is down from the peak of the energy crisis, it remains high and continues to rise. We welcome the UK Government’s initiative to prepare targeted support packages for this autumn and winter in the event that prices continue to rise. In the longer term the financial support for some households needs to be better targeted and proportionate. We are pleased that the government adopted our recommendation to expand the proportion of Warm Home Discount (WHD) that get it automatically. And we have made a series of recommendations to the government on ways in which the WHD scheme could be further improved. We will continue to develop the evidence base, and advocate, for these changes in the months ahead.
The proportion of households in Scotland in energy debt and arrears has also continued to rise. We welcome Ofgem’s intention to introduce a Debt Relief Scheme to provided targeted relief to some of the households most in need. But further action is likely to be needed if the total amount of debt is not to increase, let alone be brought down. Debt is clearly difficult and challenging for those households that directly experience it, but it is increasingly a problem for consumers more widely, as the allowances included in the price cap to cover debt-related costs are rising. The answer to this problem is likely to be a combination of measures, including targeted support for certain households, and greater support and encouragement for consumers to engage with their supplier and advice organisations to ensure they have an appropriate repayment plan.
2. Introduction
This wave of the Energy Affordability Tracker collected consumer views prior to the start of the conflict in the Middle East so our figures don’t capture any impacts of the conflict on energy prices.[3] The situation is likely to have an impact on the price consumers in Scotland pay for their energy, and could affect trends in affordability and debt going forward. We expect these impacts to appear in our next wave of our survey.
While the wholesale price rises since the start of the conflict to date have been relatively modest, Consumer Scotland will continue to monitor the situation regarding energy prices and continue to advocate to the UK and Scottish Governments to prepare for a series of different scenarios so that they are able to deliver support if needed. In particular, we will monitor the energy price cap and wholesale costs and maintain a particular focus on heating oil consumers.
Consumers who rely on oil for home heating will likely face acute affordability issues as their prices may vary significantly from top-up to top-up. These consumers may need interventions that are outwith the scope of Ofgem’s current powers.[4] We welcome the introduction of specific support for heating oil consumers by the UK[5] and Scottish Governments,[6] and we will continue to engage on what those consumers might need as the situation develops.
Although energy prices have fallen from their peak during the 2022-2023 energy price crisis, they remain somewhat higher than pre-crisis levels and are expected to rise again. Ofgem’s energy price cap stands at £1,641 for the current quarter (April to June 2026), roughly 12% higher in inflation-adjusted terms than the cap of £1,138 in April to June 2021 (Chart 1), and Cornwall Insight forecasts that the price cap will increase again in the next quarter (July to September 2026).[7]
Chart 1: While the energy price cap is lower than its peak, it remains higher than pre-crisis, and is forecast to increase further
Ofgem’s energy price cap, Cornwall Insight’s Price Cap forecast, and typical price paid, January 2019 to September 2026
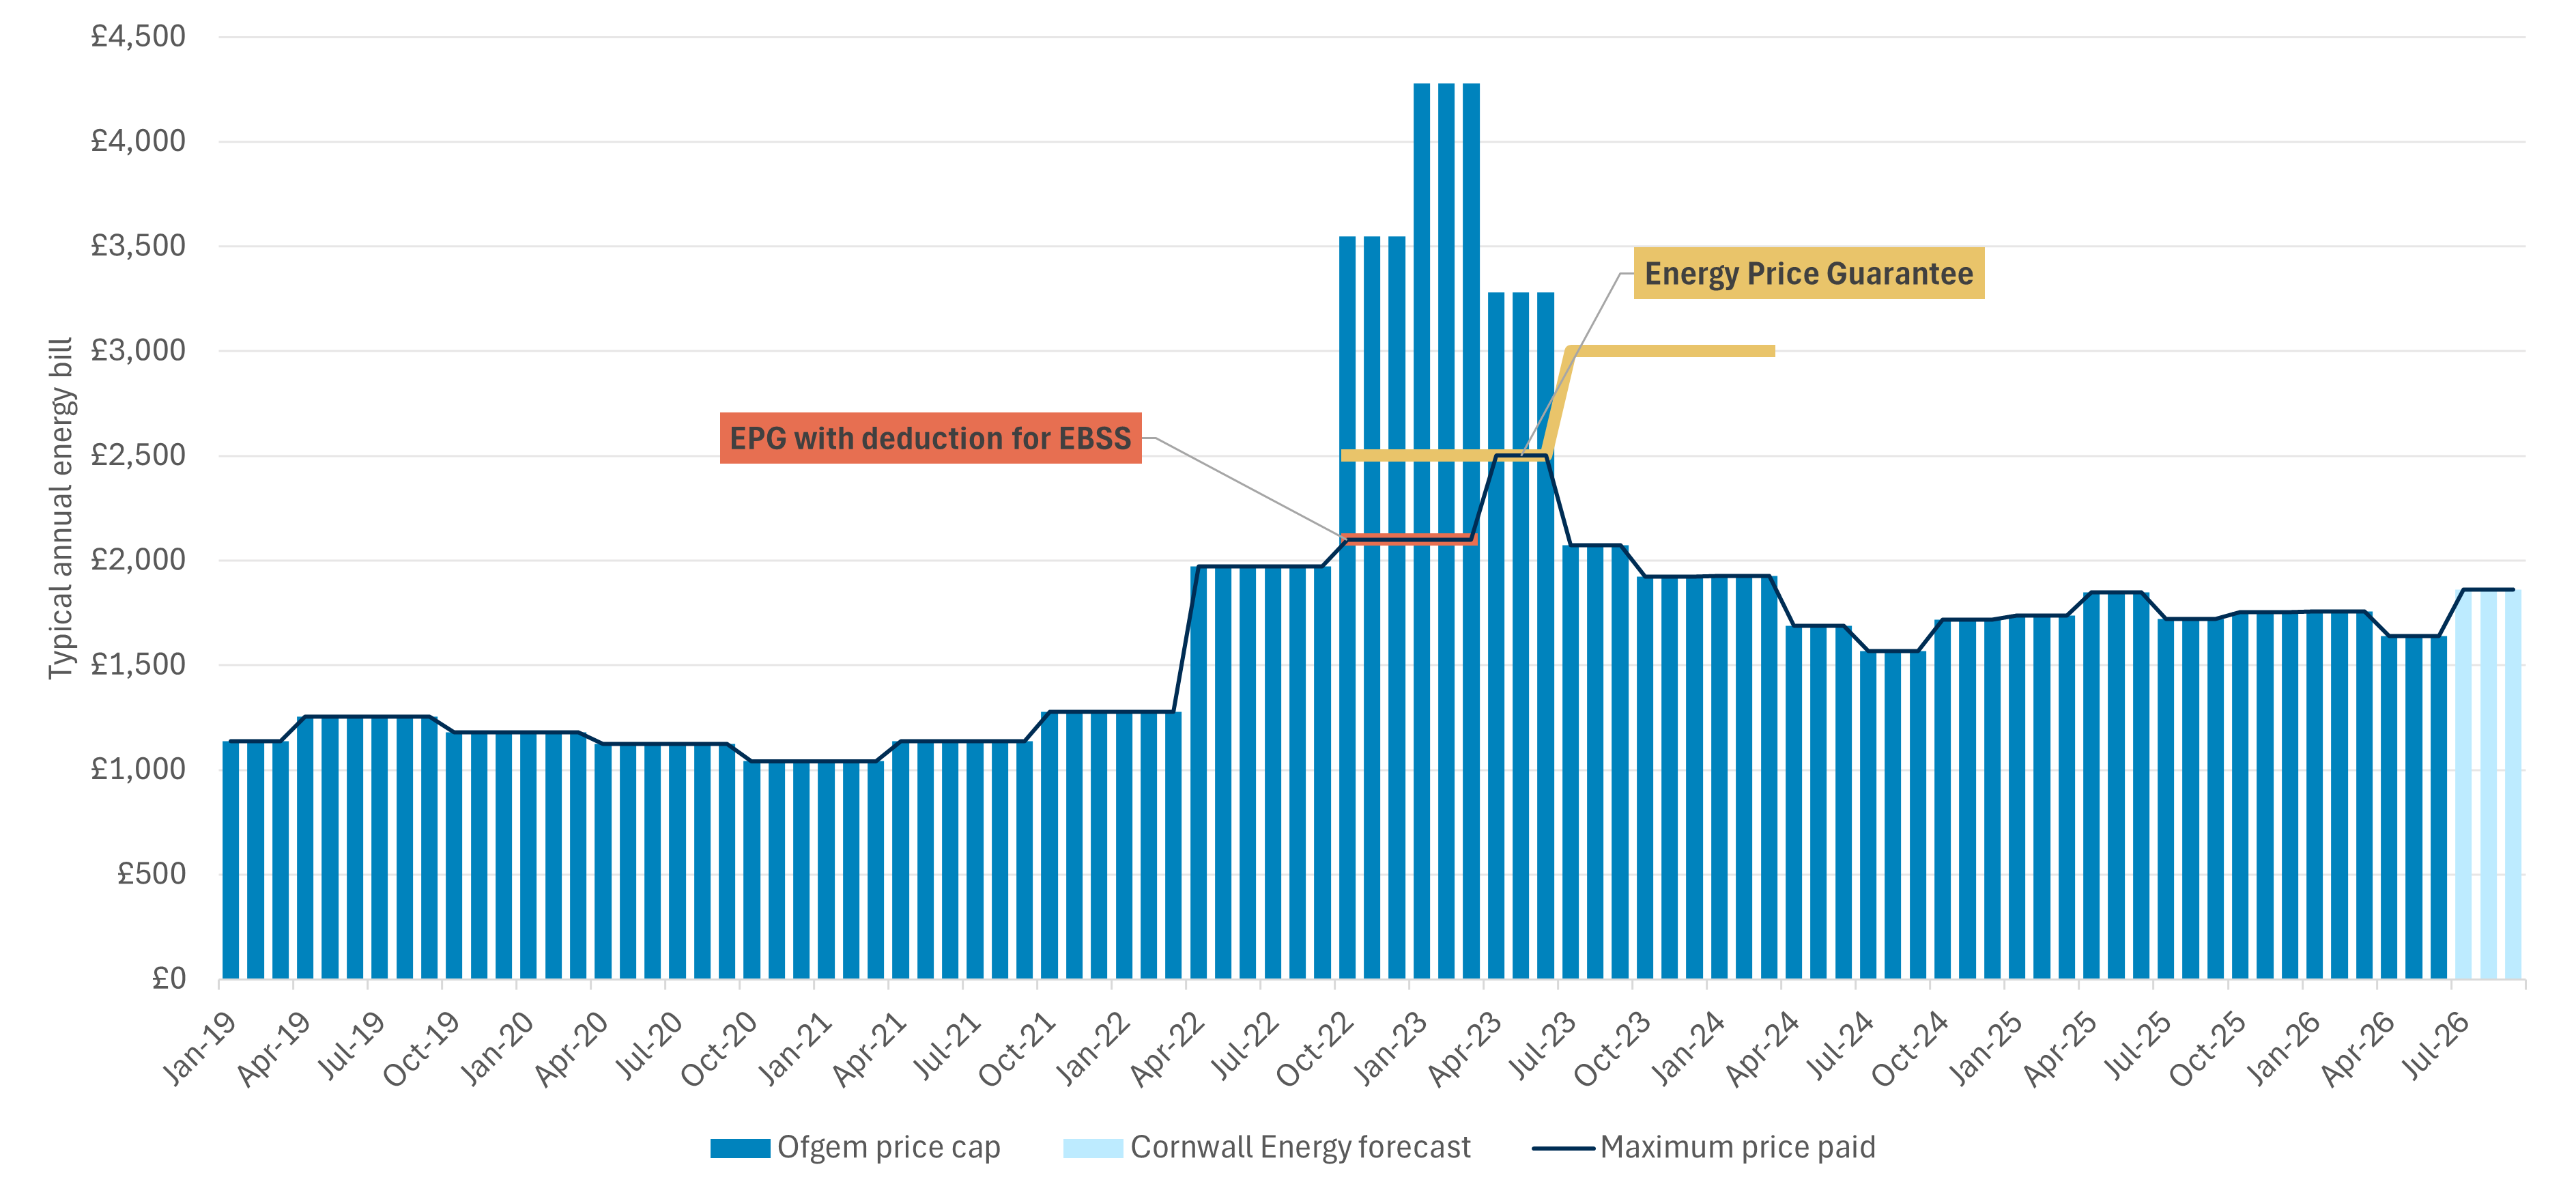
Source: Ofgem Energy price cap (default tariff) levels and Cornwall energy forecast Predictions & Insights into the Default Tariff Cap (Price Cap)
The 2022/23 energy crisis increased bills markedly for consumers. Even with government support in the form of rebates and price ceilings, many consumers built up significant debt and arrears on their energy bills. The total accumulated debt and arrears among domestic households in GB is now approximately £4.5bn according to Ofgem. All households continue to bear the cost of this as the costs are socialised across energy bills.
While bills have fallen significantly since their peak, many consumers are still struggling to meet their energy needs. In 2024, an estimated 28.7% of Scottish households – around 732,000 households – were in fuel poverty, including 14% (around 357,000 households) in extreme fuel poverty.[8]
Some changes have already been made by the UK Government to move policy costs off energy bills and on to general taxation. Specifically, domestic energy bills are £150 lower than would otherwise have been the case as a result of the decisions to take 75% of the domestic costs of the Renewables Obligation into taxation and the Energy Company Obligation no longer being levied on energy bills.[9] These changes came into effect in April of this year.
As well as tracking trends in affordability and debt, the current wave of our survey also covered questions on consumers’ understanding of their energy bills, and the role of standing charges. These more general issues will be considered in a separate, forthcoming report.
Financial context
Households have reduced their use of energy over the last decade,[10] even as the amount they spend on energy, both in real terms and as a share of total household expenditure, has increased.
Domestic energy consumption fell sharply during the 2022 energy price crisis, declining by 16% in 2022 and a further 4.8% in 2023. The previous long-term trend had been one of gradual reduction. Consumption then increased in 2024 by 3.8%, likely due to slightly cooler temperatures and some easing of the high energy and other prices that depressed consumption levels in 2023.[11]
Over the same period, household expenditure on electricity and gas as a share of total consumer spending changed. It increased from 2.5% in 2021-2022 to 3.5% in 2022-2023, then eased slightly to 2.9% in 2023-2024. It returned to pre-crisis levels, at 2.4%, in 2024-2025.[12]
Increased consumer expenditure on domestic energy has coincided with a substantial increase in energy debt and arrears, from £1.09bn in Q1 2018 to £4.55bn in Q4 2025, representing a four-fold increase.[13] This increase has been primarily driven by arrears, which have increased by more than sixfold and now makes up the majority (£3.44bn) of the total amount (Chart 2).
Chart 2: Total energy debt and arrears have risen substantially in recent years
Total financial value of domestic customer debt and arrears (existing for more than 91 days) – Electricity and Gas (£bn), Great Britain, 2018 to 2025
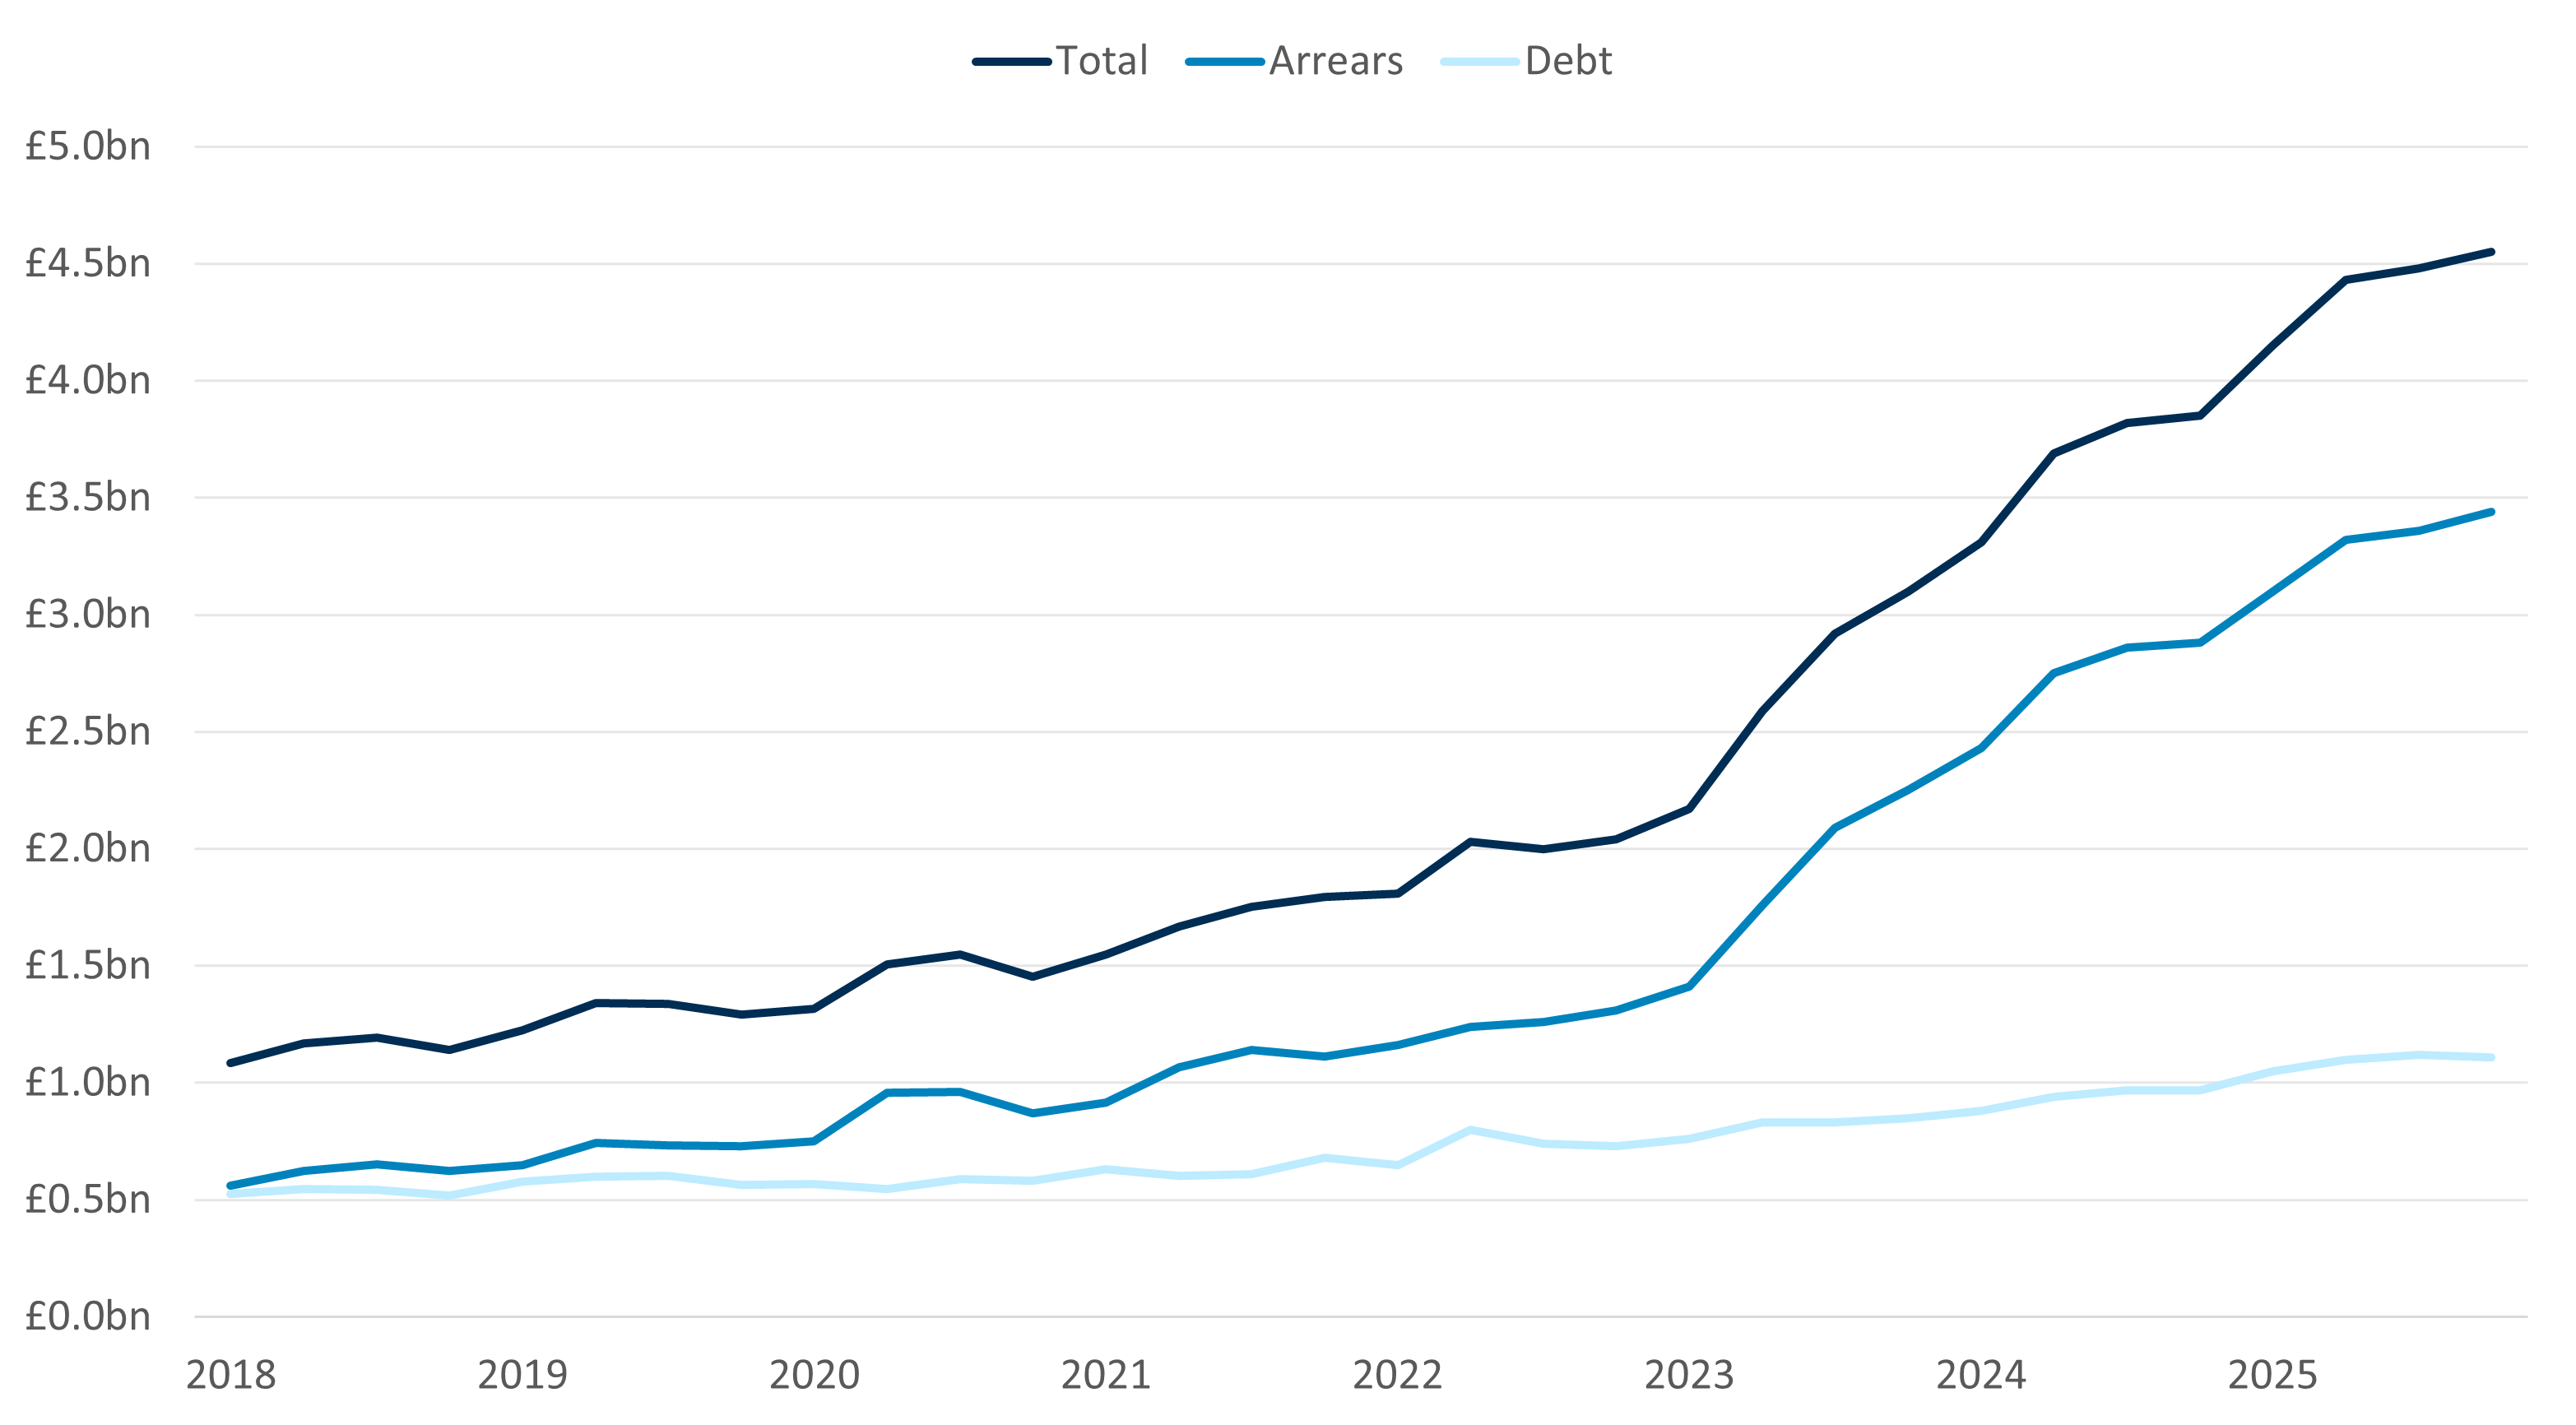
Source: Ofgem debt and arrears indicators. Information correct as of April 2026.
Work is ongoing to mitigate some of these significant debt and arrears challenges, including through Ofgem’s proposed Debt Relief Scheme for those in most acute need[14] and through updates to the regulator’s Debt Strategy[15] which Consumer Scotland has been engaging in.
Other measures which could bring down the costs of energy for consumers, such as financial incentives for demand flexibility, are at a relatively early stage of uptake. We will seek to track the impact of these policies on consumers in Scotland as they develop.
The Bank of England has estimated that there will be a direct and indirect impact on households arising from the conflict in the Middle East. They anticipate a percentage increase of 0.9 to CPI inflation by 2026 Q3 directly from higher energy prices for households compared to its previous estimates, and a further percentage increase of 0.3 indirectly due to companies passing on their higher energy costs, such as from food production. The Bank also warns that these expected increases in food prices will have a greater impact on low-income households.[16]
Rising levels of energy debt are largely driven by sustained high prices. This underlines the need for more effective and better targeted affordability support. We welcome the UK Government investigating options for additional targeted bill support for winter 2026-2027, should the conflict in the Middle East cause significant energy price increases. In the medium to long term, existing schemes, including the Warm Home Discount, are insufficiently targeted to households facing the greatest affordability pressures. We are developing proposals to present to the UK and Scottish governments setting out how better, more effective targeting could be achieved through improved use of UK-wide and Scottish public sector datasets and delivery mechanisms.
The Energy Affordability Tracker
Consumer Scotland has been tracking consumers’ perceptions of the affordability of energy bills regularly since March 2022, when consumers faced rapidly increasing energy prices. The survey allows us to understand consumers in Scotland’s experiences of energy affordability and debt, and how they have changed over time.
It also provides insight into a broad range of consumer issues in the energy market. For example, our latest survey introduced questions covering consumers’ knowledge of standing charges which we will report on separately.
This report describes the findings from the eighth wave (winter 2025-2026) of the energy tracker survey, the fieldwork for which took place between 27 January and 17 February 2026. The survey was initially administered more frequently, but from winter 2023-2024, the survey has been carried out annually as energy prices stabilised. This report contextualises the latest findings and compares them with previous waves of the survey (Table 1).
The Energy Affordability Tracker is administered as an online survey, and the most recent wave was delivered on our behalf by IFF Research. Adults aged 16 and over in Scotland are invited to participate in the survey until the survey quota and stratification target is reached. The responding sample is weighted to the profile of the sample definition to provide a representative reporting sample. Approximately 1,600 individuals have been interviewed at each wave.
The survey sample for the eighth wave had a higher proportion of electricity consumers and lower proportion of mains gas households compared with published estimates. For example, 26% of survey respondents reported electricity as their main heating type, compared with around 10% estimated by the Scottish House Condition Survey (SHCS).[17] Conversely, 63% of respondents reported mains gas as their main heating type, compared with around 81% in the SHCS.
We undertook sensitivity analysis to ensure that these differences in sample structure did not affect the comparability or robustness of our main findings over time. These analyses included examining the sensitivity of results to re-weighting the sample to redress the imbalance; and examining the trends over time for the different sub-groups were parallel or divergent. These gave us confidence that our headline findings are robust to the sample structure. In addition, all regression analyses control for heating type.
Table 1
Dates and sample sizes of Consumer Scotland’s Energy Affordability Tracker
| Wave | Fieldwork date | Sample size |
| Spring 2022 | March 2022 | 2012 |
| Autumn 2022 | Sept/Oct 2022 | 1586 |
| Winter 2022-2023 | Nov/Dec 2022 | 1621 |
| Spring 2023 | March 2023 | 1579 |
| Autumn 2023 | Oct 2023 | 1589 |
| Winter 2023-2024 | Jan/Feb 2024 | 1609 |
| Winter 2024-2025 | Jan/Feb 2025 | 1656 |
| Winter 2025-2026 | Jan/Feb 2026 | 1608 |
3. Energy debt
The proportion of respondents in energy debt or arrears has increased since 2023 and now stands at 19% of households in Scotland. Energy debt is more prevalent among certain households, particularly those relating to finances and household composition. Most energy debt is relatively new (within the last year), and many consumers do not have a formal debt repayment plan or debt recovery action in place. Over a third of consumers in energy debt have experienced legal action or debt recovery action (35%) and have been put on a prepayment meter due (36%) to their energy debt.
More households are now in energy debt
Since October 2023, we have asked respondents if they are in energy debt or arrears. This definition of energy debt is deliberately broad to include cases where a consumer owes money to someone other than their energy supplier because of borrowing money to pay energy costs. As such our survey can capture wider debt that may be masked by the narrower definition used by Ofgem, where “energy debt” means money owed to an energy company by a customer.
Since we first asked this question, the proportion of respondents in energy debt or arrears has increased steadily (Chart 3).[24] The latest figures indicate that around a fifth of respondents (19%) are in energy debt, an increase from 8% in October 2023 and 9% in January/February 2024.
Chart 3: The proportion of households in energy debt has continued to increase
Proportion of respondents reporting being in energy debt or arrears, October 2023 to January/February 2026
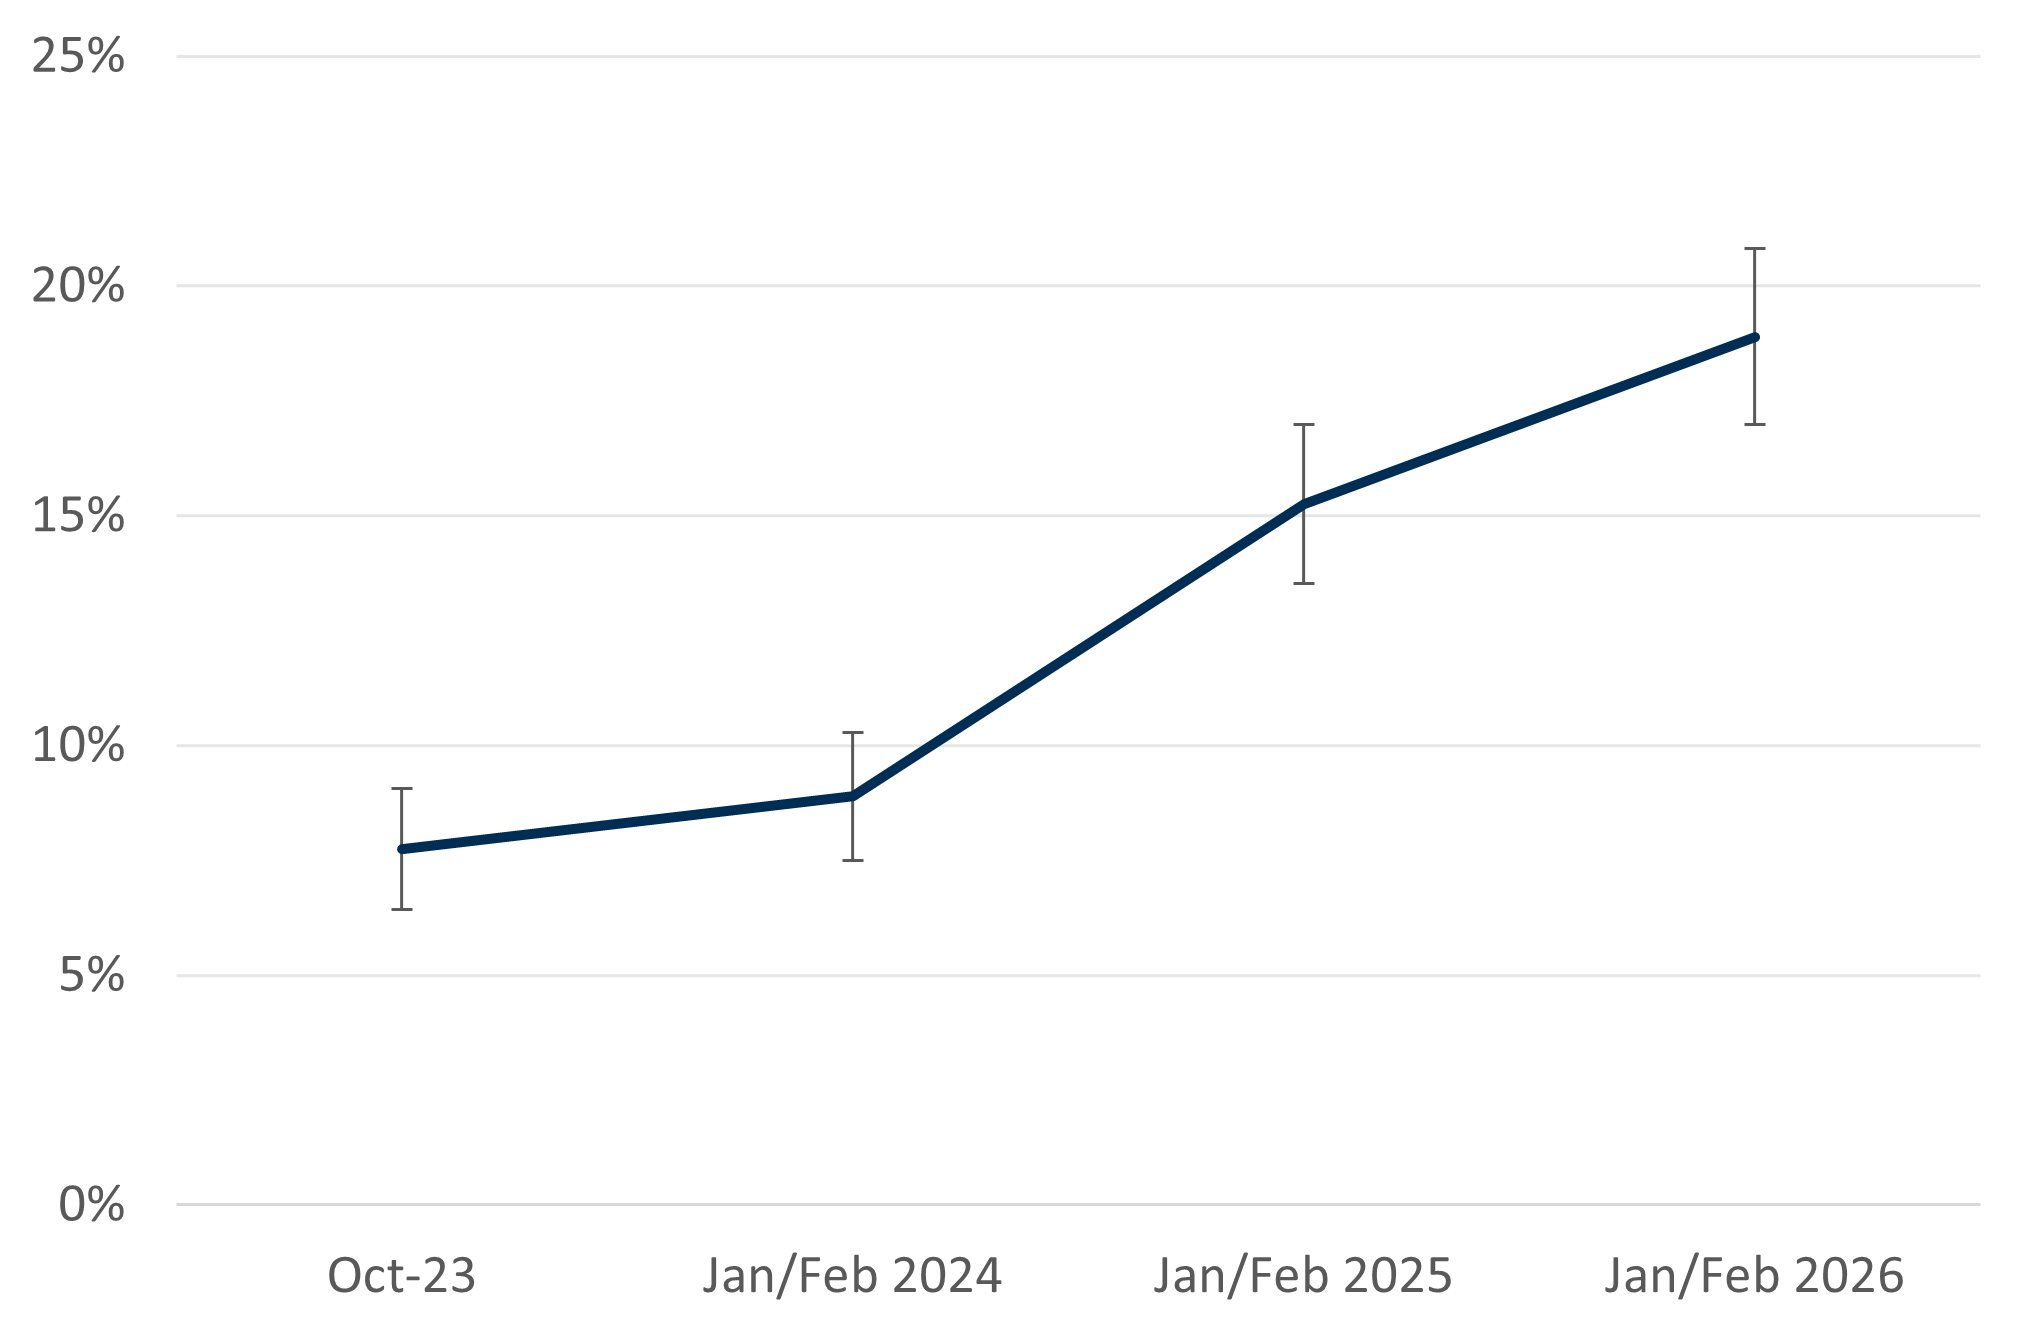
Source: Consumer Scotland Energy Tracker, AFF20: Are you in energy debt or arrears? By this we mean behind on energy bill payments, repaying debt to your energy supplier, paying debt recovery through a prepayment meter, or owing money to someone else as result of borrowing money to pay for energy costs. Note: error bars represent 95% confidence intervals. Jan/Feb 2026 n=1,608; Jan/Feb 2025 n=1,656; Jan/Feb 2024 n=1,609; Oct 2023 n=1,589.
The prevalence of energy debt has increased over time across most consumers, but the rate of the increase varies considerably across different groups. With the caveat that sample sizes are relatively small for some sub‑groups, there is emerging evidence that younger consumers in particular have experienced a sharper rise in reported energy debt since 2023.
Among 16-24-year-olds, the proportion of consumers in Scotland reporting being in energy debt rose from 8% in October 2023 to 31% in January/February 2026 – almost a four-fold increase in just over two years (Chart 4). Over the same period, energy debt has also risen substantially among 45-54-year-olds, increasing from 8% to 24%. By contrast, the proportion of people aged 65 and over reporting being in energy debt rose from 3% to 6%, and older consumers consistently reported lower levels of energy debt.
Chart 4: Energy debt among 16-24-year-olds has increased significantly since 2023
Proportion of respondents reporting being in energy debt or arrears, by age of respondent, October 2023 to January/February 2026
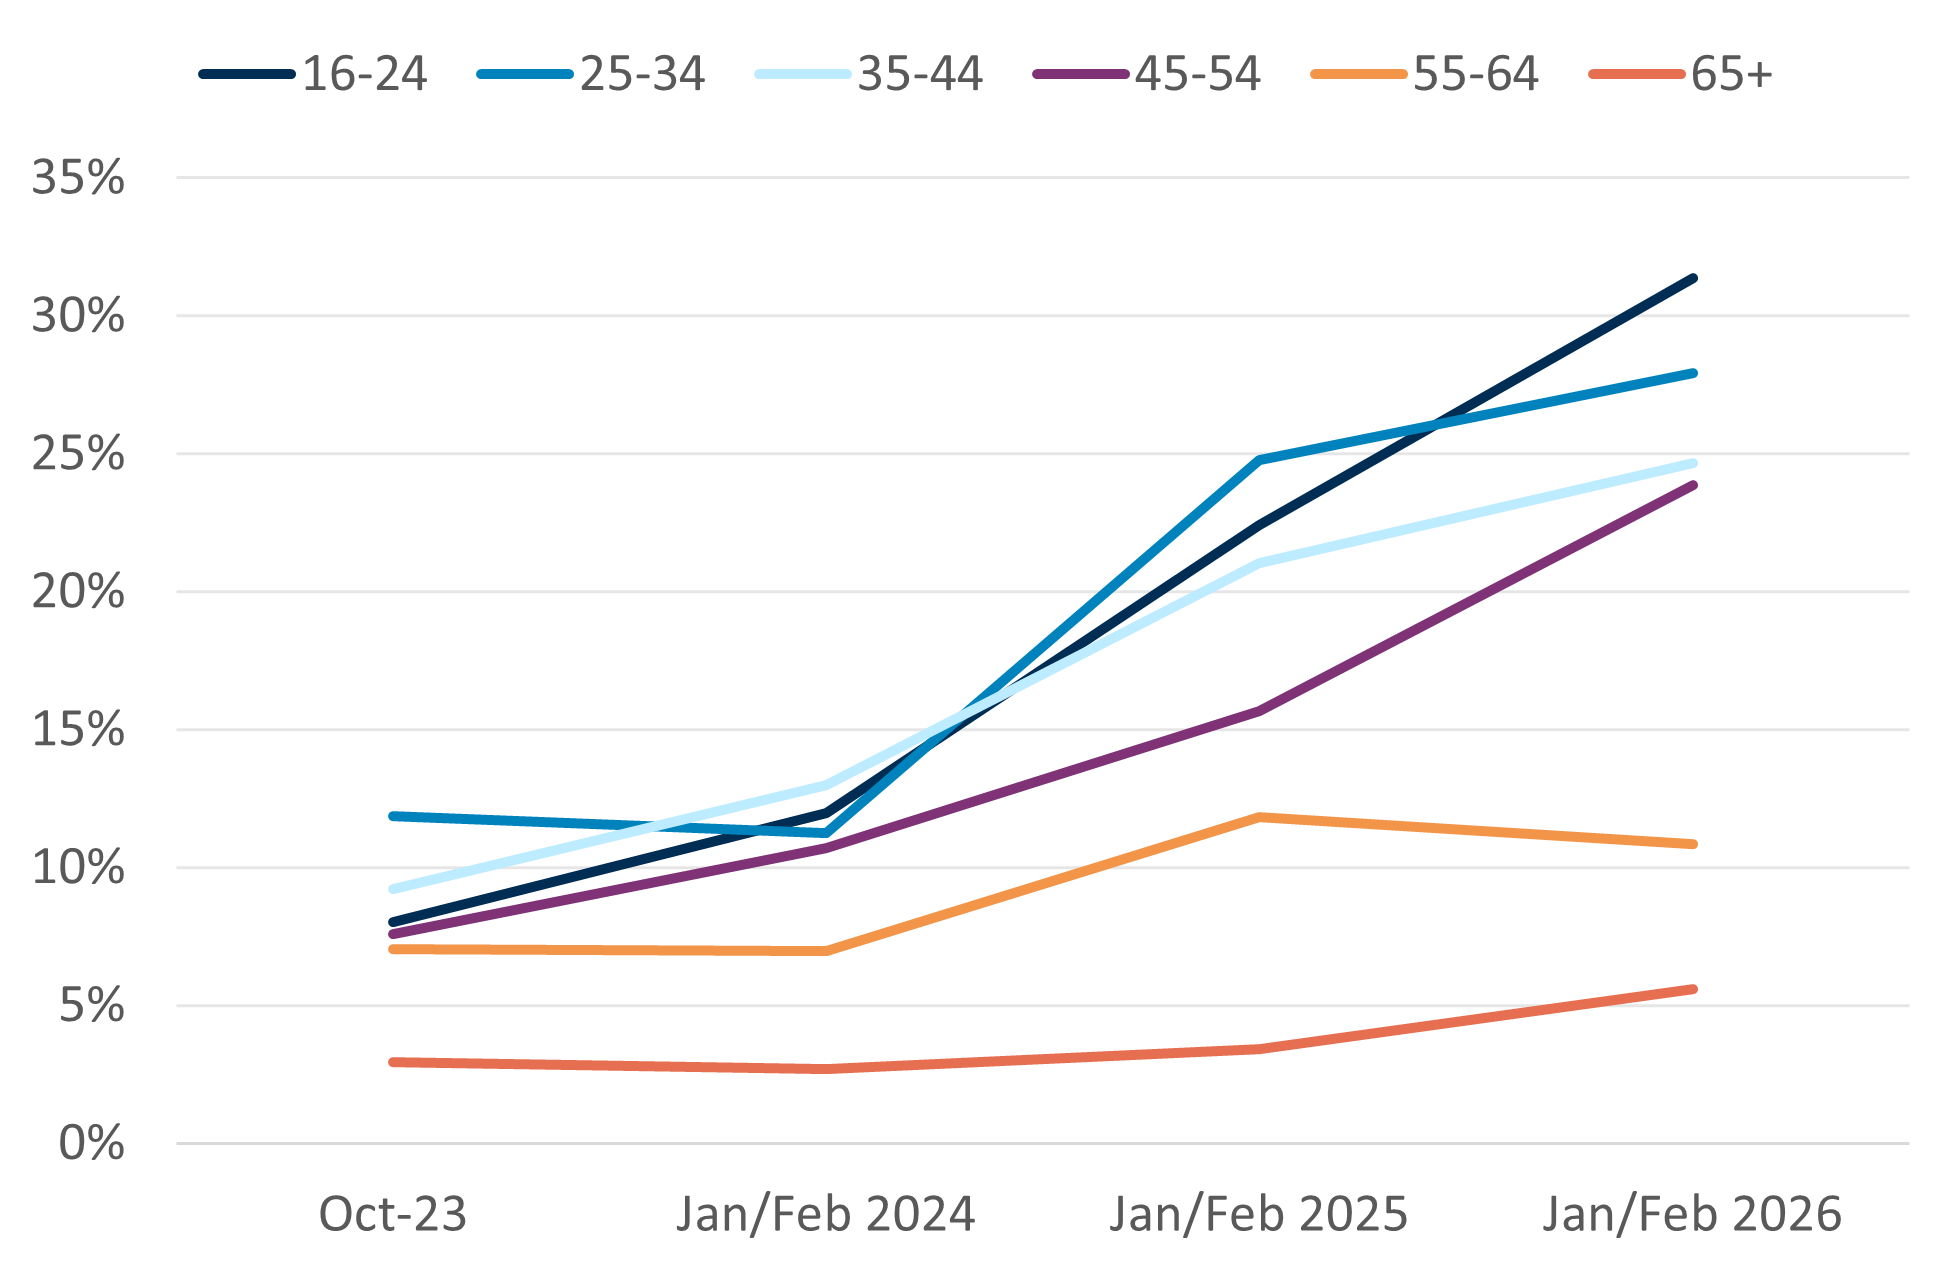
Source: Consumer Scotland Energy Tracker, AFF20: Are you in energy debt or arrears? By this we mean behind on energy bill payments, repaying debt to your energy supplier, paying debt recovery through a prepayment meter, or owing money to someone else as result of borrowing money to pay for energy costs. Note: figures for 16-24-year-olds for 2023 and 2024 are each based on counts under 100 and should be interpreted with caution. Jan/Feb 2026 n=1,608; Jan/Feb 2025 n=1,656; Jan/Feb 2024 n=1,609; Oct 2023 n=1,589.
Energy debt varies by household finances and composition
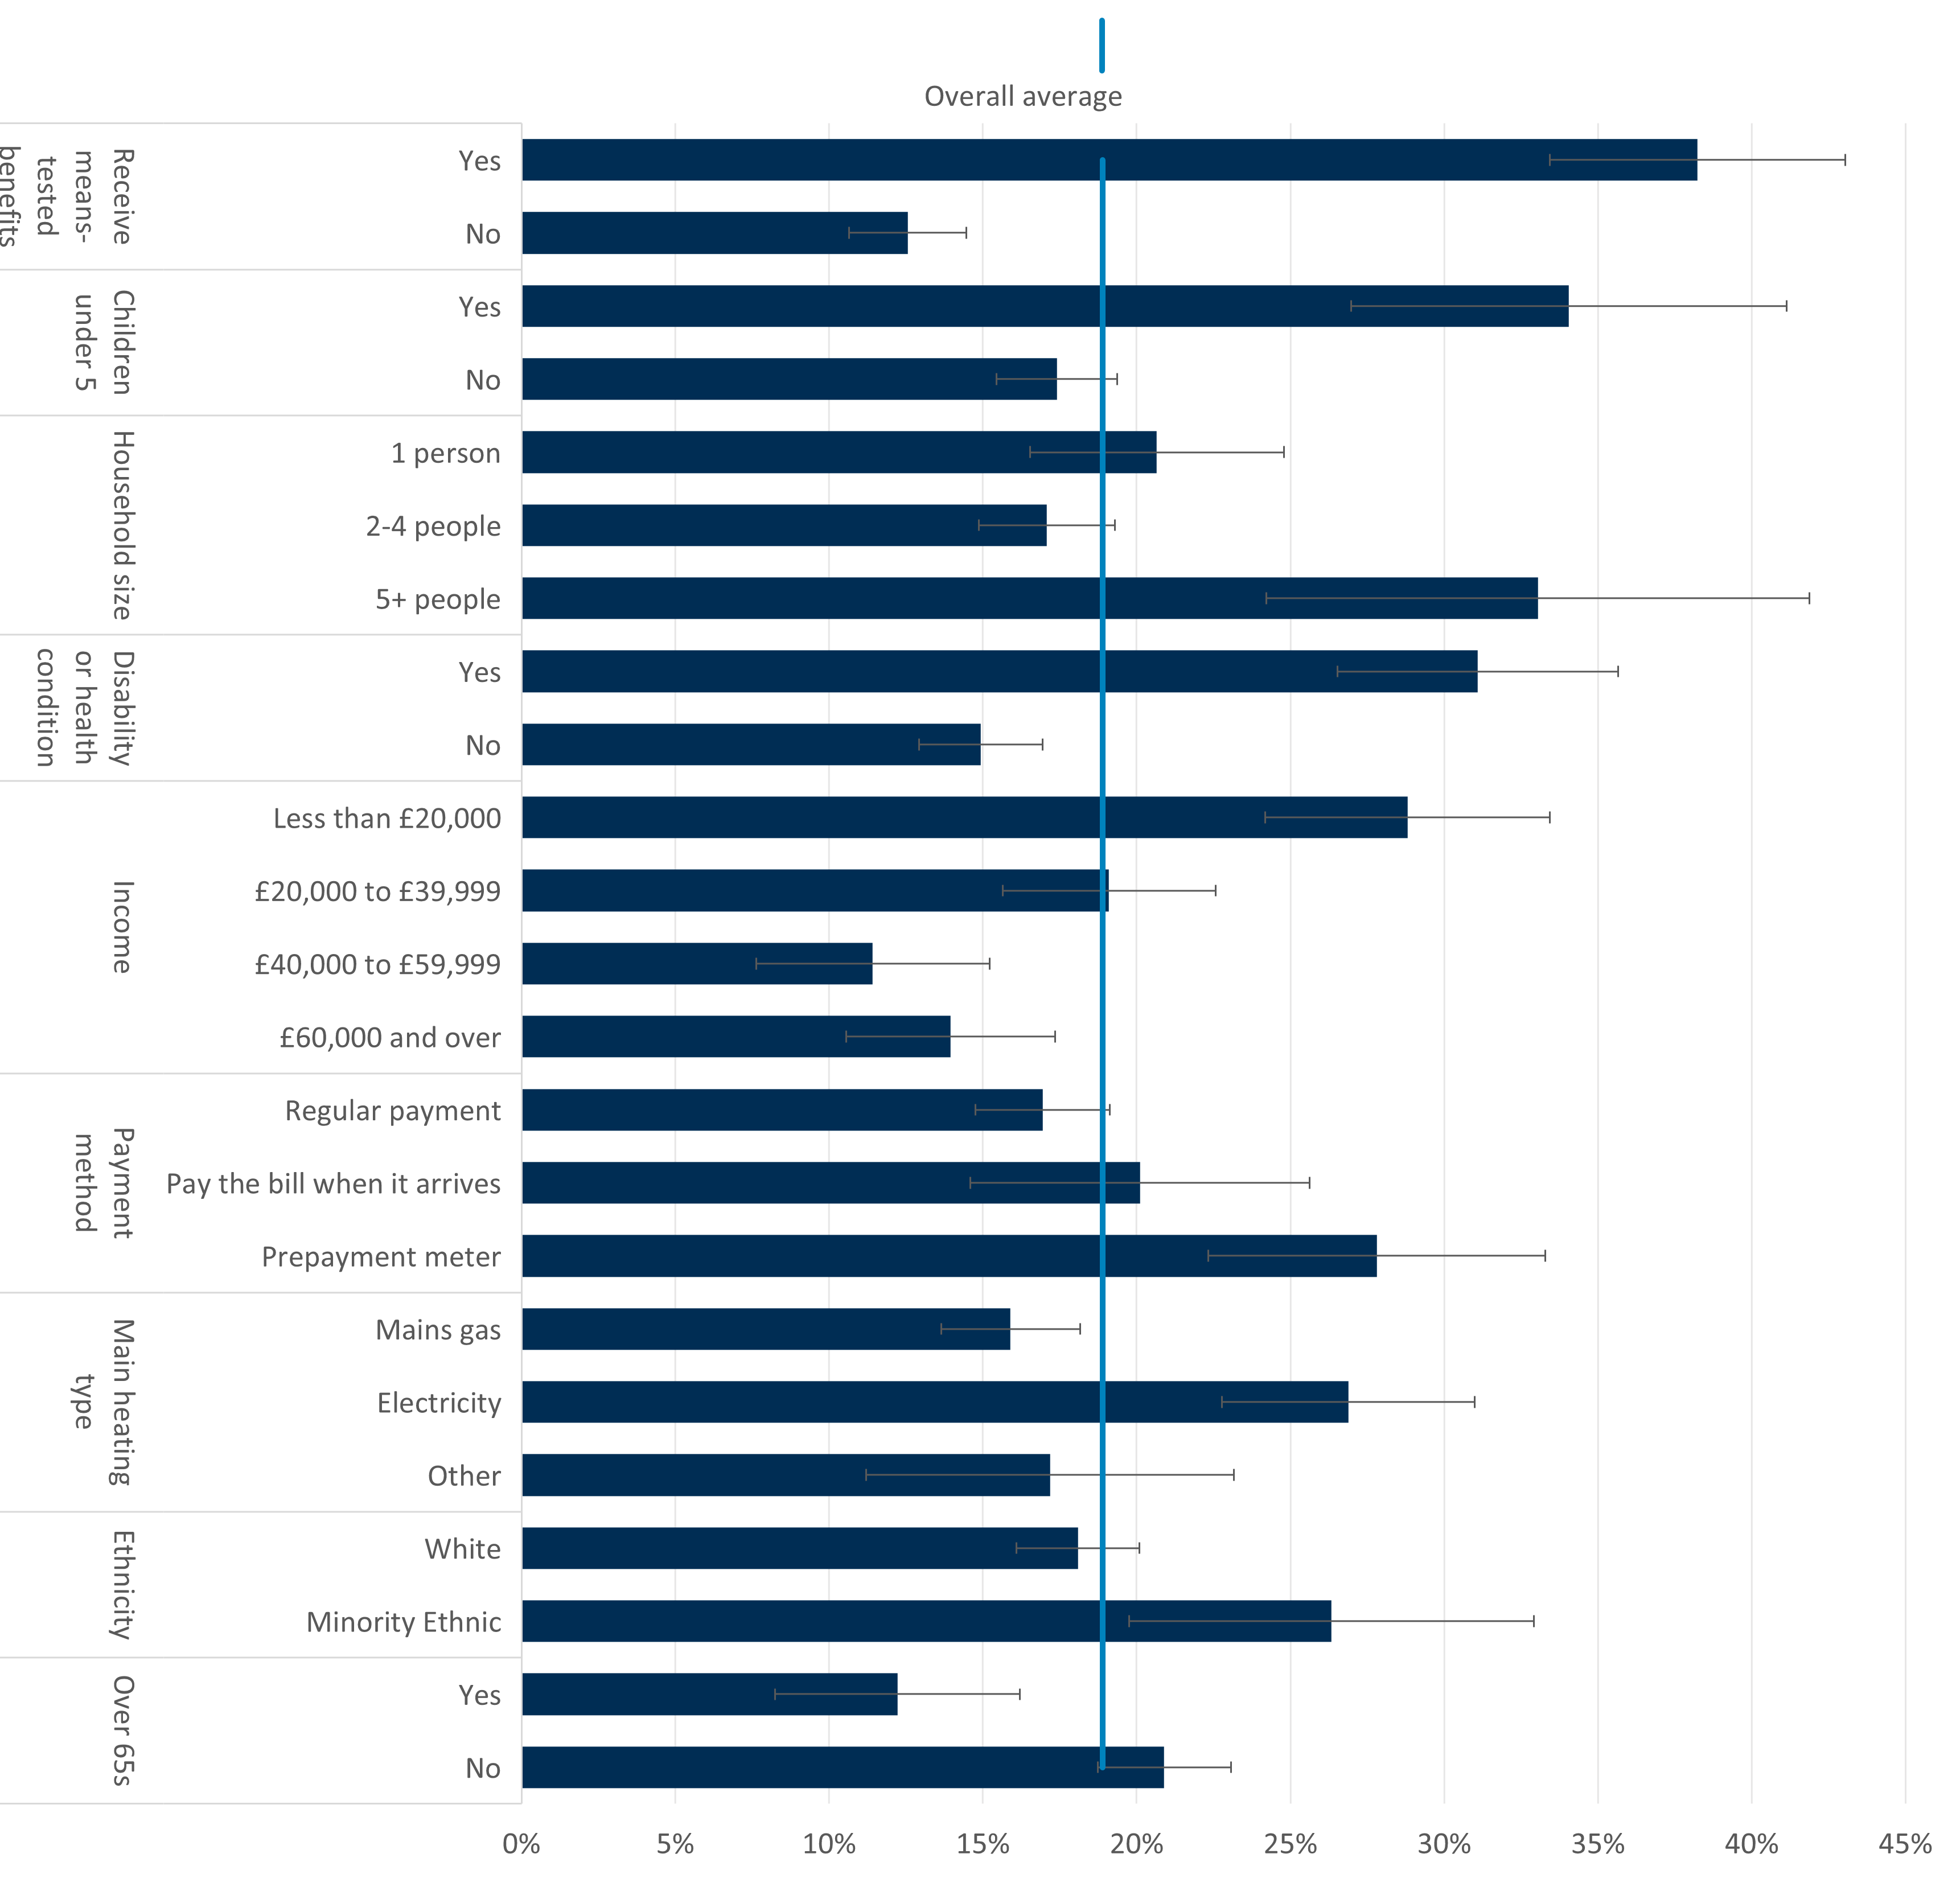
Certain groups of consumers were significantly more likely to report being in energy debt or arrears. As shown in Chart 5, energy debt was more prevalent among:
- Households who receive means-tested benefits (38%) compared with those who do not (13%)
- Households with children under five (34%) compared with those without (17%)
- Households with 5 or more members (33%), compared with single person (21%) or 2-4 people households (17%)
- Households where a member has a disability or health condition (31%), compared with those that do not (15%)
- Lower-income households, particularly those with incomes under £20,000 (29%), compared with higher-income households (11-19%)[25]
- Those who pay for their energy through a prepayment meter (28%), compared with those who pay by regular direct debit or standing order (17%)
- Households whose main heating type is electricity (27%) compared with mains gas (16%)
- Working-age households (under 65-year-olds, 21%), compared with those with over-65-year-olds (12%)
Chart 5: Energy debt is more prevalent among certain households, particularly those relating to finances and household composition
Proportion of respondents reporting being in energy debt or arrears, by demographics and overall average, January/February 2026
Source: Consumer Scotland Energy Tracker, AFF20: Are you in energy debt or arrears? By this we mean behind on energy bill payments, repaying debt to your energy supplier, paying debt recovery through a prepayment meter, or owing money to someone else as result of borrowing money to pay for energy costs. Note: error bars represent 95% confidence intervals. N=1,608.
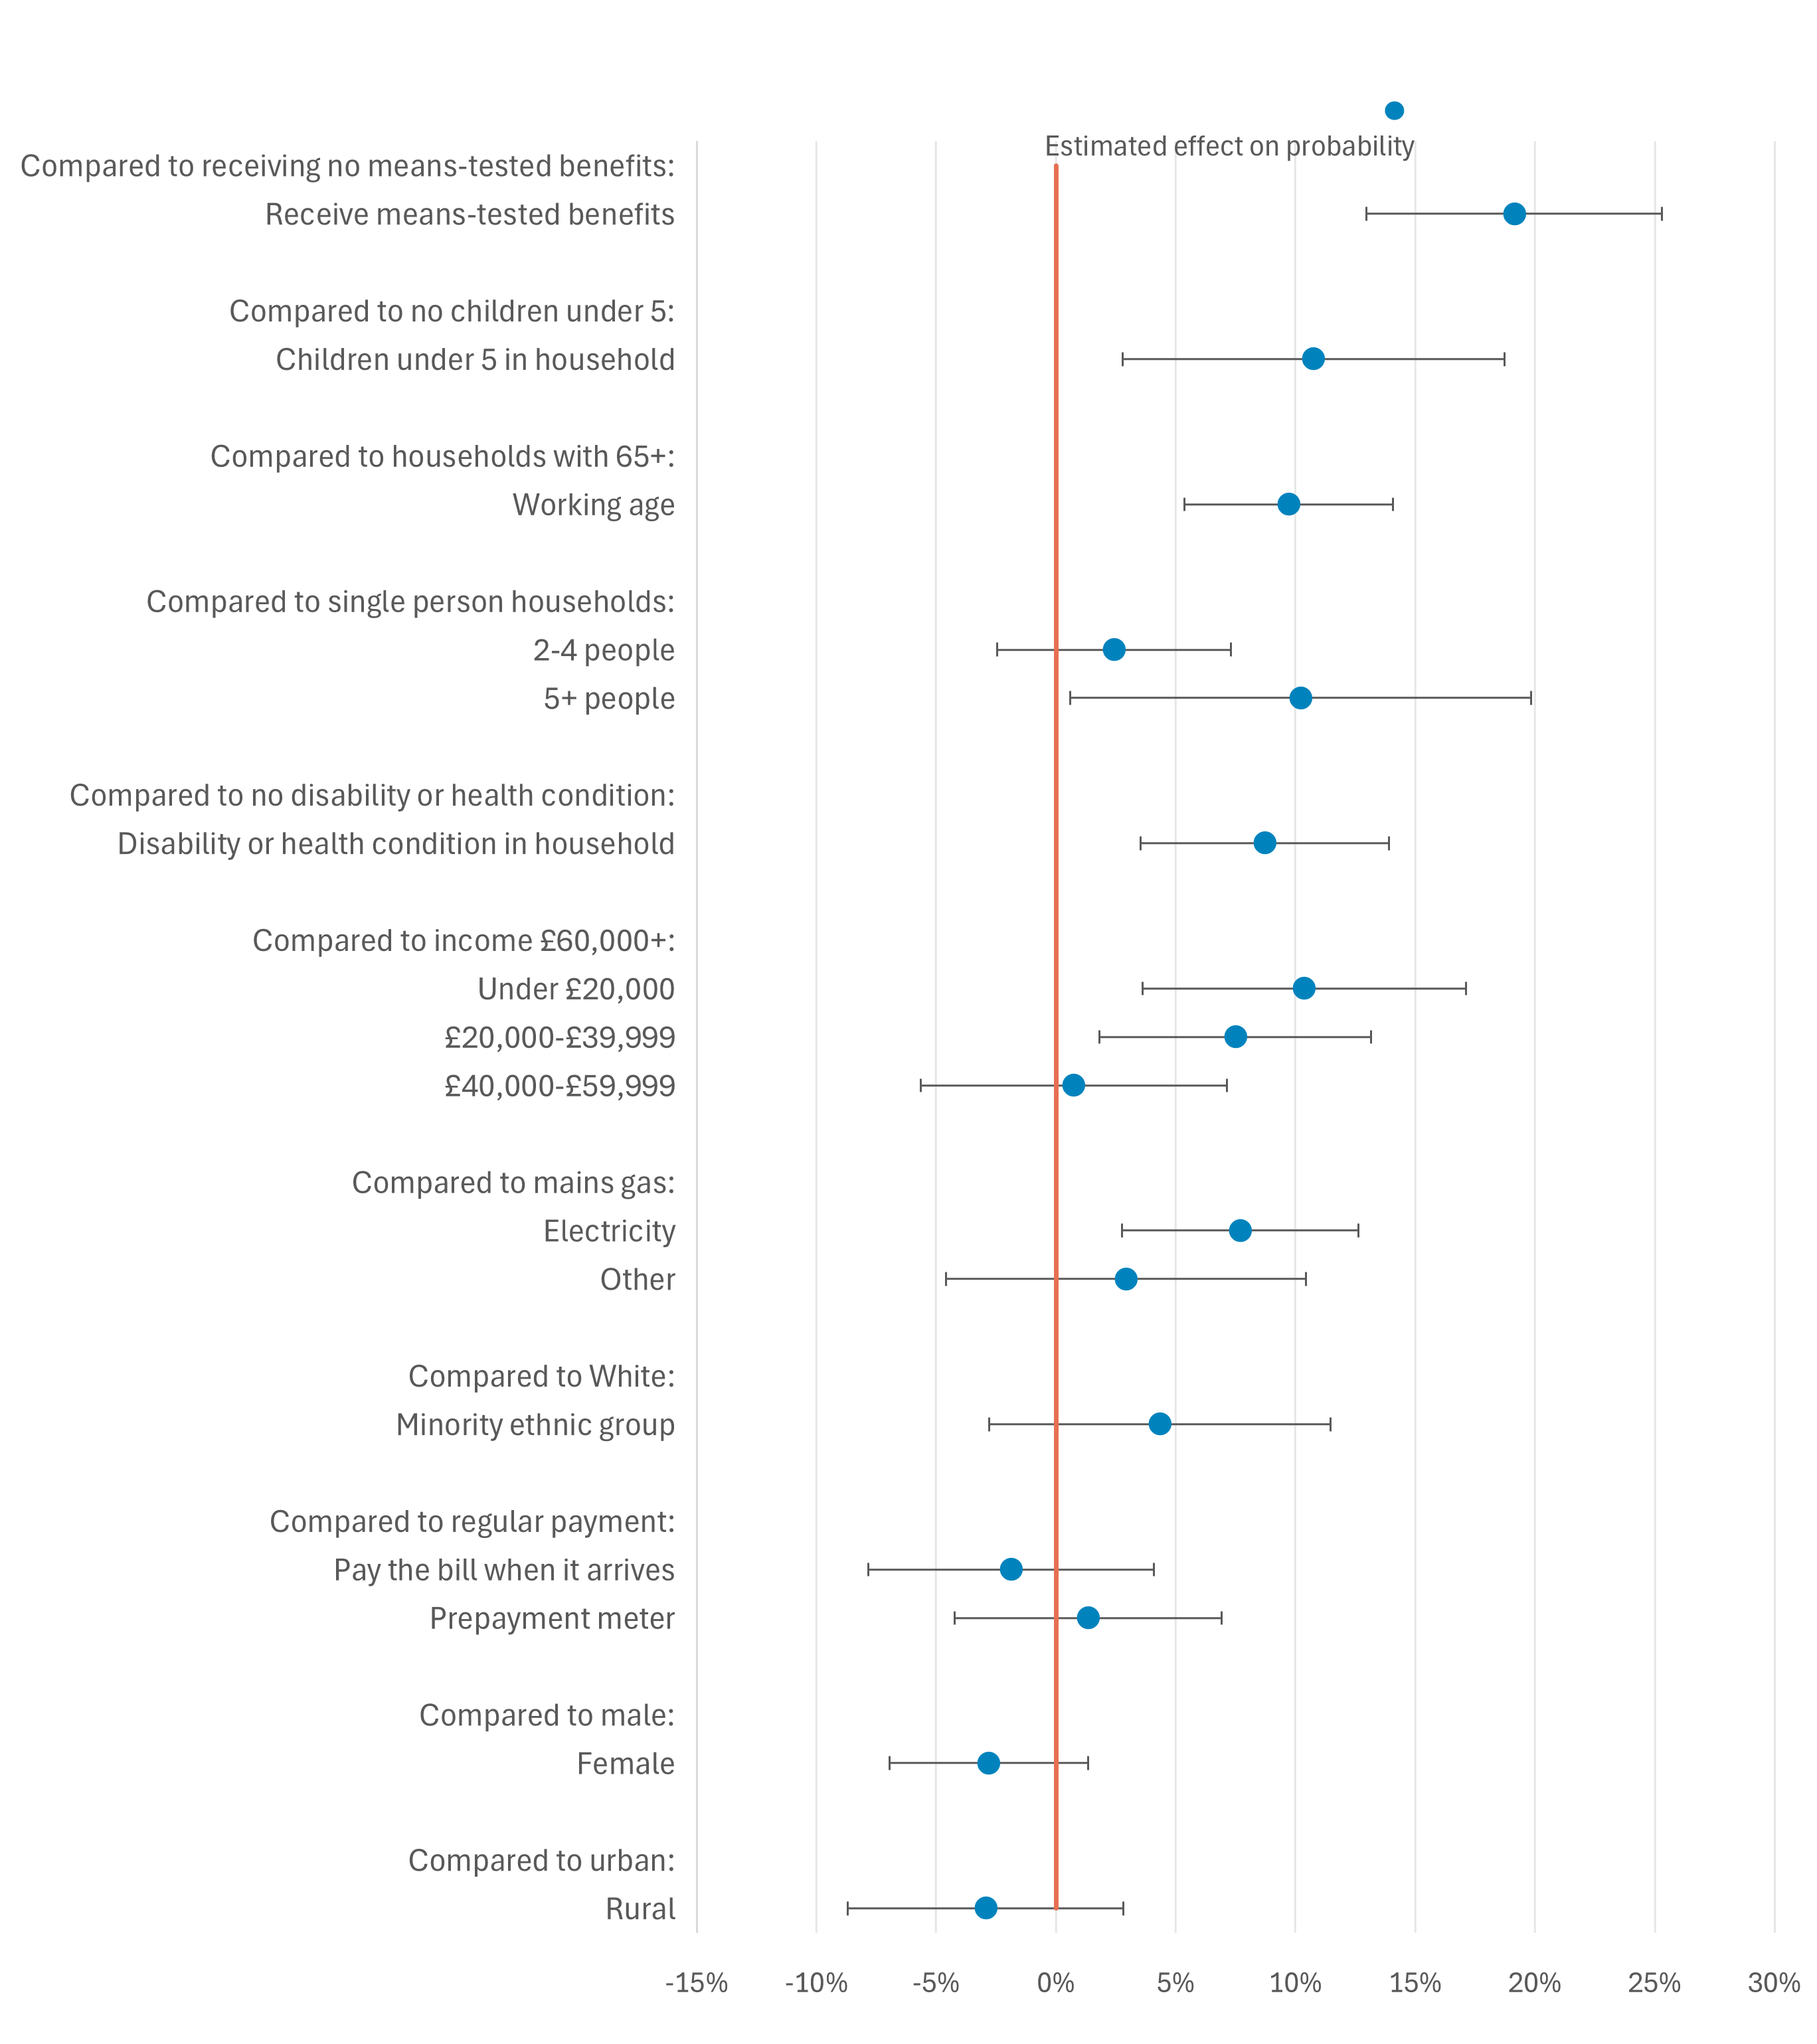
Many of the characteristics associated with energy debt are related to one another, making it difficult to determine which factors are most strongly associated with differences in energy debt based on this descriptive analysis alone. We therefore performed a logistic regression to estimate the probability of a household being in energy debt, allowing multiple household and demographic characteristics to be considered simultaneously and controlling for the effects of other variables.[26]
The results of the regression analysis are summarised in Chart 6; again, the characteristics most strongly associated with energy debt are those relating to financial situation and household composition. They indicate that:
- Households who receive means-tested benefits face the highest risk and are around 19 percentage points more likely to be in energy debt than those who receive no means-tested benefits
- Households with children under five are 11 percentage points more likely to be in energy debt than those without
- Working-age households (under 65-year-olds) are 10 percentage points more likely to be in energy debt than those with over-65-year-olds
- Households with 5 or more members are 10 percentage points more likely to be in energy debt than single person households
- Households where a member has a disability or health condition are around 9 percentage points more likely to be in energy debt, compared with those without
- Lower-income households (under £39,999) are more likely to be in energy debt, compared with those with an income of over £60,000, by 7-10
- Households whose main heating type is electricity are 8 percentage points more likely to be in energy debt, compared with mains gas
Other characteristics – such as payment method – were statistically significant initially but no longer statistically significant once other factors were controlled for.[27]
While there have been significant interventions for older consumers in debt or facing affordability issues, including the Pension Age Winter Heating Payment, Warm Home Discount and Winter Heating Payment,[28] our evidence would suggest that wider and more accurately targeted interventions are needed that better support all consumers facing energy affordability issues. We have set out our views on how this could be achieved previously in our papers on energy affordability[29] and in response to consultations by Ofgem and DESNZ regarding energy market interventions such as the Debt Relief Scheme[30], Warm Home Discount[31] and forthcoming research on the use of data to better target affordability support across consumer markets.
Chart 6: Households who receive means-tested benefits are associated with the highest risk of energy debt, even when controlling for other factors like income
Logistic regression results on the probability of being in energy debt or arrears, January/February 2026
Source: Consumer Scotland Energy Tracker, AFF20: Are you in energy debt or arrears? By this we mean behind on energy bill payments, repaying debt to your energy supplier, paying debt recovery through a prepayment meter, or owing money to someone else as result of borrowing money to pay for energy costs. N=1,608. Note: estimates are average marginal effects from a logistic regression and represent the percentage‑point change in the probability of being in energy debt associated with each characteristic, relative to the reference category, holding other variables constant. Error bars show 95% confidence intervals; where these cross zero, the estimated effect is not statistically significant.
Energy debt is typically new, with many households lacking formal repayment arrangements
Around a third (32%) of respondents have been in energy debt for under 3 months, with a further 38% for 4-12 months. A smaller proportion (14%) have been in energy debt for more than a year. Overall, this indicates that energy debt is relatively new for most people, with around 70% having been in energy debt for less than a year.
In terms of the types of energy debt that consumers have, almost half (45%) are behind on bills but have no formal debt repayment plan or debt recovery action. More than a third (37%) do have a formal repayment plan in place with their energy company (including through a prepayment meter).
Ofgem estimates the average debt level where there is no arrangement to repay the debt (arrears) to be £1,773 for electricity accounts and £1,512 for gas accounts in Q4 2025. For those with a repayment plan (debt), Ofgem estimates that the average debt remaining was £799 for electricity consumers and £651 for gas consumers.[32] This is specifically debt that is owed by consumers to suppliers – whereas our measure of debt is broader, encompassing resources that consumers have borrowed to pay their energy bills.
Encouragingly, two thirds (66%) of those in energy debt feel confident that they will be able to clear their debt. The majority (59%) of those with an energy debt repayment plan with their energy company find their repayments easy to keep up with.[33]
However, over a third of households (35%) in energy debt have experienced legal or debt recovery action due to their debt. Ofgem are in the consultation process for new consumer outcomes in the energy market.[34] It will be important for this work to reduce the number of consumers who experience legal and debt recovery action through better support and interventions being provided by suppliers at earlier stages of consumer need.
A significant proportion of consumers have been moved on to prepayment meters due to their energy debt
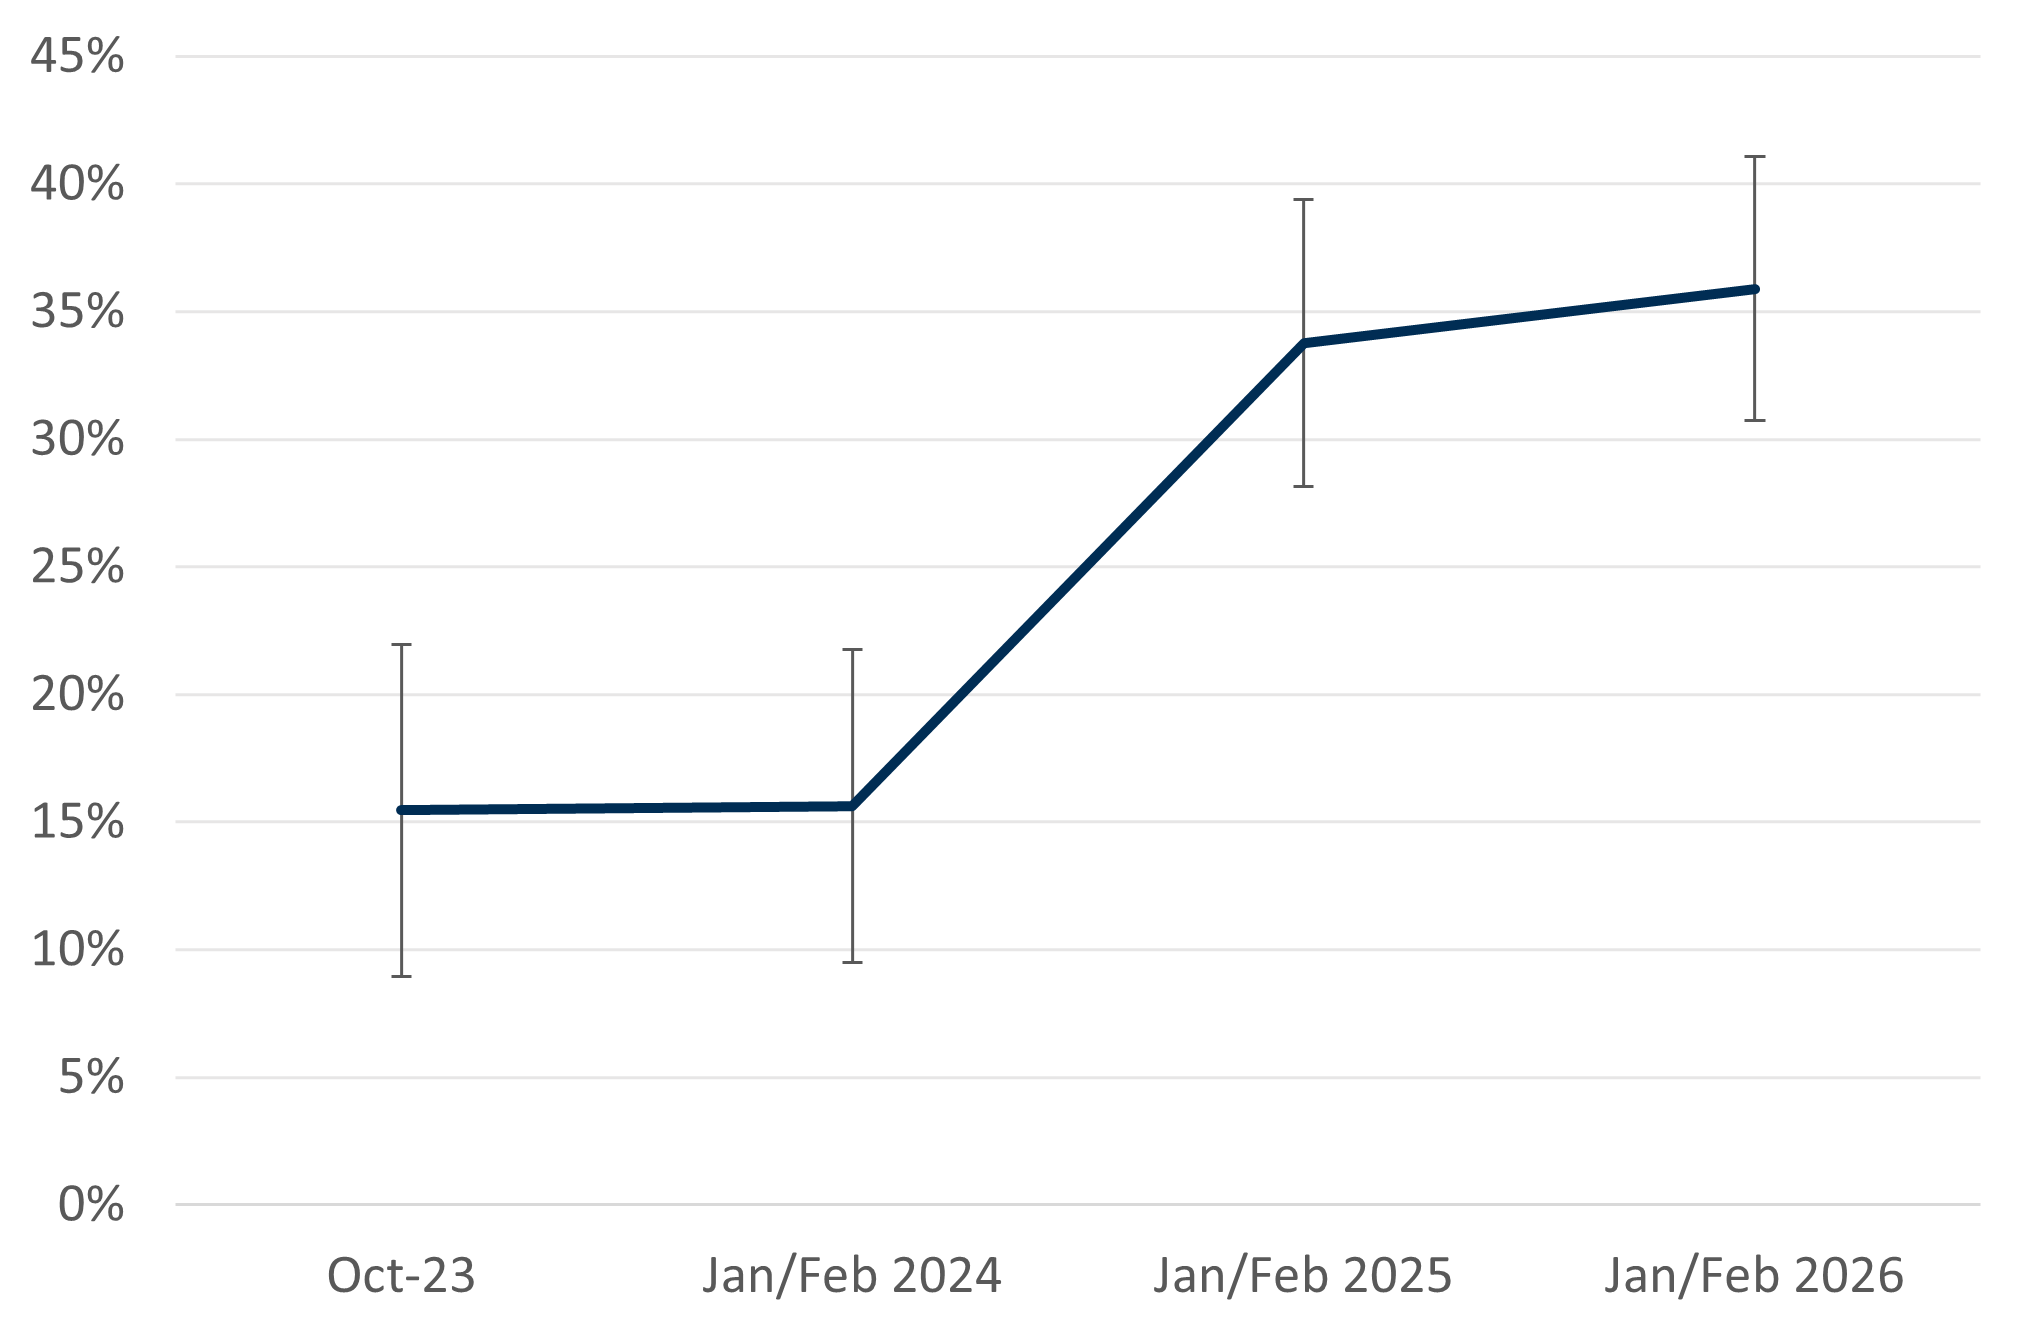
Over a third (36%) of households in energy debt reported that they have been put on a prepayment meter due to their debt. This is similar to last year (34%) but has more than doubled since 2023 and 2024, indicating a significant rise in the proportion of indebted households being moved to prepayment meters (Chart 7).
While this continues to affect a relatively small share of households overall, the number is growing – from 1% in 2023 to 7% this year – highlighting the growing use of prepayment meters after the involuntary prepayment meter moratorium started to lift towards the end of 2023, and as affordability and debt pressures persist.
Consistent with this trend, Ofgem data shows the proportion of customers repaying a debt to their supplier using a prepayment meter rose significantly and peaked in Q4 2023 and Q1 2024 at 58% for electricity and 56% for gas customers. In Q3 2025 this fell to 41% for electricity customers and 38% for gas customers, just above the historical average prior to the 2022 energy crisis.[35]
Chart 7: The proportion of consumers put on a prepayment meter due to their energy debt has increased
Of those in energy debt, proportion of respondents who have been put on a prepayment meter due to their energy debt, October 2023 to January/February 2026
Source: Consumer Scotland Energy Tracker, AFF23: For each of the following statements, please indicate whether or not they apply to you/ your household… _6 I have been put on a prepayment meter due to my energy debt. Note: error bars represent 95% confidence intervals. N=331.
Around six in ten respondents in energy debt had contacted their energy supplier about their debt (62%), and a similar proportion (61%) report that their supplier had contacted them. One in five (19%) had neither contacted their supplier nor been contacted by them about their debt.
More work is needed to support the one in five consumers in energy debt who have had no contact with their supplier. Supplier engagement is key to prevent, manage and mitigate household debt and affordability issues. The importance of engagement was illustrated in Ofgem’s proposed Debt Relief Scheme, requiring a basic level of consumer engagement to ensure that the scheme was not simply a debt-write off, but a debt “reset” that aimed to encourage long-term debt management and engagement.[36]
Ofgem has previously issued guidance to suppliers setting out its expectations on how consumers should be able to easily contact them.[37] The regulator is in the process of consulting on an outcomes-based model to further improve the standard and quality of how consumers engage with their energy supplier.[38]
4. Affordability of energy bills and supplier experience
Households feel their financial situation has improved since 2022, but many consumers are still facing energy affordability challenges; a third cannot afford to heat their home to a comfortable level. Similar to energy debt, affordability challenges are more prevalent among certain households, particularly low-income households.
Households’ financial circumstances are still recovering
The Scottish Consumer Sentiment Indicator, which surveys households each quarter, provides insight into whether consumers feel that their financial circumstances, their spending, and the economy generally, are improving or worsening. The latest results show that households continue to express concern about their financial circumstances, with negative consumer sentiment persisting.[39]
Similarly, our research found that the proportion of households managing well financially has improved since 2022; from 63% to a peak of 76% in winter 2025 and stands at 73% in winter 2026. While most households are managing well, the most recent data shows that improvements in household finances have levelled off over the past year.
Energy affordability challenges have reduced since 2022 but still affect a considerable number of consumers
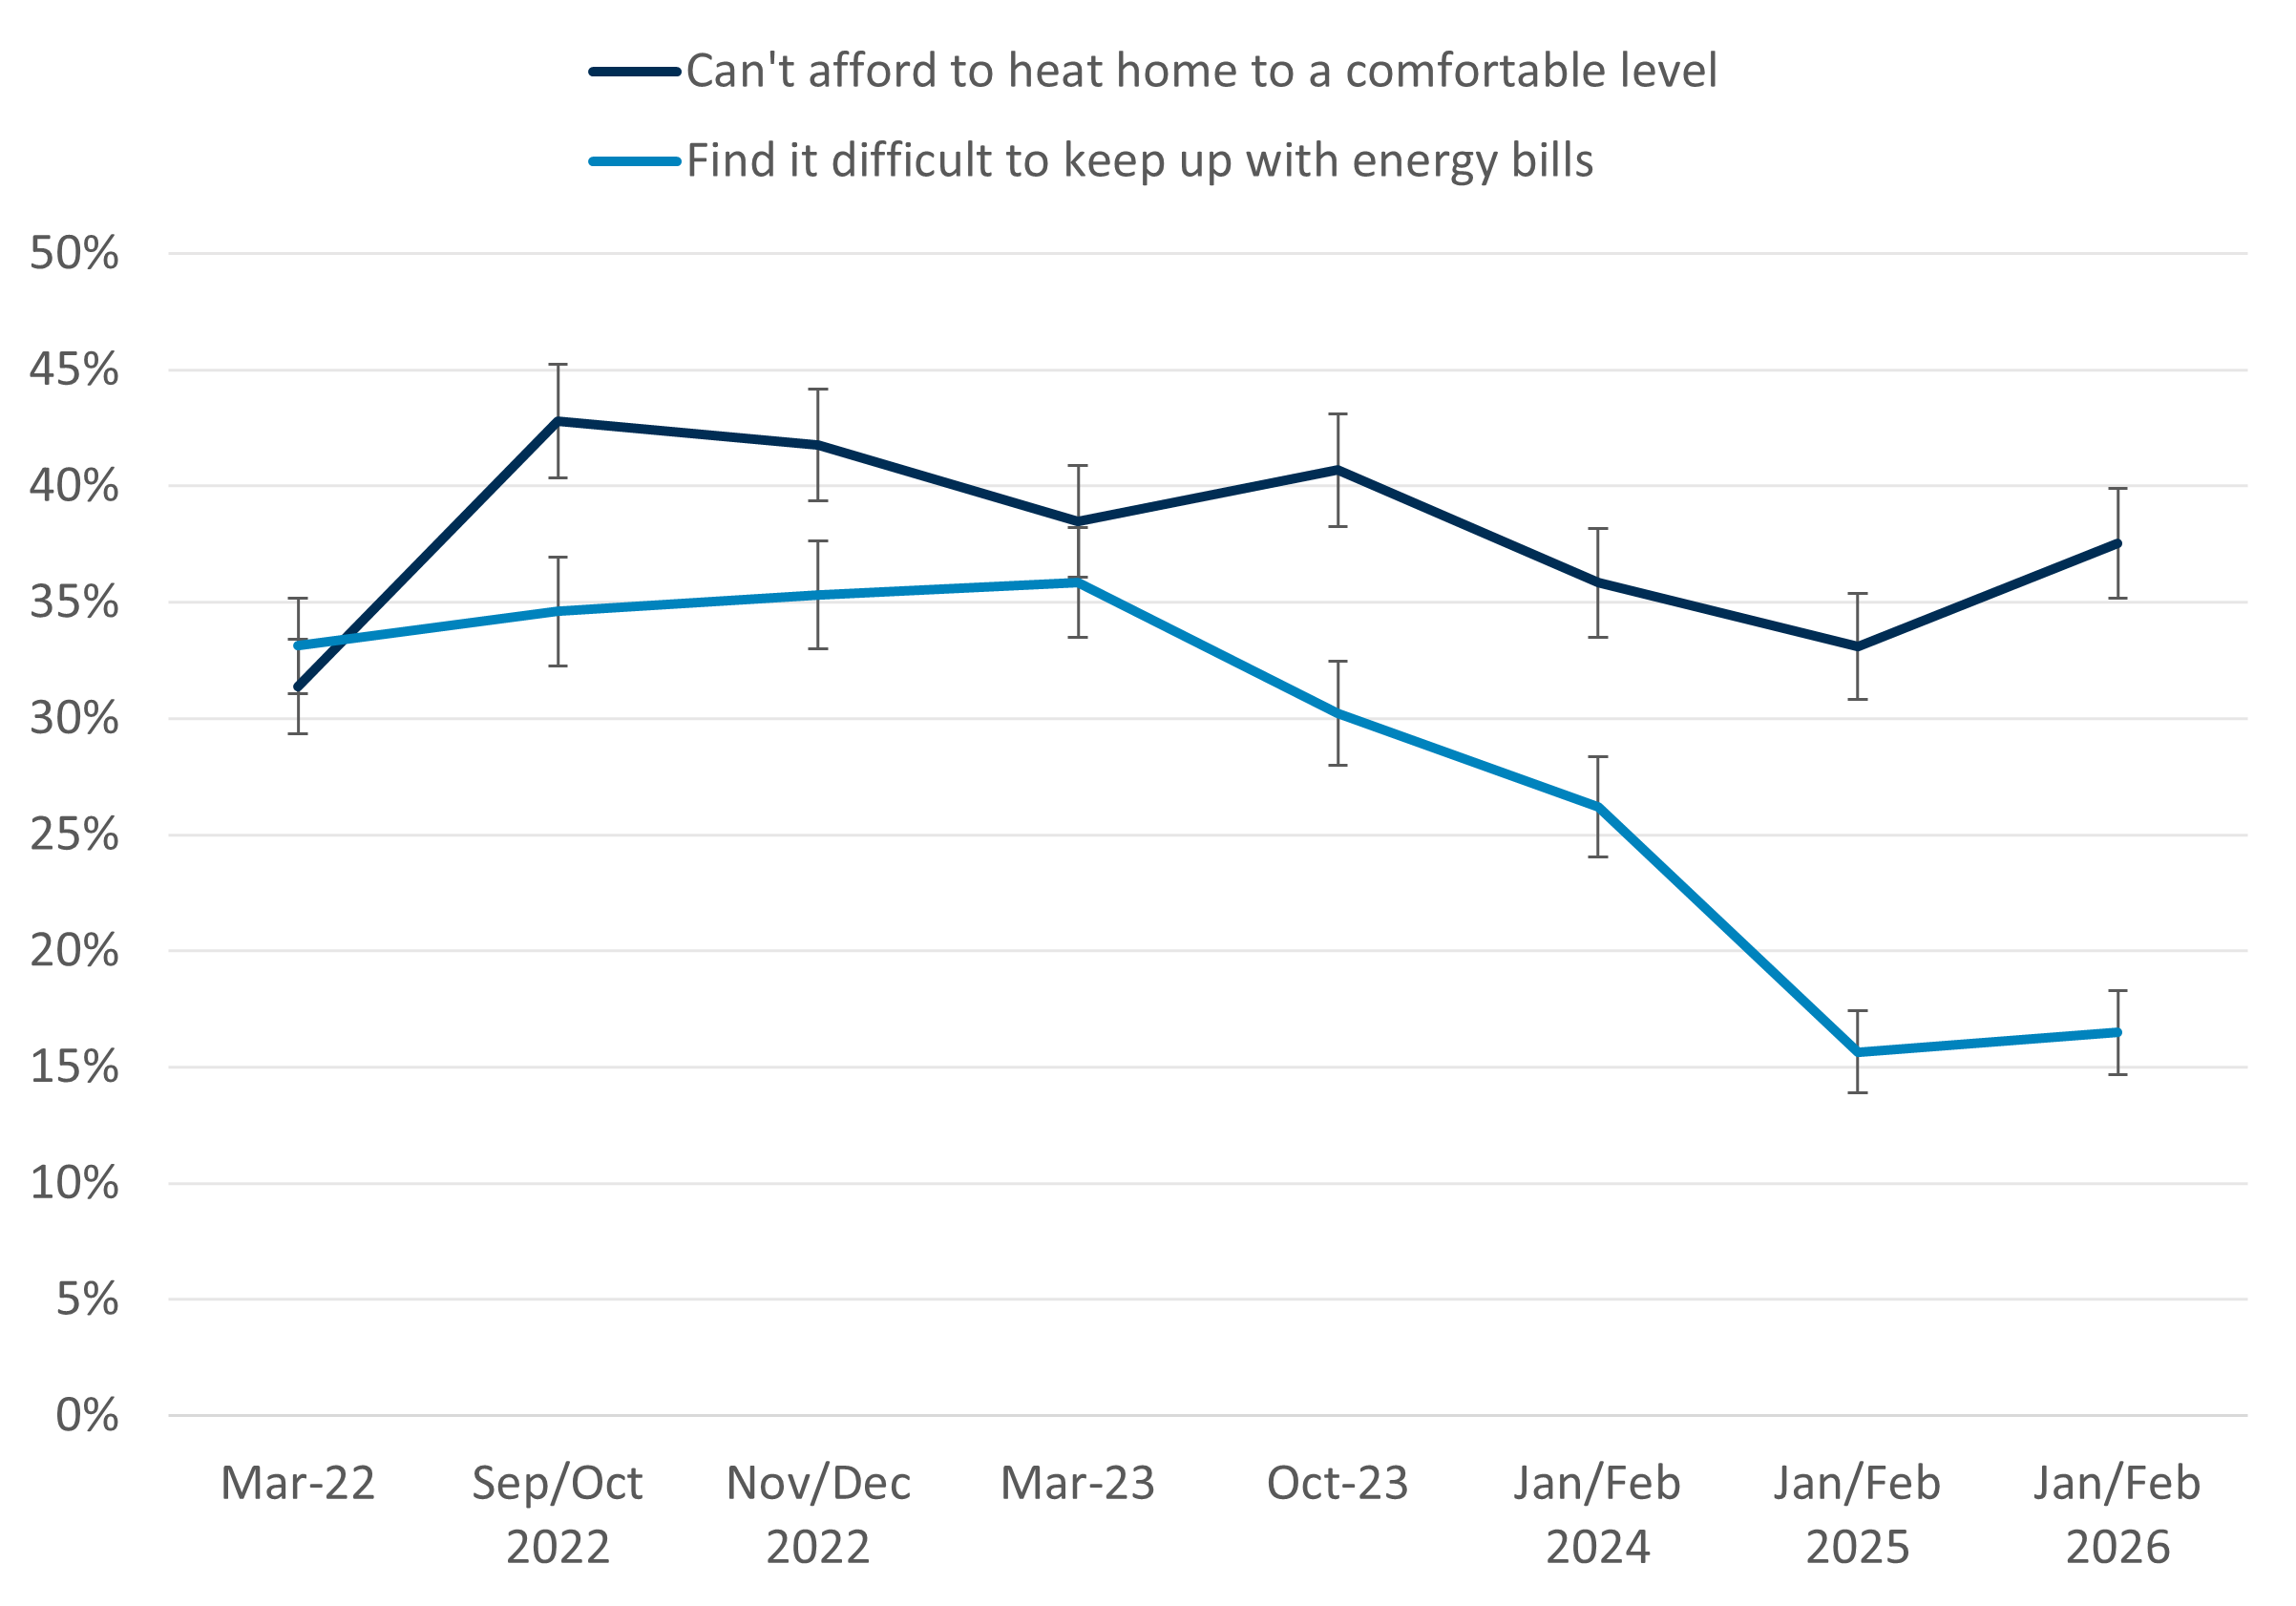
Consumers’ perceptions of energy affordability have generally improved since the 2022 energy crisis, although some indicators show renewed pressure this year (Chart 8).
A third of households (38%) in Scotland report that they cannot afford to heat their home to a comfortable level. This has increased since last year (33%) but remains slightly below the levels recorded in late 2022, when over 40% of households reported this.
Around one in six households (16%) said they find it difficult to keep up with their energy bills, the same as last year. While this is half the level seen at the peak in 2022 and 2023 (35-36%), the stabilisation over the past year suggests the previous improvements may now be levelling off.
The pressure of paying energy bills affects consumers’ health; a third (33%) of households reported that their mental health is negatively impacted “a lot” or “a fair amount” by keeping up with energy bills, while 27% said their physical health is negatively impacted. After improvements in winter 2024 and 2025, this figure has risen this year.
The Money and Mental Health Institute found that only 12% of consumers with mental health conditions have told their energy supplier about their condition[40] and that energy suppliers need to be doing more to better support those experiencing mental health problems.[41] More effort is needed by the UK and Scottish Governments as well as regulators to build and join up support for consumers across different sectors, such as through the currently paused Share Once Support Register/Priority Services Register.
Chart 8: Affordability of energy bills has improved but still over a third of households report that they cannot afford to heat their home to a comfortable level
Percentage of households who report that they cannot afford to heat home to a comfortable level because of financial concerns, and find it difficult to keep up with their energy bills, March 2022 to January/February 2026
Source: Consumer Scotland Energy Tracker, AFF9: To what extent do you agree or disagree with these statements... _1 I/we can’t afford to heat my/our home to a comfortable level because of financial concerns, AFF3: How easy or difficult is it for your household to keep up with your energy bills nowadays? Note: error bars represent 95% confidence intervals. Jan/Feb 2026 n=1,608, Jan/Feb 2025 n=1,656, Jan/Feb 2024 n=1,609, Oct 2023 n=1,589, Mar 2023 n=1,579, Nov/Dec 2022 n= 1,621, Sept/Oct 2022 n=1,586, Mar 2022 = 2,012.
Certain consumers are more likely to experience energy affordability challenges
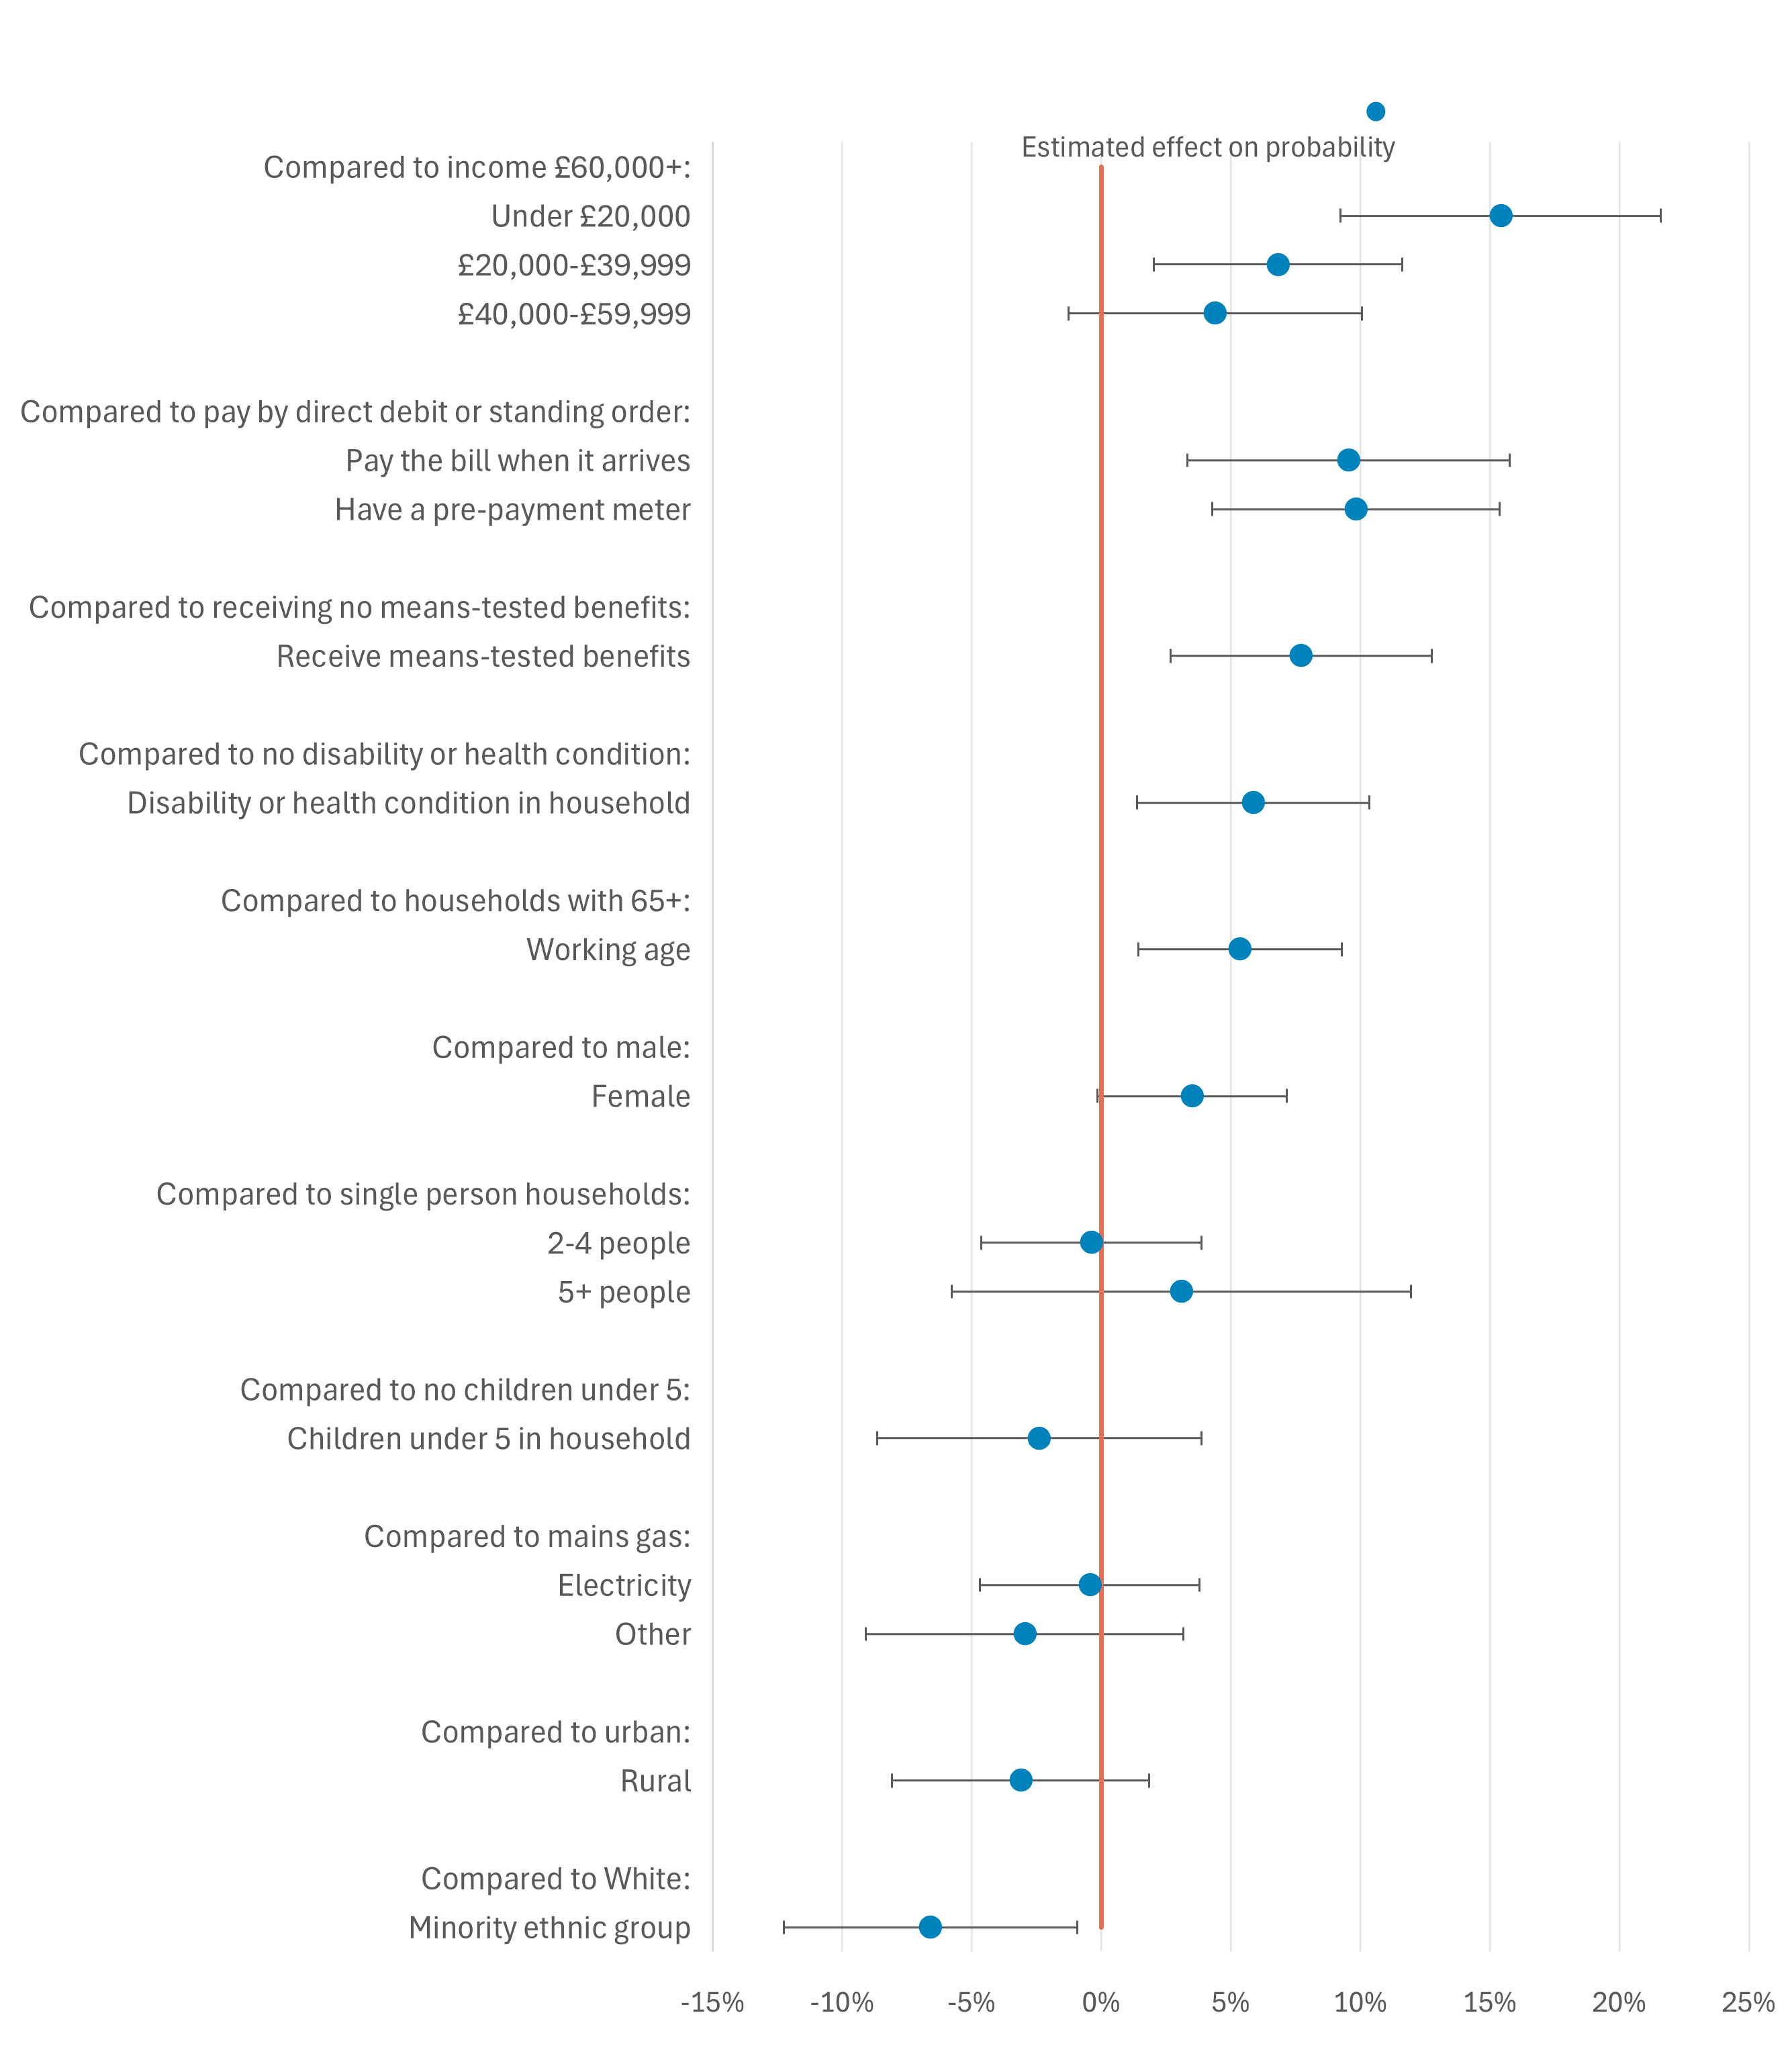
We performed a logistic regression to estimate the probability of a household finding it difficult to keep up with their energy bills. This model considers a range of household and demographic characteristics simultaneously, allowing us to identify which factors are independently associated with finding it difficult to keep up with their energy bills, after controlling for other variables.
Difficulty keeping up with energy bills is strongly associated with income and wider household circumstances (Chart 9). In particular, households in lower income bands are significantly more likely to report difficulty than those with incomes of £60,000 or more. Those with household incomes under £20,000 are estimated to be 15 percentage points more likely to find it difficult to keep up with energy bills, with smaller but still statistically significant increases observed for households earning £20,000-£39,999 (7 percentage points).
Beyond income, several indicators relating to financial vulnerability are also associated with a higher probability of difficulty paying energy bills: households who pay their bill when it arrives or have a prepayment meter; who receive means‑tested benefits; where a member has a disability or health condition; working‑age households (with no members aged 65 and over).
Overall, these associations are broadly consistent with those identified in our winter 2025 analysis and report. A more detailed discussion of the drivers of energy affordability and interpretation of these results is provided in Insights from the 2025 Energy Affordability Tracker.
Similar characteristics are also associated with a higher probability of households reporting that they cannot afford to heat their home to a comfortable level.
Chart 9: Low-income households are most strongly associated with higher risks of finding it difficult to keep up with energy bills
Logistic regression results on the probability of finding it difficult to keep up with energy bills, January/February 2026
Source: Consumer Scotland analysis of our Energy Tracker, C1/AFF3: How easy or difficult is it for your household to keep up with your energy bills nowadays? N = 1,608. Note: estimates are average marginal effects from a logistic regression and represent the percentage‑point change in the probability of difficulty keeping up with energy bills associated with each characteristic, relative to the reference category, holding other variables constant. Error bars show 95% confidence intervals; where these cross zero, the estimated effect is not statistically significant.
A third of consumers recently sought advice about paying their energy bills
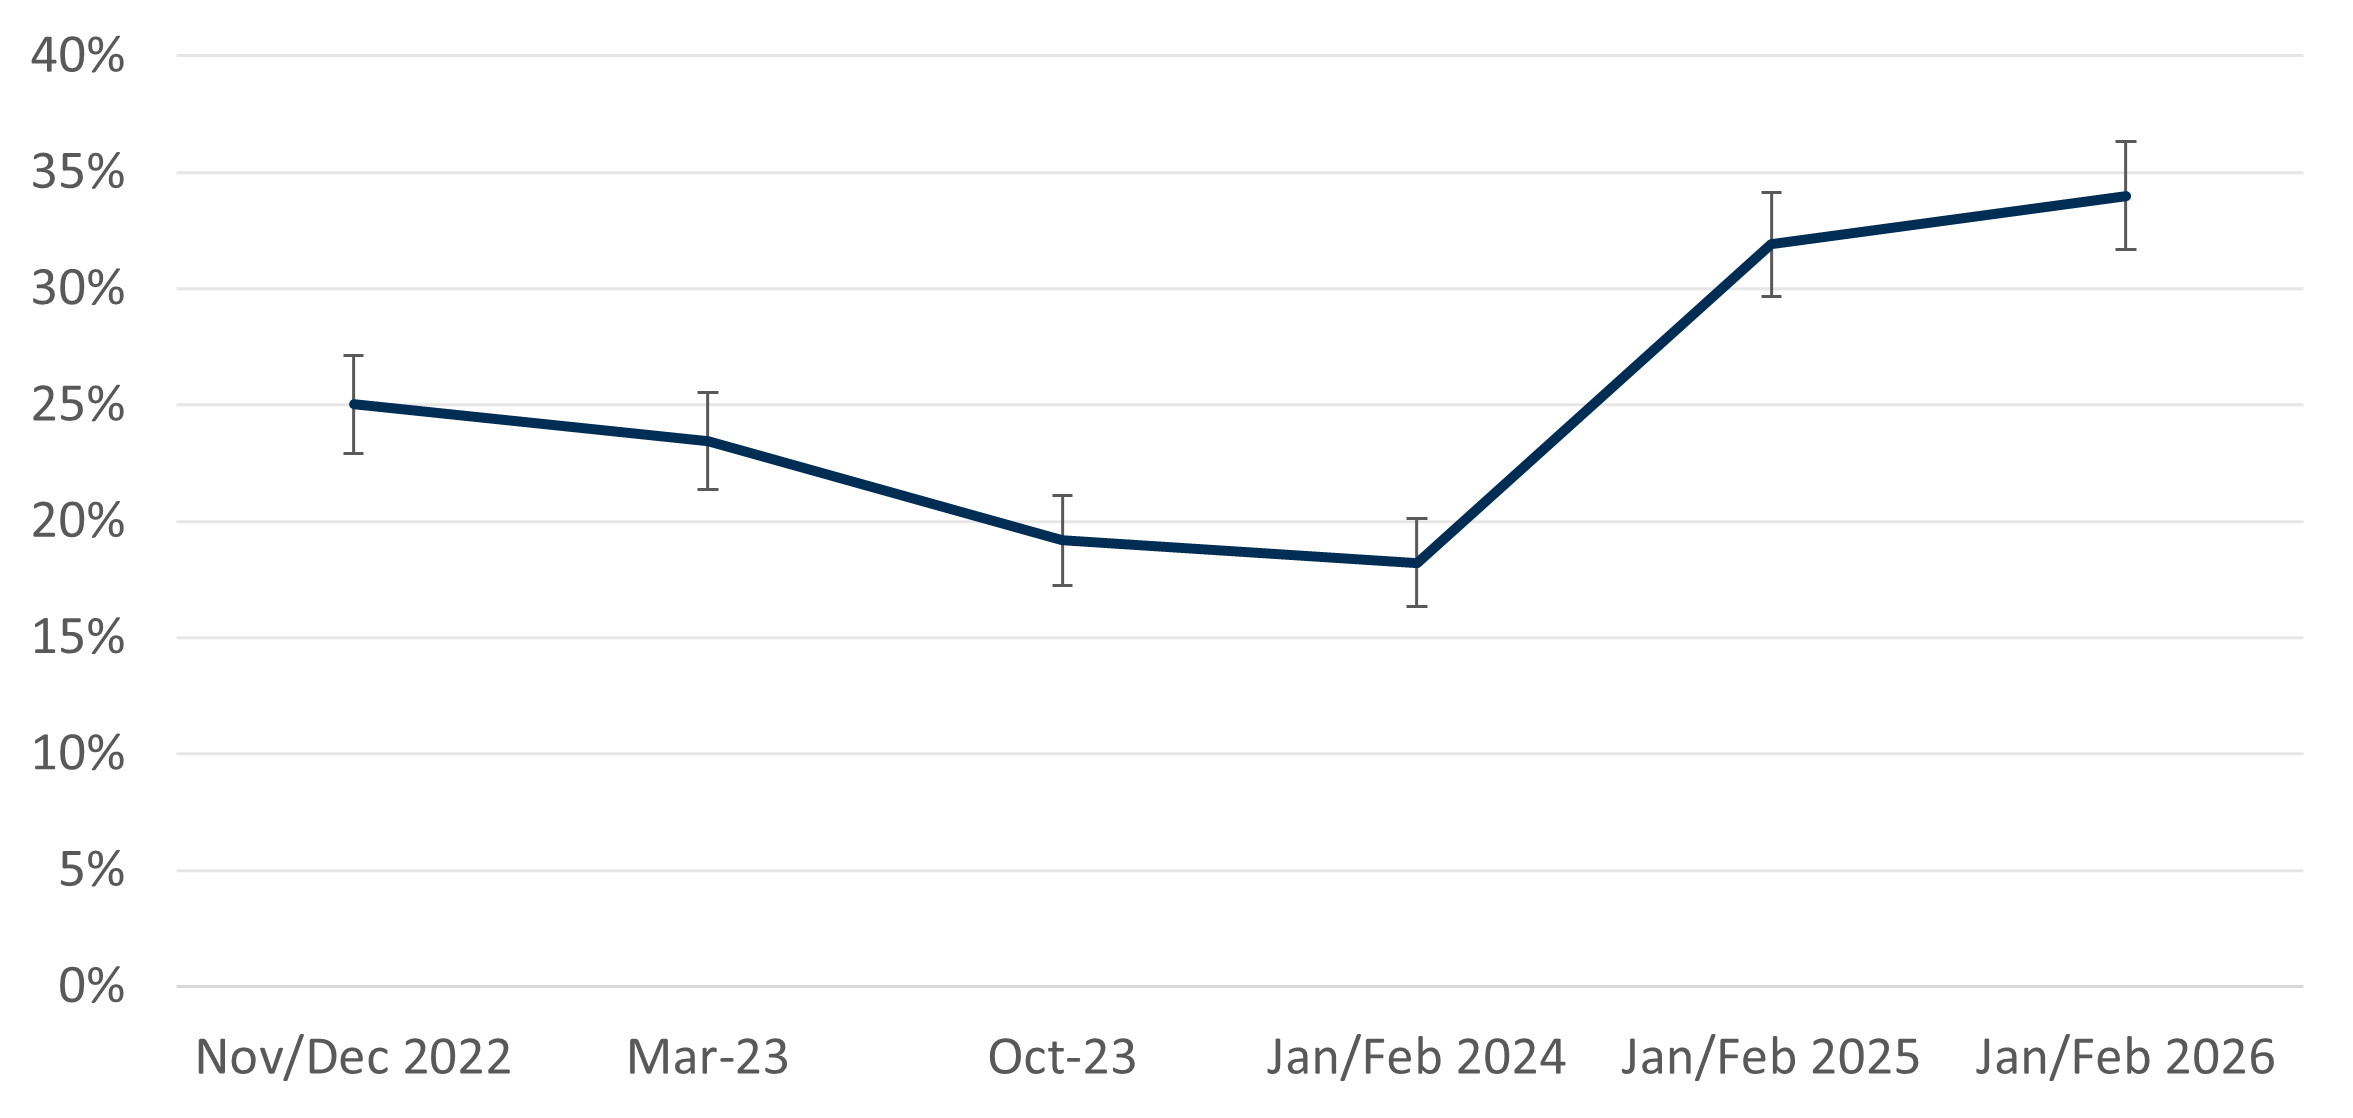
A third (34%) of households reported that they had sought advice about paying their energy bills in the last 3 months (Chart 10). Similar to last year, this figure has doubled since winter 2023-2024 (18%). This increase is encouraging, as greater engagement allows energy suppliers to offer support such as repayment plans to help manage debt and prevent it from escalating. It may also allow consumers to access help for persistent debt through the proposed Debt Relief Scheme, which requires customers to contact their supplier about their debt to get support.
Of those who sought advice, the most reported source was friends or family (51%), followed by their energy company (36%) and local council (25%). Smaller numbers sought advice in person at their local advice centre, from an advice phone line, and from a money advice charity (all 14%). This suggests that consumers are more reliant on informal sources of advice such as friends and family, potentially limiting access to the necessary formal support schemes.
Chart 10: Over a third of respondents have recently sought advice about paying energy bills
Percentage of respondents who sought advice in the last 3 months about paying their energy bills, November/December 2022 to January/February 2026
Source: Consumer Scotland Energy Tracker, D7/AFF18: In the last 3 months, which, if any, of the following have you sought advice from about paying your energy bills, this could be online, over the phone, or in person (unless stated otherwise in the options below)? Note: error bars represent 95% confidence intervals. Jan/Feb 2026 n=1,608, Jan/Feb 2025 n=1,656, Jan/Feb 2024 n=1,609, Oct 2023 n=1,589, Mar 2023 n=1,579, Nov/Dec 2022 n= 1,621.
Four in ten consumers have received financial support to help pay for energy
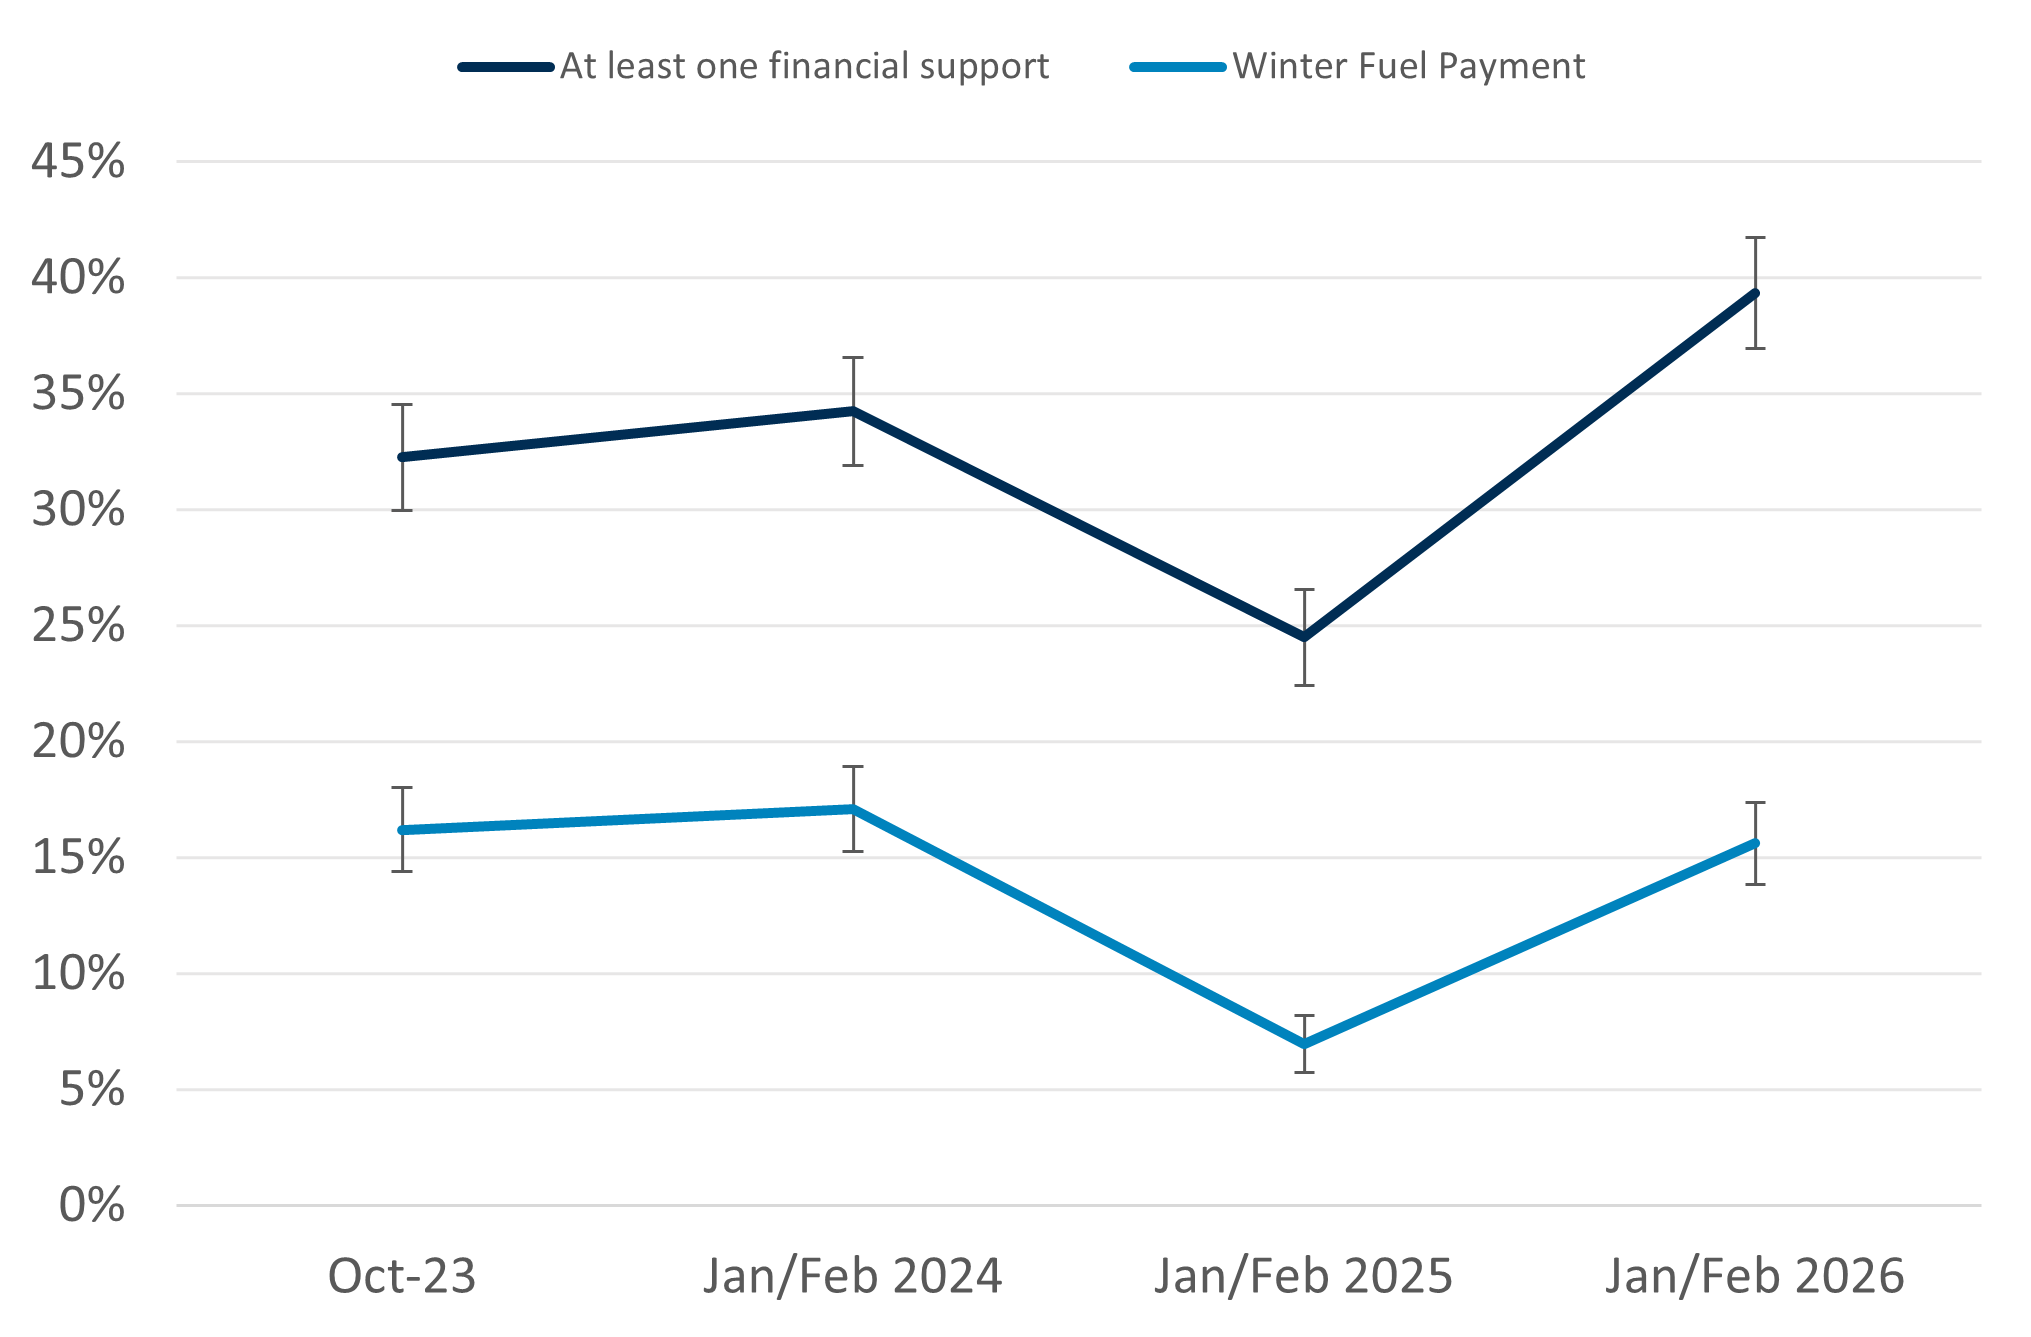
The proportion of households receiving financial support to help with the cost of energy increased this year, with just under four in ten respondents (39%) having received at least one form of support. This is the highest level recorded since this question was first asked, in October 2023 (Chart 11).
Last year saw a notable dip, with around a quarter of respondents reporting receipt of any financial support. This decline likely reflects reduced eligibility and availability of some schemes, including restrictions to Winter Fuel Payment during winter 2024-2025. This policy change was subsequently reversed for winter 2025-26 which may be contributing to the increase observed this year, as the proportion of respondents receiving Winter Fuel Payment (now ‘Pension Age Winter Heating Assistance’) is now more closely aligned with levels seen in 2023 and early 2024.
The most common types of financial support were Pension Age Winter Heating Payment (previously Winter Fuel Payment), received by 16% of all respondents, and the Warm Home Discount, received by 11%.
Chart 11: Four in ten respondents received financial support to help pay for energy
Percentage of respondents who have received financial support to help their household with the cost of energy, October 2023 to January/February 2026
Source: Consumer Scotland Energy Tracker, APP16b/D6. Have you or anyone in your household received any of the following forms of financial support to help your household with the cost of energy? Note: error bars represent 95% confidence intervals. Jan/Feb 2026 n=1,608, Jan/Feb 2025 n=1,656, Jan/Feb 2024 n=1,609, Oct 2023 n=1,589.
Most consumers are satisfied with their energy supplier
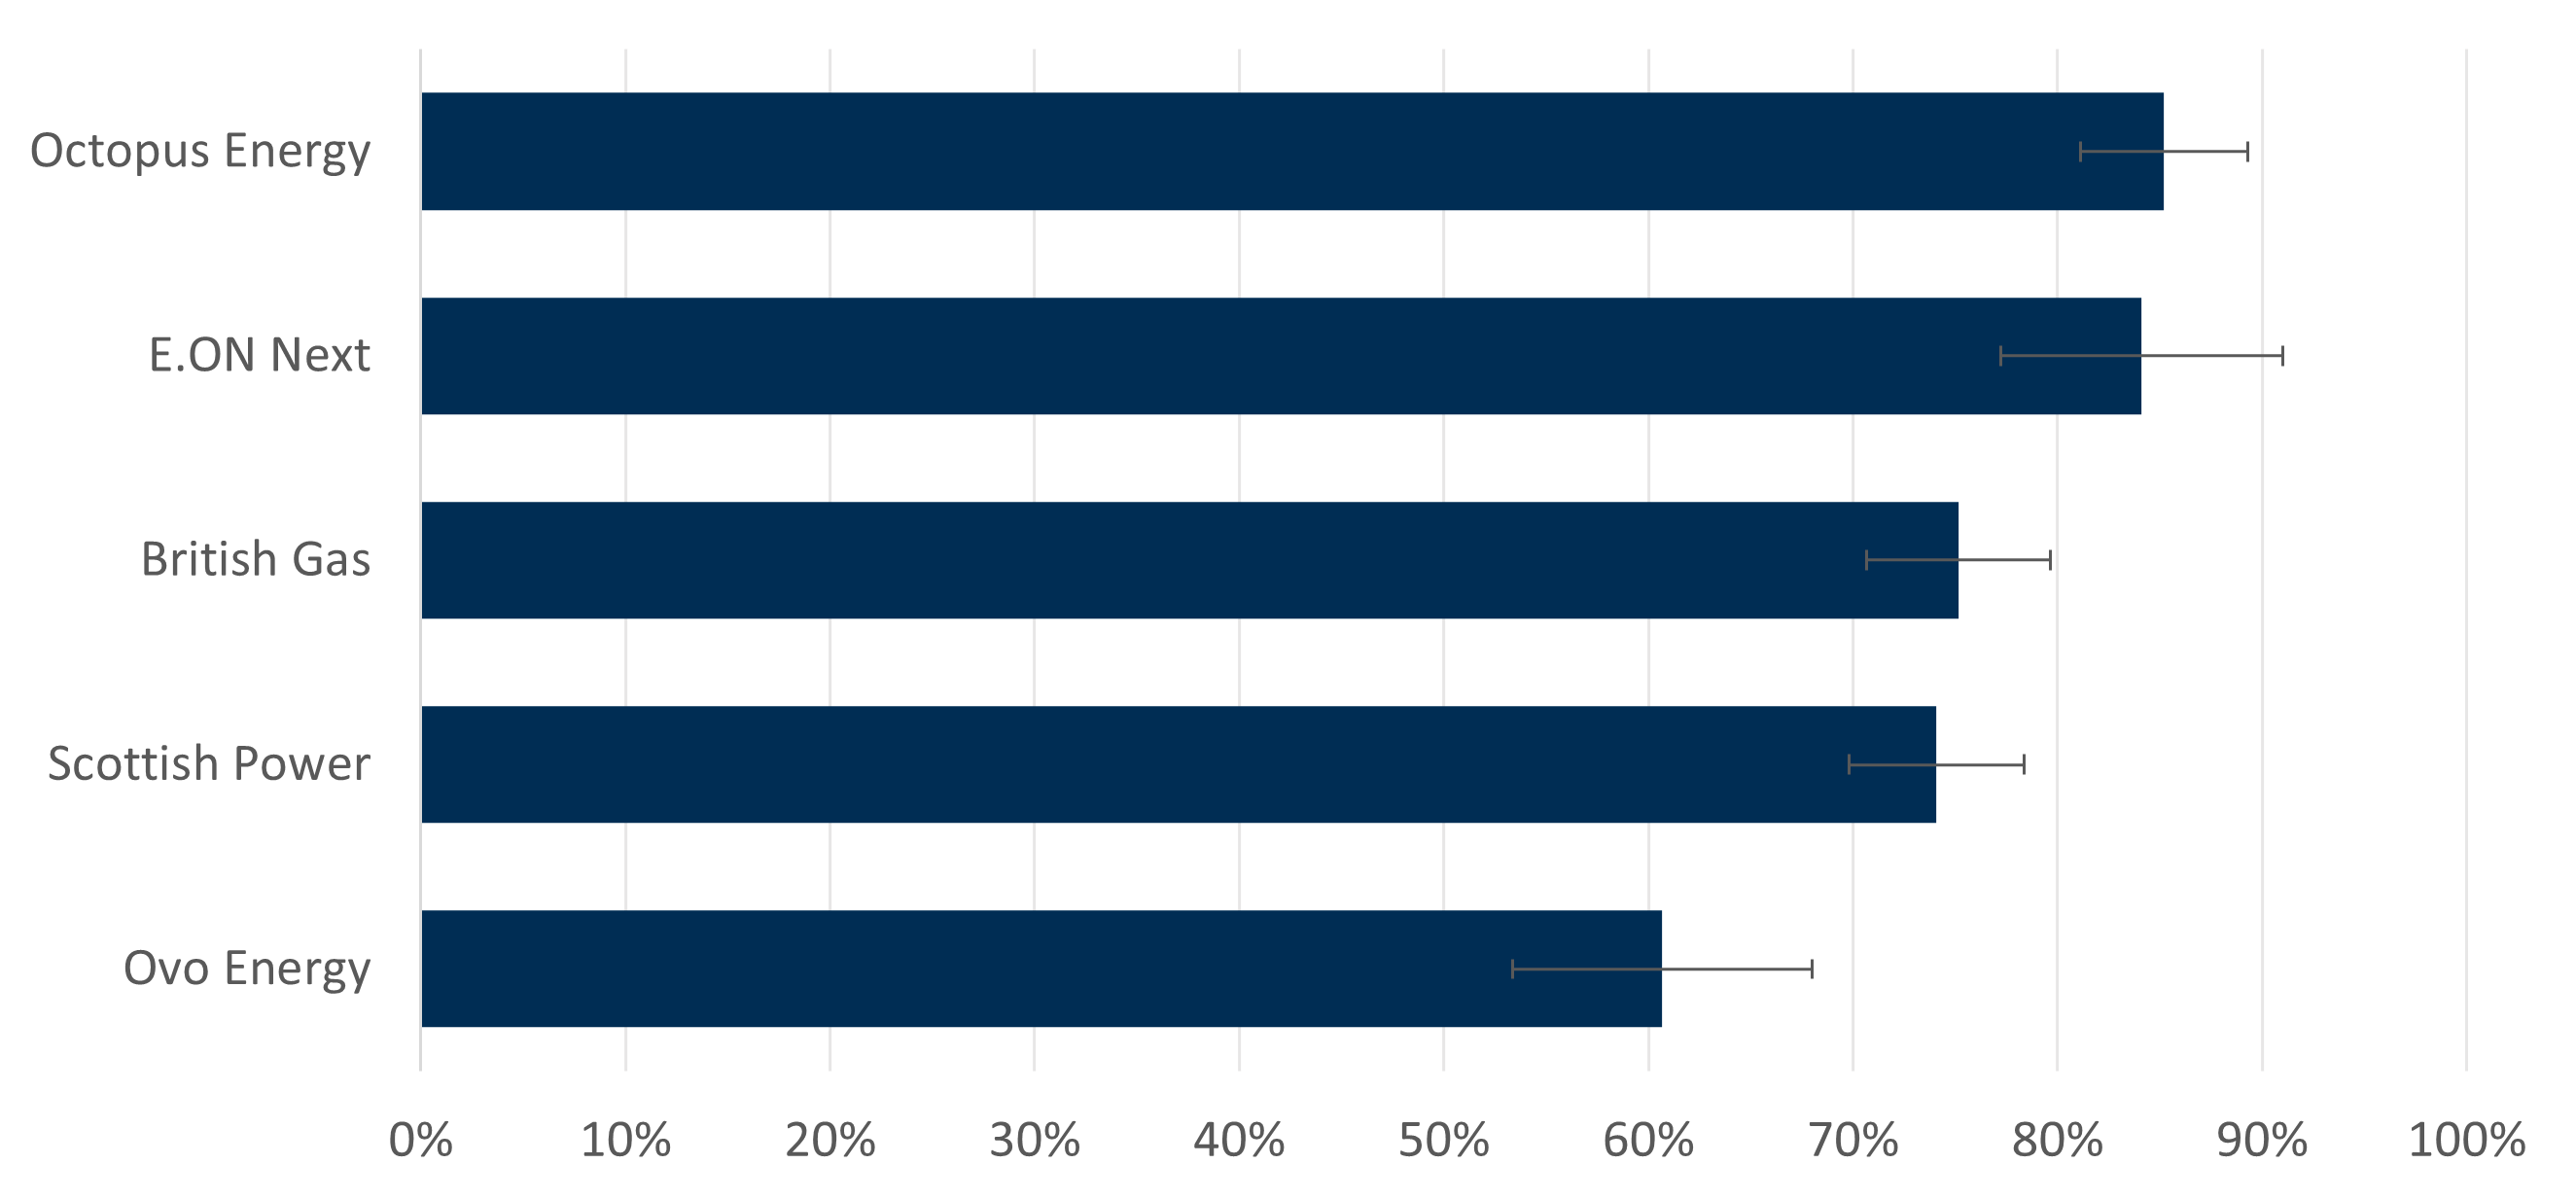
Most (76%) consumers in Scotland are ‘very’ or ‘fairly’ satisfied with their energy supplier, slightly less than the satisfaction level (82%) found by Ofgem and Citizen Advice’s Energy Consumer Satisfaction Survey (ECSS).[42]
Satisfaction with energy supplier varied across providers (Chart 12). The vast majority of Octopus Energy and E.ON Next consumers were satisfied with their energy supplier (85% and 84%). Around a quarter of British Gas and Scottish Power consumers were satisfied (75% and 74%). Ovo Energy had the lowest rates of satisfaction, with 61% of consumers being satisfied, 24% being neither satisfied nor dissatisfied, and 13% being dissatisfied. These findings are broadly aligned with Citizens Advice energy supplier rankings, where Octopus Energy and E.ON Next appear within the top 5, while the rankings of the other suppliers are less consistent.[43]
Chart 12: Satisfaction with energy supplier was high across most suppliers, but notably low for Ovo Energy
Percentage of respondents who are ‘very’ or ‘fairly’ satisfied with their energy supplier, by energy supplier, January/February 2026
Source: Consumer Scotland Energy Tracker, B1a. How satisfied are you with your energy supplier? Note: analysis only includes energy suppliers with more than 100 respondents in our survey. Note: error bars represent 95% confidence intervals. N=1,608.
69% of consumers said their supplier makes it easy to contact them if they need to, slightly more than what the ECSS found in Q1 2026 (66%).[44] Around four in ten (39%) of consumers have contacted their supplier in the last six months, particularly those in energy debt (67%) and those with children under five (54%). Most (72%) consumers who had contacted their supplier felt that their issue or query was dealt with well, but 15% felt that it was not.
Most consumers (68%) found the language used in their energy bill easy to understand, however 14% of consumers found it difficult. Additionally, 12% said the energy bills they receive do not provide guidance on what to do if they are worried about paying their bill.
One in five (22%) respondents reported that their energy supplier was the only one available to them. This represents an increase compared to previous waves and is the highest recorded to date (Chart 13). This figure increased steadily since January/February 2024, following a lower point in October 2023.
Chart 13: One fifth of respondents feel that their energy supplier is the only one available to them, higher than previous years
Percentage of respondents who reported that their energy supplier is the only one available to them, March 2022 to January/February 2026
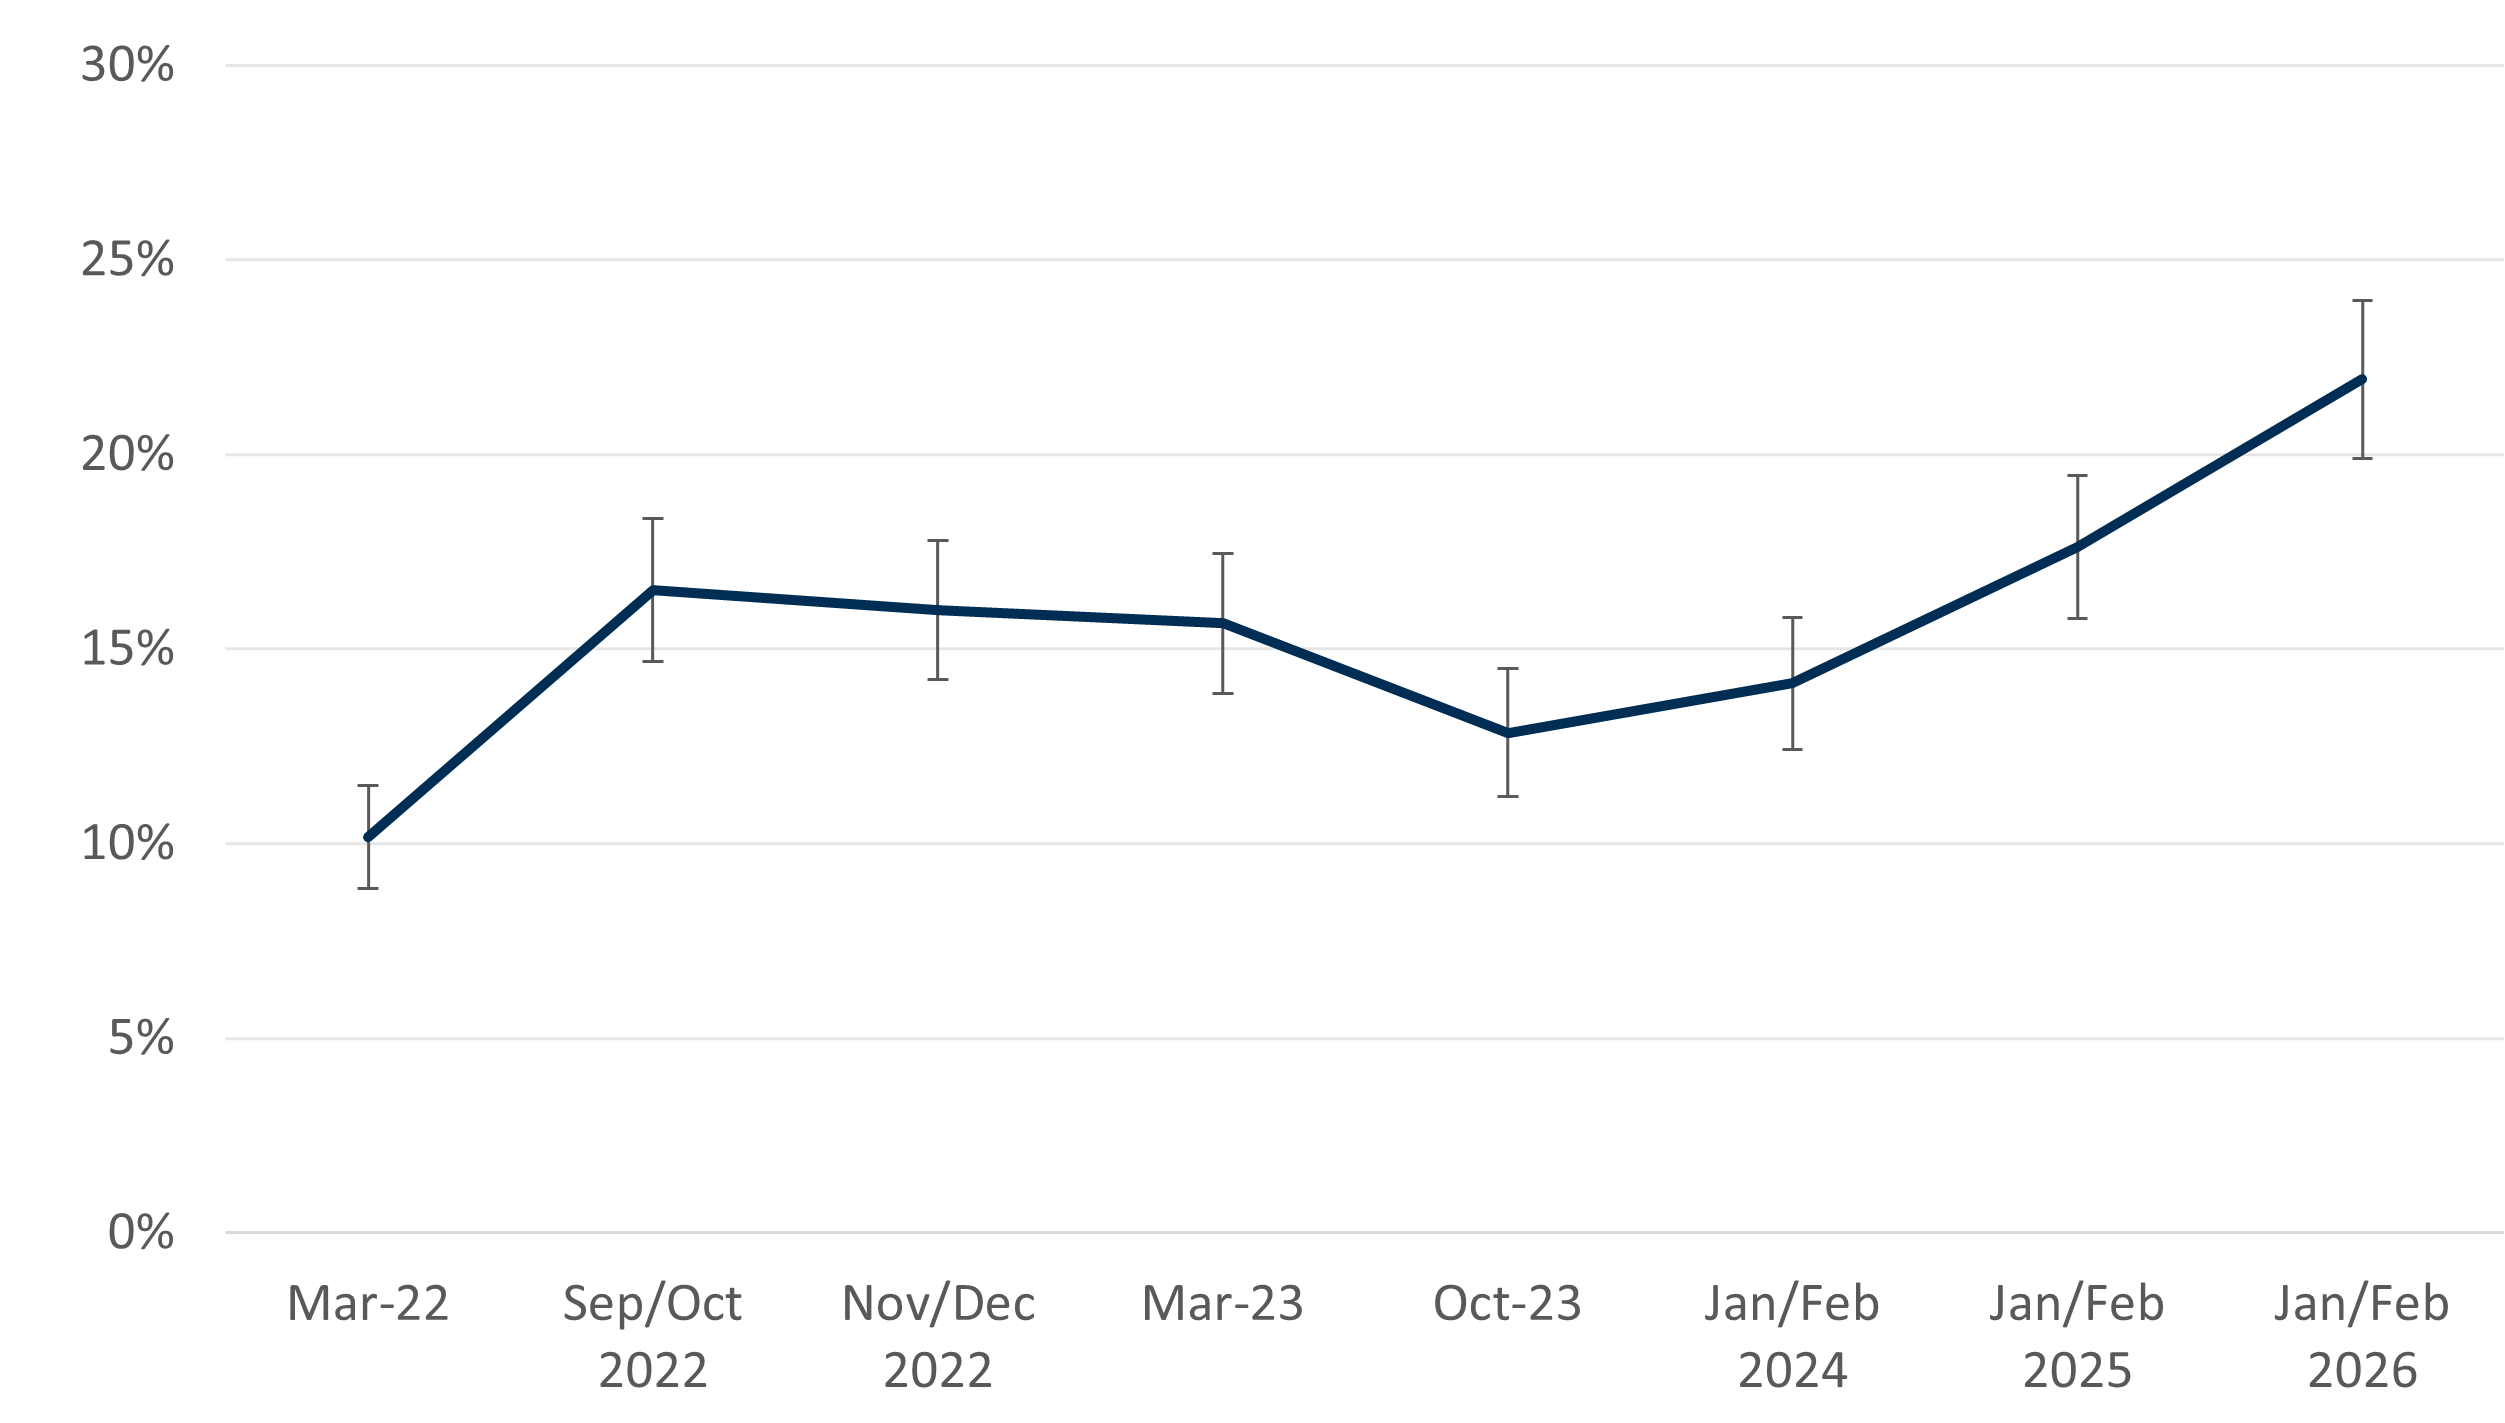
Source: Consumer Scotland Energy Tracker, B2/SER1. When thinking of your energy supplier, how much do you agree or disagree with the following statements?_2 The supplier I use is the only one available to me. Note: error bars represent 95% confidence intervals. Jan/Feb 2026 n=1,608, Jan/Feb 2025 n=1,656, Jan/Feb 2024 n=1,609, Oct 2023 n=1,589, Mar 2023 n=1,579, Nov/Dec 2022 n= 1,621, Sept/Oct 2022 n=1,586, Mar 2022 = 2,012.
5. Conclusions and priorities for action
Conclusions
The eighth wave of our energy affordability tracker on the experience of energy consumers in Scotland found that:
- The proportion of households in Scotland in energy debt has risen steadily since 2023 and now stands at 19%
- Most energy debt is new (under a year old) and does not involve a formal debt repayment plan or debt recovery action
- Of those in energy debt, 36% report having been put on a prepayment meter due to their debt
- Energy affordability challenges have eased overall but still affect a considerable number of consumers; 38% of households in Scotland cannot afford to heat their home to a comfortable level
- Energy debt and affordability challenges are more prevalent among households facing financial or health‑related pressures – such as those receiving means-tested benefits, households where a member has a disability or health condition, low-income households, and working-age households
- Most (76%) consumers in Scotland are satisfied with their energy supplier
Priorities for action
These findings point to the areas where more action is needed to ensure consumers are getting the best possible experience in the energy sector. Key priorities must be ensuring affordability supports are fit for purpose, and that consumers have sufficient ability and encouragement to flex their demand in future, to help bring down their own bills and reduce the cost of the system in its entirety.
As we set out throughout this paper, action by governments, regulators and industry can help to deliver these priorities through:
- targeted affordability support for those households that need it most, through better use of data held by the UK and Scottish governments
- debt relief for certain households with no ability to repay, where doing so helps to reduce the cost borne by all other households
- ensuring that the smart meter roll-out is effective and that smart meters are working to better support accurate billing for consumers but also unlocking opportunities for flexible tariffs and energy demand
- ensuring communications to consumers keep pace with a changing market, particularly in light of an expected increase in time-of-use and flexible tariffs
Consumer Scotland will continue to advocate on these issues to support the delivery of a better energy system that works for all consumers, and meets their needs in both the short- and long-term.
6. Endnotes
[1] Ofgem (2026). Energy price cap explained. Available at: https://www.ofgem.gov.uk/information-consumers/energy-advice-households/energy-price-cap-explained
[2] Ofgem (2025). Debt and arrears indicators. Available at: https://www.ofgem.gov.uk/data/debt-and-arrears-indicators
[3] Ember (2026). Latest energy shock reminds Europe of its risky gas reliance. Available at: Latest energy shock reminds Europe of its risky gas reliance | Ember
[4] In April 2026 the UK Government published its review of Ofgem, describing it as the “first step” in giving Ofgem the power to regulate the heating oil market.
[5] HM Treasury (2026). Over £50 million to help families struggling with soaring heating oil costs. Available at: https://www.gov.uk/government/news/over-50-million-to-help-families-struggling-with-soaring-heating-oil-costs
[6] Scottish Government (2026). Support for households using heating oil and LPG. Available at: https://www.gov.scot/news/support-for-households-using-heating-oil-and-lpg/
[7] Cornwall Insight (2026). Predictions & Insights into the Default Tariff Cap. Available at: Predictions & Insights into the Default Tariff Cap (Price Cap) - Cornwall Insight
[8] Scottish Government (2026). Scottish House Condition Survey: 2024 Key Findings. Available at: https://www.gov.scot/publications/scottish-house-condition-survey-2024-key-findings/pages/3-fuel-poverty/
[9] DESNZ (2026). New Measures Coming in to Ease Cost of Living Pressure: 1 April 2026. Available at: New measures coming in to ease cost of living pressure: 1 April 2026 - GOV.UK
[10] Office for National Statistics (2025). Domestic electricity consumption. Available at: https://www.ons.gov.uk/explore-local-statistics/indicators/domestic-electricity-consumption
[11] DESNZ (2025). Energy Consumption in the UK 2025. Available at: https://www.gov.uk/government/statistics/energy-consumption-in-the-uk-2025
[12] Consumer Scotland analysis of ONS Consumer Trends: Consumer trends, UK - Office for National Statistics
[13] Ofgem (2025). Debt and arrears indicators. Available at: https://www.ofgem.gov.uk/data/debt-and-arrears-indicators
[14] Ofgem (2025). Debt Relief Scheme: Statutory Consultation. Available at: https://www.ofgem.gov.uk/consultation/debt-relief-scheme-statutory-consultation
[15] Ofgem (2025). Debt strategy update: supporting the reduction of energy debt. Available at: https://www.ofgem.gov.uk/policy/debt-strategy-update-supporting-reduction-energy-debt
[16] Bank of England (2026). Monetary Policy Report - April 2026. Available at: https://www.bankofengland.co.uk/monetary-policy-report/2026/april-2026
[17] Scottish Government (2026). Scottish House Condition Survey: 2024 Key Findings. Available at: https://www.gov.scot/publications/scottish-house-condition-survey-2024-key-findings/pages/1-key-attributes-of-the-scottish-housing-stock/
[18] Consumer Scotland (2022). Consumer Spotlight: Energy Affordability Tracker 1 November 2022. Available at: https://consumer.scot/publications-old/consumer-spotlight/consumer-spotlight-energy-affordability-tracker-1-november-2022/
[19] Consumer Scotland (2023). Consumer Spotlight: Energy Affordability Tracker 2. Available at: https://consumer.scot/publications/consumer-spotlight-energy-affordability-tracker-2/
[20] Consumer Scotland (2023). Consumer Spotlight: Energy Affordability Tracker 3. Available at: https://consumer.scot/publications/consumer-spotlight-energy-affordability-tracker-3/
[21] Consumer Scotland (2023). Energy Tracker: Insights from Autumn 2023. Available at: https://consumer.scot/publications/energy-tracker-insights-from-autumn-2023/
[22] Consumer Scotland (2024). Insights from latest Energy Affordability Tracker: Causes and impact of energy debt. Available at: https://consumer.scot/publications/insights-from-latest-energy-affordability-tracker-causes-and-impact-of-energy-debt/
[23] Consumer Scotland (2025). Insights from the 2025 Energy Affordability Tracker. Available at: https://consumer.scot/publications/insights-from-the-2025-energy-affordability-tracker/
[24] All references to ‘energy debt’ in our survey include energy debt and arrears.
[25] Household income is self‑reported and aggregated into relatively broad income bands. Responses are not independently verified and may be subject to reporting error or uncertainty. As a result, income may be measured with some imprecision in the analysis. This means that income as an explanatory variable might not have as much explanatory power as we might expect it to if it were measured more precisely.
[26] The full list of variables controlled for in the logistic regression are: household income, gender, rurality, ethnicity, disability or health condition in household, children under five in household, over-65-year-olds in household, household size, means-tested benefits, main heating type, payment method.
[27] For further detail, see the accompanying data tables. These provide breakdowns of each survey question by individual and household characteristics, and indicate which differences observed in the descriptive statistics are statistically significant.
[28] Scottish Government (2026). Payments, grants and discounts to help with energy bills. Available at: Payments, grants and discounts to help with energy bills - mygov.scot
[29] Consumer Scotland (2024). Energy Affordability Policy. Available at: Energy Affordability Policy - October 2024 | Consumer Scotland
[30] Consumer Scotland (2025). Ofgem statutory consultation on Phase 1 of a Debt Relief Scheme. Available at: Ofgem statutory consultation on Phase 1 of a Debt Relief Scheme (HTML) | Consumer Scotland
[31] Consumer Scotland (2025). Response to DESNZ consultation on continuing the Warm Home Discount Scheme. Available at: Response to DESNZ consultation on continuing the Warm Home Discount Scheme | Consumer Scotland
[32] Ofgem (2025). Debt and arrears indicators. Available at: https://www.ofgem.gov.uk/data/debt-and-arrears-indicators
[33] This question was asked to all respondents reporting being in energy debt, including those not on a formal repayment plan. Analyses referencing this question therefore either apply a broad definition of repayment (49% finding it easy to keep up with) or, where stated, limit the base to respondents on a formal debt repayment plan (59% finding it easy to keep up with).
[34] Ofgem (2025). Energy consumer outcomes. Available at: Energy consumer outcomes | Ofgem
[35] Ofgem (2025). Debt and arrears indicators. Available at: https://www.ofgem.gov.uk/data/debt-and-arrears-indicators
[36] Ofgem (2025) Debt Relief Scheme: Statutory Consultation. Available at: Debt Relief Scheme: Statutory Consultation
[37] Ofgem (2025). What we expect suppliers to do so consumers can contact them. Available at: Guidance on Ofgem’s expectations for consumers to be able to contact their supplier
[38] Ofgem (2025). Energy consumer outcomes. Available at: Energy consumer outcomes | Ofgem
[39] Scottish Government. Economy statistics - Scottish Consumer Sentiment Indicator. Available at: https://www.gov.scot/collections/economy-statistics/
[40] Money and Mental Health Policy Institute (2026). Stuck on repeat. Available at: Stuck on repeat - Money and Mental Health Policy Institute
[41] Money and Mental Health Policy Institute (2025). Power to help. Available at: Power to help - Money and Mental Health Policy Institute
[42] Ofgem (2025). Energy Consumer Satisfaction Survey: July to August 2025. Available at: https://www.ofgem.gov.uk/research/energy-consumer-satisfaction-survey-july-august-2025#:~:text=Overall%20satisfaction%20continues%20to%20rise,in%20July%20and%20August%202025.
[43] Citizens Advice. Compare energy suppliers' customer service - Citizens Advice. Available at: https://www.citizensadvice.org.uk/consumer/energy/energy-supply/get-a-better-energy-deal/compare-domestic-energy-suppliers-customer-service/
[44] Ofgem (2026). Customer service data. Available at: https://www.ofgem.gov.uk/news-and-insight/data/data-portal/customer-service-data