1. Executive Summary
The energy price cap has increased over the past 12 months, from £1,690 in April 2024 to £1,849 in April 2025. Moreover, whilst energy bills have declined somewhat from their peak in winter 2022-2023, they remain substantially elevated on pre-2022 levels, posing ongoing challenges for households and exacerbating difficulties in getting back on track for those who have fallen behind with their payments.
One of the legacies of the past three years of high bills has been a growth of energy debt and arrears, which in the GB domestic market has reached £3.85bn – a record high level.
Consumer Scotland has been tracking people’s perception of the affordability of energy bills regularly since March 2022. This report summarises the findings from the seventh wave of our energy tracker survey, fieldwork for which was undertaken between 31 January and 14 February 2025.
Key findings
Energy bills are becoming more affordable, but energy debt or arrears accumulated during the cost-of-living crisis, and consumers are still facing significant affordability challenges.
- Bills are perceived as being more affordable in 2025 than was the case during the peak of crisis in 2022 and 2023. Our headline measure shows that 16% of respondents (equivalent to 393,000 households) find it difficult to keep up with their energy bills, down from 26% at the same time in 2024 and 35% in winter 2022-2023.
- But several legacies of the energy price crisis remain. The proportion of respondents to our survey in energy debt has increased to 15% (equivalent to 383,000 households in Scotland), a statistically significant rise from 9% the same time last year.
- Whilst perceptions of affordability have improved, a significant number of consumers continue to face affordability challenges. 33% of respondents to our survey said they cannot heat their home to a comfortable level because of affordability concerns; lower than during the peak of the crisis, but only slightly. Our findings are consistent with the idea that consumers are managing the affordability of their bills by reducing their energy use.
- Some groups of consumers are consistently more likely to face affordability challenges and to be in energy debt. These include those on lower incomes, those with a long-term health condition or disability, and younger age groups.
- There has been a doubling in the number of consumers on a prepayment meter due to their debt. 34% of respondents in energy debt or arrears reported that they have been put on a prepayment meter due to their debt, an increase from last year (16%).
Conclusions
Affordability of energy bills has improved since the peak of the crisis, but affordability challenges remain acute for some groups, and there are ongoing legacies of the energy cost crisis in terms of energy debt and anxiety for consumers.
There are several implications.
In the short term, this reiterates the need for further targeted energy bill support at those consumers who need it most. Proposed changes to the Warm Homes Discount are broadly welcome but there is a need for deeper support for some – and proposed reforms must be designed to work for consumers in Scotland.
Reform of affordability policy – and welcome proposals to provide debt relief to customers who accumulated energy debt during the crisis period – provide opportunities to use administrative data more effectively to target support. The UK and Scottish governments should work at pace to capitalise on these opportunities.
As well as reforms to affordability support and debt relief schemes, a number of broader changes are underway in the energy retail market. These include for example a growing number of time-of-use tariffs that provide opportunities for consumers to reduce bills by varying when or how they use energy. Consumer Scotland will shortly publish work setting out the opportunities and risks for consumers arising from the developments.
In the slightly longer term, debates are underway about more fundamental reforms to the structure of energy wholesale markets. These reforms could have significant impacts on customer bills. Consumer Scotland will soon be publishing analysis of the Review of Electricity Market Arrangements (REMA), and the opportunities and risks this poses consumers in Scotland.
It is vital that any proposals taken forward must ensure that consumers do not lose out from the energy transition, and that a comprehensive and coherent approach is taken to energy bill support for consumers in vulnerable circumstances.
2. Introduction
We are now a two years past the peak of the crisis in the wholesale energy market, where significant interventions were made by governments to ensure that consumers could continue to access energy. However, governments could not mitigate the full costs of the crisis, with consumers bearing much of the burden in the form of significant bill increases.
The increases in wholesale energy costs and energy bills were part of a broader cost-of-living crisis. While this might be considered to have passed if it is measured by the rate of inflation, it has left an entrenched legacy of elevated household bills, which can have a disproportionate impact on low income households and consumers in vulnerable circumstances, and increased levels of consumer debt and arrears.[1]
Household energy bills are lower than they were during the peak of the cost-of-living crisis in 2022 and 2023. Nonetheless, typical energy bills remain substantially higher than pre-crisis.
Ofgem’s energy price cap – the maximum amount that energy suppliers can charge per unit of energy and standing charge for households on a standard variable tariff – implies that, for a household with typical energy use, the price cap of £1,849 per year for the current quarter (1 April to 30 June 2025) is 62% higher than the £1,138 between April and June in 2021 (Chart 1).
This upward shift in household energy bills during and in the immediate aftermath of the energy price crisis has had a number of implications for consumers.
· Households have reduced their use of energy, even as their spending on it, in real terms and as a share of total spending, has increased. Domestic energy consumption declined by 16% in 2022 and a further 6% in 2023; these declines are in excess of the long-term annual reductions in usage.[2] At the same time, household expenditure on electricity and gas as a share of total household spending increased by 70%, from 2.4% in 2021-2022 to 3.4% in 2022-2023, and has fallen to 3% in 2023-2024.[3]
- Increased expenditure on domestic energy has coincided with a substantial increase in energy debt and arrears. Debt and arrears in the GB energy market have reached £3.85bn in quarter 4 of 2024 (Chart 2).[4] “Bad Debt” (debt that cannot be recovered, because, for example, of a consumer’s financial difficulties) generally has to be socialised across all energy consumers, adding to all customers’ future bills.
- There has also been an increase in fuel poverty. A third (34%) of households in Scotland are estimated to be living in fuel poverty in 2023, up from 25% in the pre-crisis period (Chart 3).[5]
However, whilst the data described above provides some sense of the impact of energy bills on consumers, it doesn’t give the full picture of how households are managing their bills, particularly in the past 12 months or so, given lags in publication of some data sources.
At the same time as the shift in household energy bills, a number of important policy changes are either underway or are being consulted on which also have implications for bill affordability now, or in the near future.
These include changes in affordability policy – ranging from the shift from universality to means testing on the Winter Fuel Payments which affected pensioners in winter 2024-2025, and the broadening of eligibility criteria for the Warm Home Discount, to expand funding to better reach more working-age households on means-tested social security benefits – proposed for winter 2025-2026.
These changes to affordability policy and targeting have to be considered in the context of broader shifts in tariff and pricing policy that are anticipated to take place in coming years. These include a greater range of – and wider consumer interest in – various tariffs that offer price variation based on ‘time-of-use’, which can be particularly beneficial for households with access to renewable microgeneration technologies. In the longer term these might combine with various technologies which help consumers make smarter use of energy in the home. As well as this affordability tracker report, Consumer Scotland will shortly be publishing a report which examines opportunities and challenges for consumers arising from these changes to the future energy retail market.
In this context of a long-term shift in energy bills, ongoing changes to affordability policy, and broader changes to tariff structure, it is important to understand how consumers are managing their energy bills at the moment. In particular, it is essential to be able to understand how consumers perceive energy affordability, and where energy affordability challenges are most acute.
Chart 1: While the energy price cap is lower than its peak, it is substantially higher than pre-crisis
Ofgem’s energy price cap, Cornwall energy forecast, and typical price paid, January 2019 to September 2025
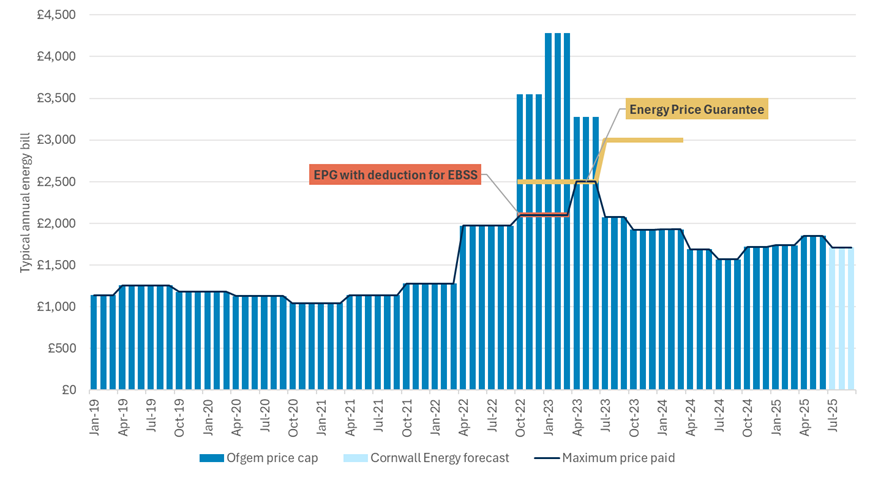
Source: The History of the Energy Price Cap | Electricity Prices and Cornwall energy forecast Predictions & Insights into the Default Tariff Cap (Price Cap)
Chart 2: Average energy arrears have risen substantially in the last few years
Average debt level where there is no arrangement to repay the debt (i.e. arrears) and average level of debt remaining where there is an arrangement to repay the debt (i.e. debt), Great Britain, 2012 to 2024
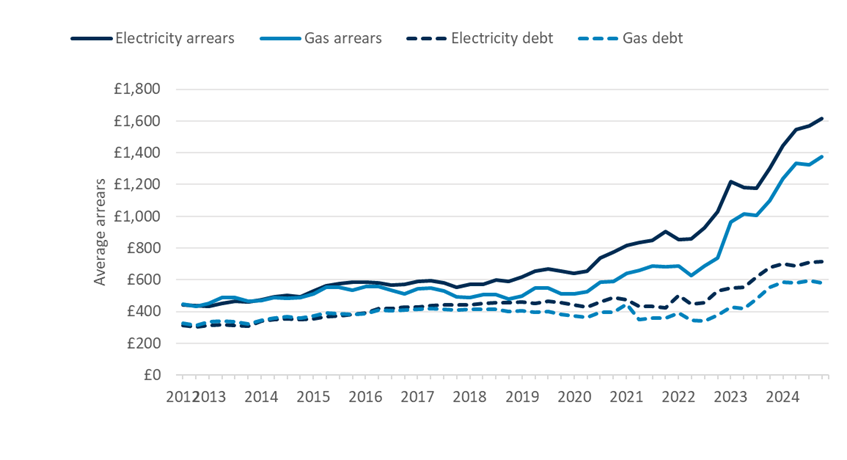
Source: Ofgem debt and arrears indicators. Information correct as of March 2025.
Chart 3: Fuel poverty rates have increased in the last few years
Fuel poverty (spending over 10% of income on fuel) and extreme fuel poverty (over 20%) in Scotland, 2012 to 2023
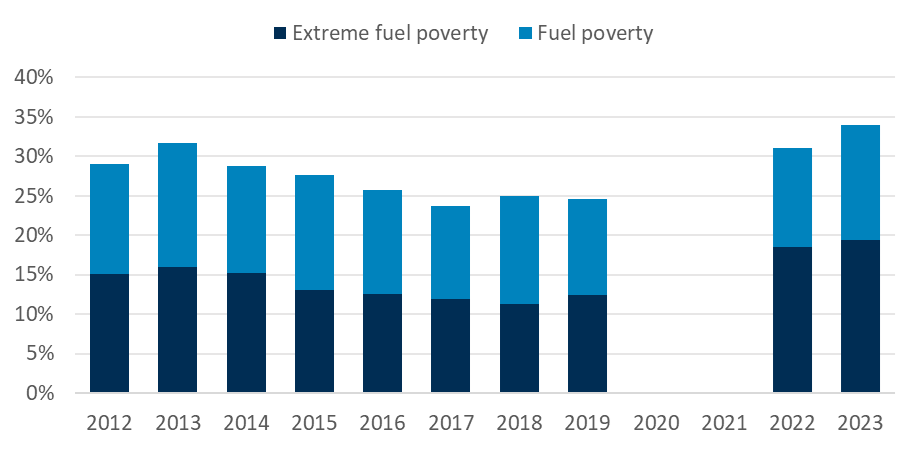
Source: Scottish House Condition Survey
The Energy Affordability Tracker
Consumer Scotland has been tracking people’s perception of the affordability of energy bills regularly since March 2022, when consumers faced rapidly increasing energy prices. The survey allows us to understand consumers in Scotland’s experiences of energy affordability and debt, and how they have changed over time. It is also able to provide insight into a broad range of consumer issues in the energy market. For example, our latest survey introduced new questions covering knowledge of energy performance certificates and low-carbon emitting technology. As of winter 2023-2024, the frequency of the survey has been reduced to annually, as energy prices have stabilised.
This report describes the findings from the winter 2024-2025 energy tracker survey, the fieldwork for which took place between 31 January and 14 February 2025. The report puts these findings in the context of the previous six waves of the survey (Table 1).
The Energy Affordability Tracker is administered as an online survey, and the most recent wave was delivered on our behalf by IFF Research. Adults aged 16 and over in Scotland are invited to participate in the survey until the survey quota and stratification target is reached. The responding sample is weighted to the profile of the sample definition to provide a representative reporting sample. Approximately 1,600 individuals have been interviewed at each wave.
Table 1: Dates and sample sizes of Consumer Scotland’s Energy Affordability Tracker
|
Wave |
Fieldwork date |
Sample size |
|---|---|---|
|
1. Spring 2022 |
23 to 31 March 2022 |
2,012 |
|
2. Autumn 2022[6] |
27 Sept to 10 Oct 2022 |
1,586 |
|
3. Winter 2022-2023[7] |
28 Nov to 13 Dec 2022 |
1,621 |
|
4. Spring 2023[8] |
2 to 20 March 2023 |
1,579 |
|
5. Autumn 2023[9] |
2 to 18 October 2023 |
1,589 |
|
6. Winter 2023-2024[10] |
25 Jan to 13 Feb 2024 |
1,609 |
|
7. Winter 2024-2025 |
31 Jan to 14 Feb 2025 |
1,656 |
3. Affordability of energy bills
Households’ financial circumstances are still recovering
The factors behind the rapid price increases during the cost-of-living crisis have largely abated, with inflation falling from its peak of 11.1% in October 2022 to 3.4% in the 12 months to March 2025.[11]
Consistent with this, our survey shows a continuing improvement in households’ perceptions of their financial circumstances. Three-quarters (76%) of households in our survey reported that they are managing well financially in January/February 2025, [12] an improvement on the 69% observed in our 2024 survey.[13] Households’ reported financial circumstances have improved consistently since the zenith of the cost-of-living crisis in 2022 (Chart 4).
Chart 4: Households’ perceptions of their financial circumstances have continued to improve
Percentage of households managing well financially, November/December 2022 to January/February 2025
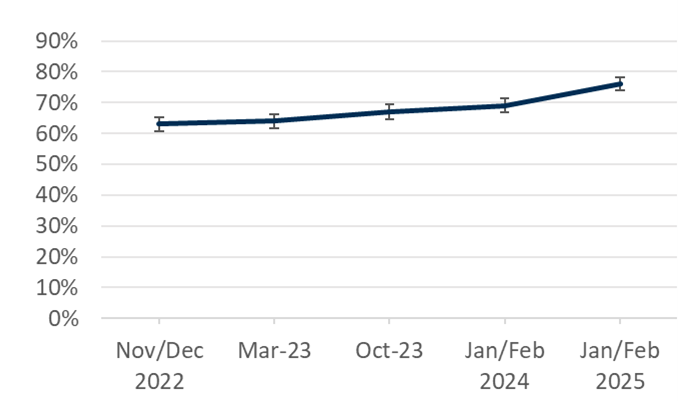
Source: Consumer Scotland Energy Tracker, HF1: Which of these phrases best describes how you and your household are managing financially these days?
However, whilst households’ financial circumstances are improving, the cost-of-living crisis continues to leave a legacy. The price of some essentials, including energy and food remains higher in real terms than pre-crisis. Essentials tend to form a larger proportion of the spending of low income households compared to higher income households, and have a particular impact on the financial circumstances of those households. [14] Additionally, there have been above inflationary bill increases in some other sectors. For example, council tax bills in Scotland increased by an average of 9.5%[15] in April 2025, whilst water charges increased by 9.9%.[16]
The ongoing fragility in households’ financial wellbeing can be seen in the Scottish Government’s quarterly Consumer Sentiment Indicator. This surveys households each quarter to understand whether they feel that their financial circumstances, their spending, and the economy generally, are improving or worsening. Chart 5 shows the evolution of the financial circumstances and household spending indicators. This reveals that, whilst households’ financial sentiment has improved since the nadir of the cost-of-living crisis, it remains lower than its long run average. Indeed, the spending indicator weakened at the end of 2024 and beginning of 2025 and is now lower than at any point in the last 12 years other than during the midst of the covid and cost-of-living crises.
Chart 5: Household financial circumstances have improved but remain weak
Household Finances and Household Spending Indices from the Scottish Government’s Consumer Sentiment Index, quarter 1 of 2014 to quarter 1 of 2025
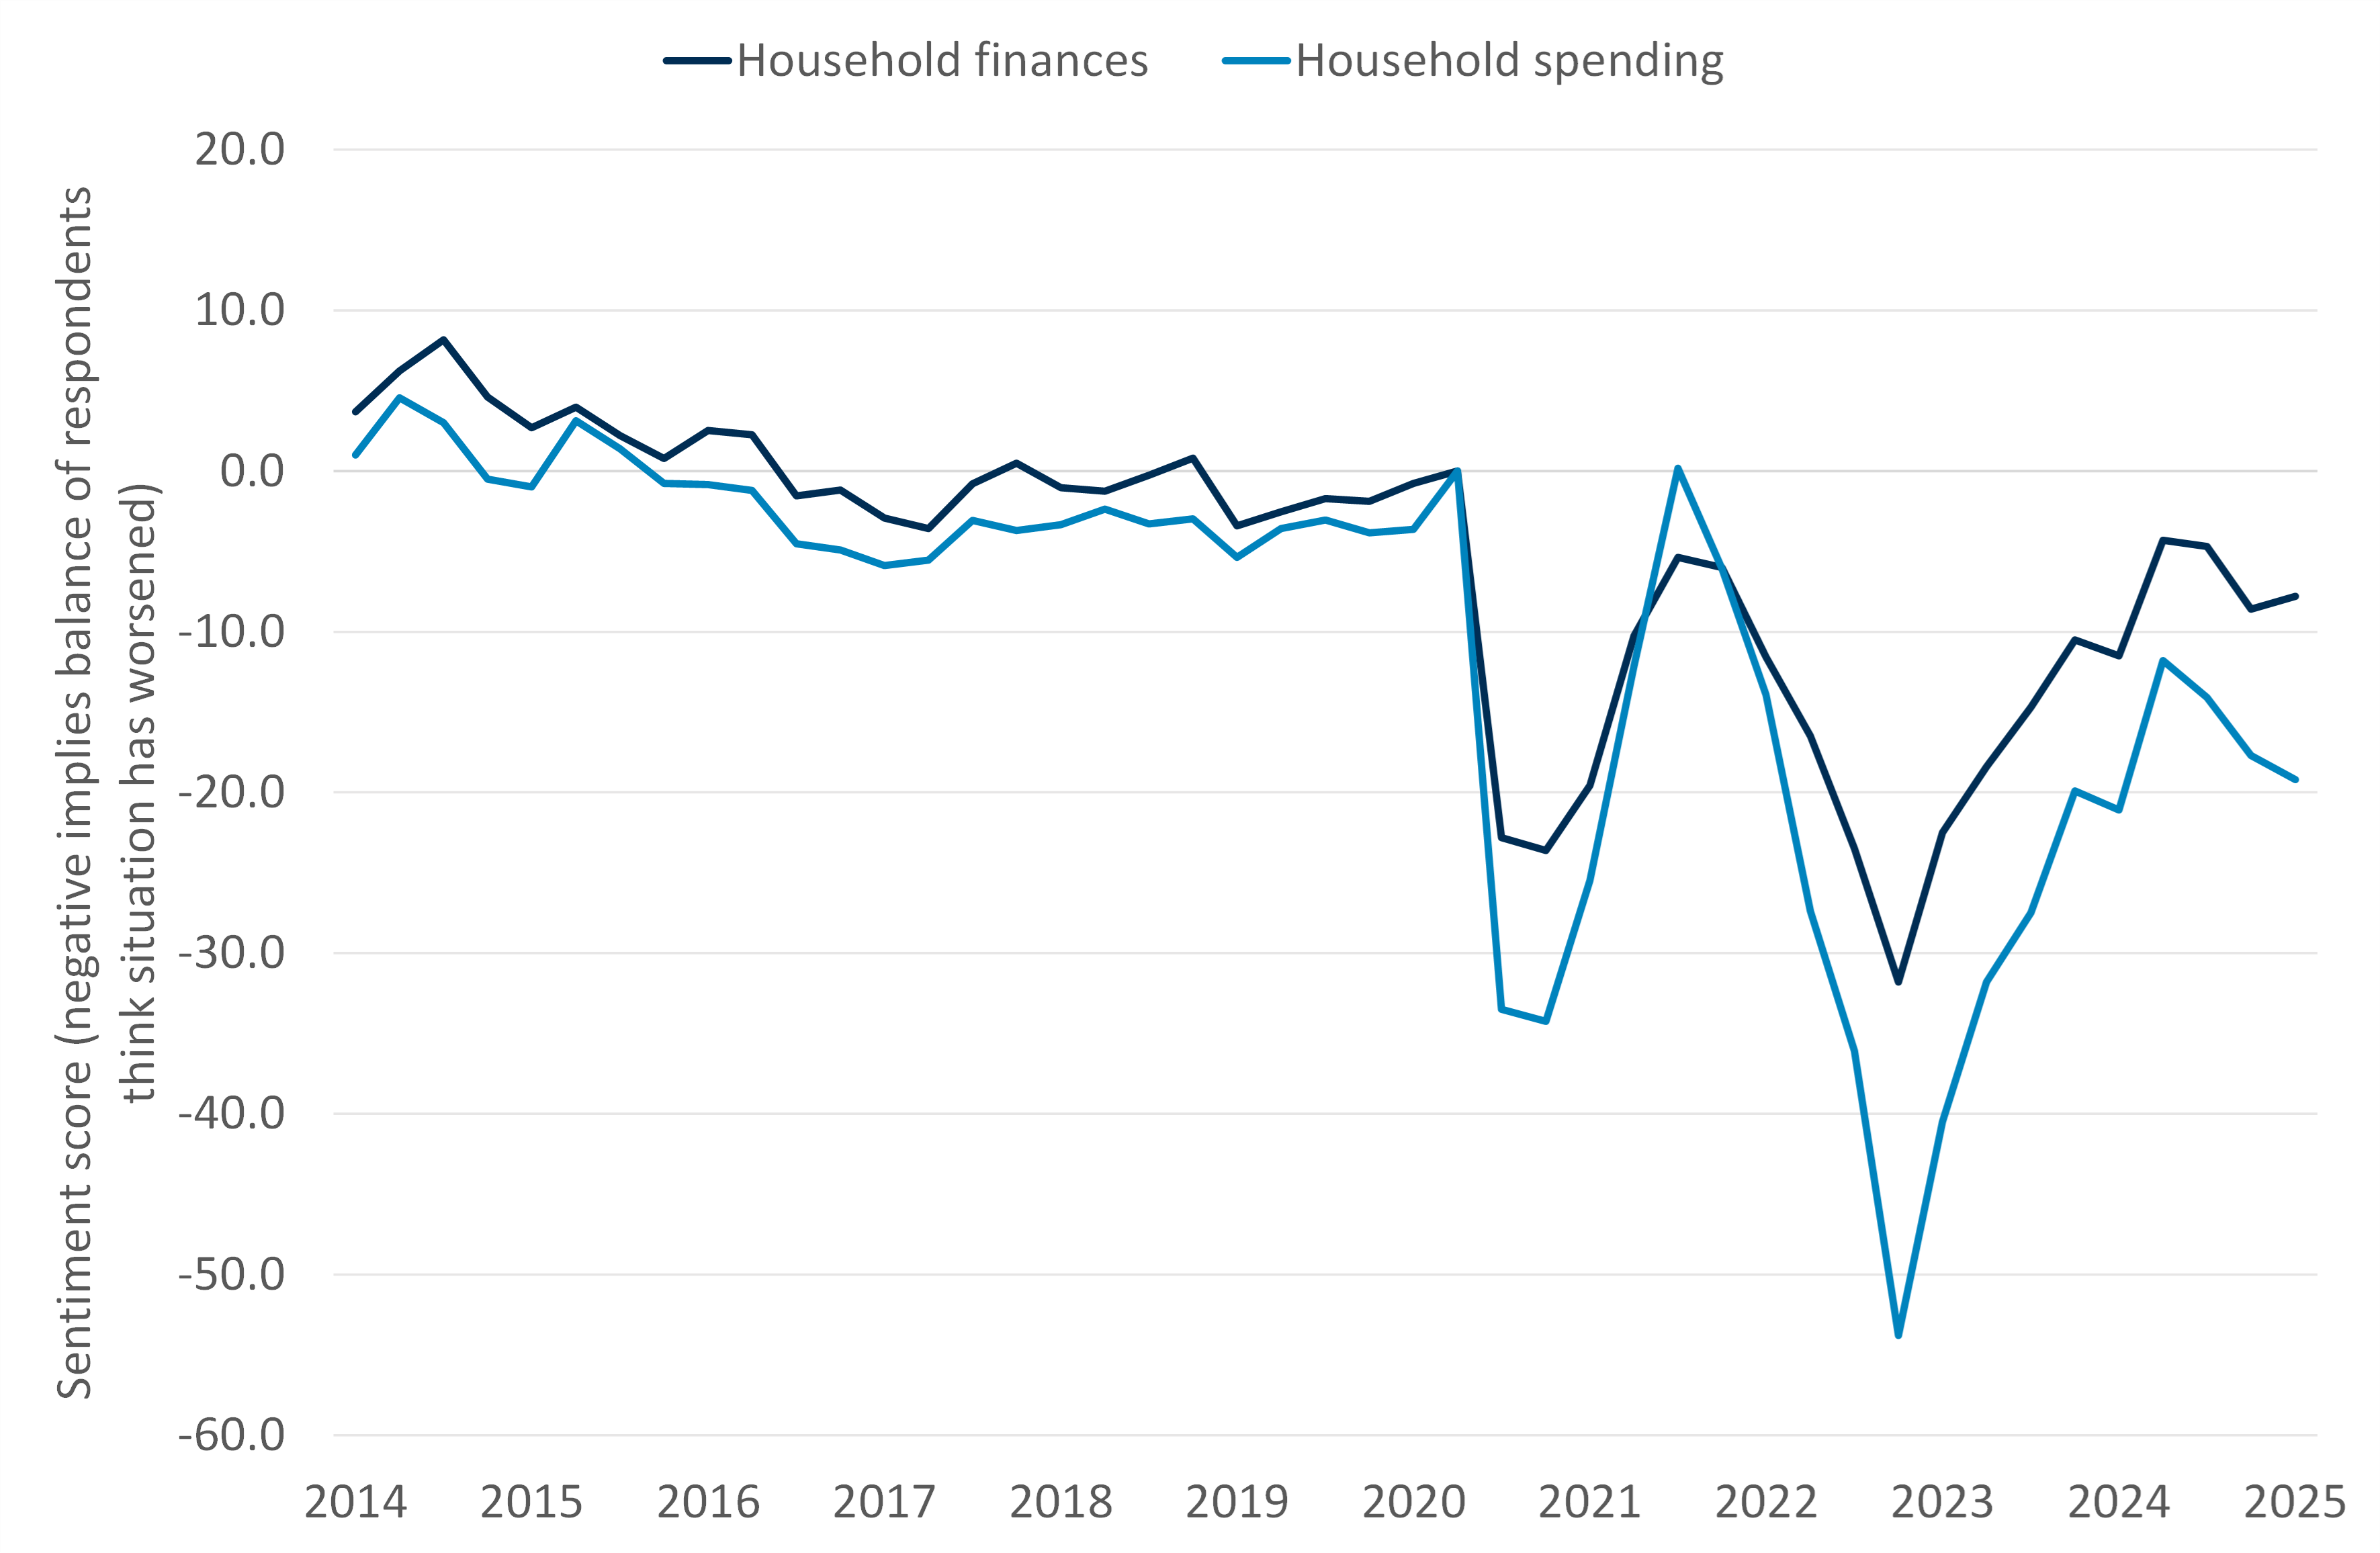
Source: Consumer Scotland analysis of Scottish Government’s Consumer Sentiment Index. Respondents are asked whether their circumstances have got better, worse, or remained the same. The index score is the difference between the percentage reporting ‘better’ and the percentage reporting ‘worse’; a negative score therefore indicates that more households think circumstances are worsening than those who believe they are improving
Energy affordability challenges have reduced but remain high
Our survey captures perceived energy affordability through several measures, summarised in Chart 6.
- Our headline measure is the proportion of respondents who report that it is difficult to keep up with their energy bills. This year, 16% of households reported finding it difficult to keep up with their energy bills, equivalent to 393,000 households in Scotland. This is a statistically significant decrease compared to last year, when a quarter (26%) of respondents reported that it was difficult to keep up with their energy bills. The proportion of respondents who say they find it difficult to keep up with their energy bills is now lower than at any point since we commenced our tracker survey (Chart 6).
- Our second measure is the proportion of respondents who say they can’t afford to heat their home to a comfortable level. This measure has remained largely unchanged in January/February 2025 compared to the previous survey wave. But it is significantly lower (at 33%) than during the peak of the energy price crisis in winter 2022-2023 (when it was 42%).
- Our third measure is the proportion of respondents who say they have to cut back spending on other things to afford energy bills. Similarly to our second indicator, this has not seen significant change in the past 12 months (64% for both periods), but is significantly lower than in late 2022.
Overall then, the message is that energy bills are perceived as being more affordable now than they were in late 2022 and early 2023, which is consistent with the real terms decline in bills since then.
It is notable that our headline measure – the difficulty in keeping up with bills – has improved more than the other two measures (unable to heat home to comfortable level, and cutting back on spending elsewhere). This difference is consistent with households managing the affordability of their energy bills by adapting their wider behaviours. In other words, it is consistent with the idea that households have sought to manage the affordability of their energy bills by continuing to limit their energy use and what they spend on non-energy goods and services. Future research, based on comprehensive household spending data, could test this hypothesis more explicitly.
Chart 6: The proportion of households finding it difficult to keep up with their energy bills has decreased since last year
Percentage of households finding it difficult to keep up with their energy bills, cutting back on spending to afford energy bills, and unable to heat their home to a comfortable level because of financial concerns, March 2022 to January/February 2025
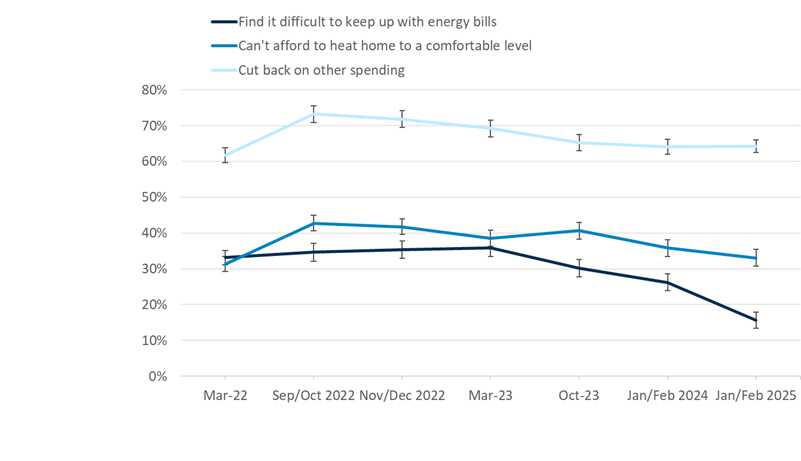
Source: Consumer Scotland Energy Tracker, AFF3: How easy or difficult is it for your household to keep up with your energy bills nowadays? AFF9: To what extent do you agree or disagree with these statements... _1 I/we can’t afford to heat my/our home to a comfortable level because of financial concerns, AFF5: Are you having to cut back your spending on any of these things in order to afford to pay your energy bills nowadays?
The analysis above has considered the different energy affordability measures in isolation. It is also useful to consider the measures in combination. Strikingly, the majority (68%) of respondents reported at least one of these three affordability challenges (equivalent to 1.7 million households in Scotland) in our latest survey.
Bills have become more affordable for all consumer groups
The reduction in the proportion of households finding it difficult to keep up with their energy bills has been quite pronounced. An important question is whether this improvement has been seen for some groups more than others. In particular, one might hypothesise differences in the change in affordability over time for:
- Different demographic groups – the removal of universality in favour of means testing of the Winter Fuel Payment (payments of approximately £150 per person to those aged over 65) might reduce the extent to which bill affordability was perceived to have improved for pension aged consumers relative to working age consumers.
- Different groups by household income – since energy bills account for a larger percentage of the spending of low income households than higher income households.
We therefore explored whether the improvement in energy bill affordability is more pronounced in particular groups, or is observed across all consumers.
Our conclusion from this analysis is that the recent improvement in energy bill affordability has been observed fairly ubiquitously across all consumer groups.
For example, Chart 7 shows that the improvement in energy bill affordability has been observed both for households with members above 65 and for those of working age (with the older group generally reporting less difficulty in affording bills than the working age group).
Chart 8 shows that, as would be expected, low income households are more likely to find it difficult to keep up with bills than higher income households. But it also shows that the improvement in bill affordability has been at least as significant – and perhaps more pronounced – for low income households compared to higher income households.
This strong improvement in affordability for low income households is consistent with the observation that energy bills account for a greater share of their total spending. When energy bills rise, this puts a relatively greater burden on these households, but this affordability burden should also therefore unwind more quickly as bills begin to decline. However, it is also consistent with the hypothesis that low income households might have adapted to high bills by reducing their energy consumption to a greater extent than higher income households.
Our analysis also revealed that the improvement in perceived affordability since last year was seen across other respondent characteristics including gender, ethnicity, disability, and children under 5. This improvement across groups may reflect a genuine improvement in incomes relative to bills, but may also reflect changing consumer perceptions around general energy costliness or accepting of these prices as a ‘new normal.’
Chart 7: The proportion of households finding it difficult to keep up with their energy bills has decreased since last year, regardless of whether a member of the household is aged over 65
Proportion of respondents finding it difficult to keep up with their energy bills, by whether a member of the household is aged over 65, March 2022 to January/February 2025
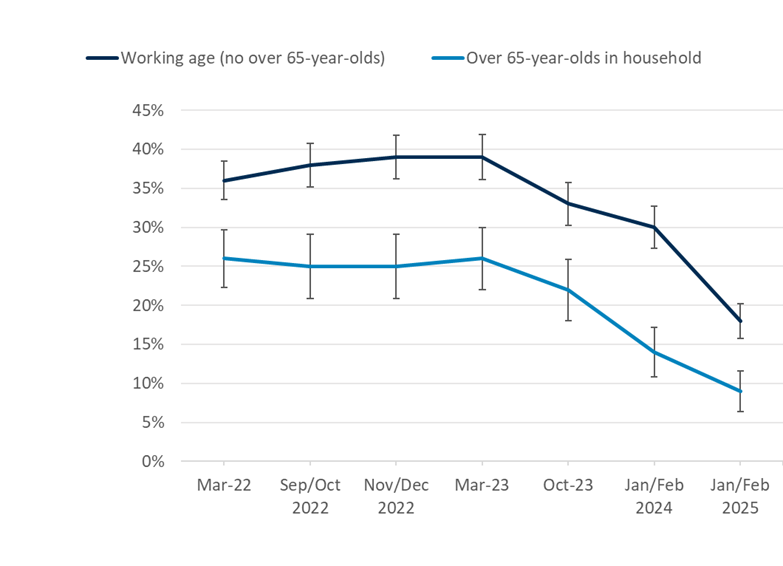
Source: Consumer Scotland Energy Tracker, AFF3: How easy or difficult is it for your household to keep up with your energy bills nowadays? PSR2: Do any of the following apply to you or another person your household? You or another member of your household is over the age of 65
Chart 8: The improvement in perceived affordability of bills has been observed across all income groups
Proportion of respondents finding it difficult to keep up with their energy bills, by household income, March 2022 to January/February 2025
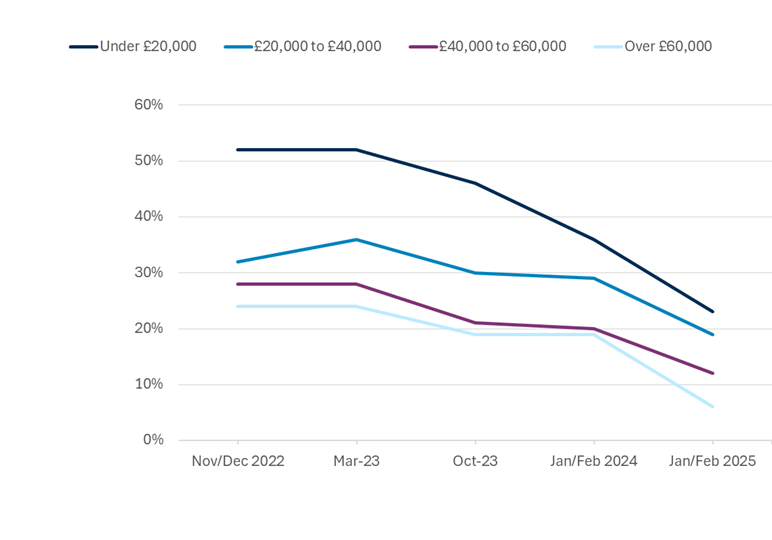
Source: Consumer Scotland Energy Tracker, AFF3: How easy or difficult is it for your household to keep up with your energy bills nowadays? F7: How much is your household’s income before tax? Please include the income of all adults living in your household, including income from any employment or self-employment, income from benefits and pensions and income from other sources such as interest from savings.
Low income households, those receiving means-tested benefits, and those with a long-term disability or health condition are most likely to report energy affordability challenges
As well as understanding which groups are more or less likely to have reported a change in affordability over time, it is also important to know which groups are most likely to face affordability challenges at the current time, as this helps to determine the targeting of affordability support.
The groups more likely to find it difficult to keep up with energy bills in January/February 2025 are:
- Lower earners (under £20,000, 23%) compared to higher earners (over £60,000, 6%)
- Females (19%) compared to males (12%)
- Households where a member has a disability or health condition (26%) compared to those that do not (13%)
- Households with no over 65-year-olds (18%), compared to those with over 65-year-olds (9%)
- Single households (20%) compared to households of 2-4 people (14%)
- Those who receive means-tested benefits (26%) compared to those who receive non-means-tested benefits (13%) or no benefits (12%)
Chart 9: Households reporting low income, a disability or health condition, or receiving means-tested benefits are most likely to find it difficult to keep up with energy bills
Percentage of respondents finding it difficult to keep up with energy bills, by demographic characteristics, January/February 2025
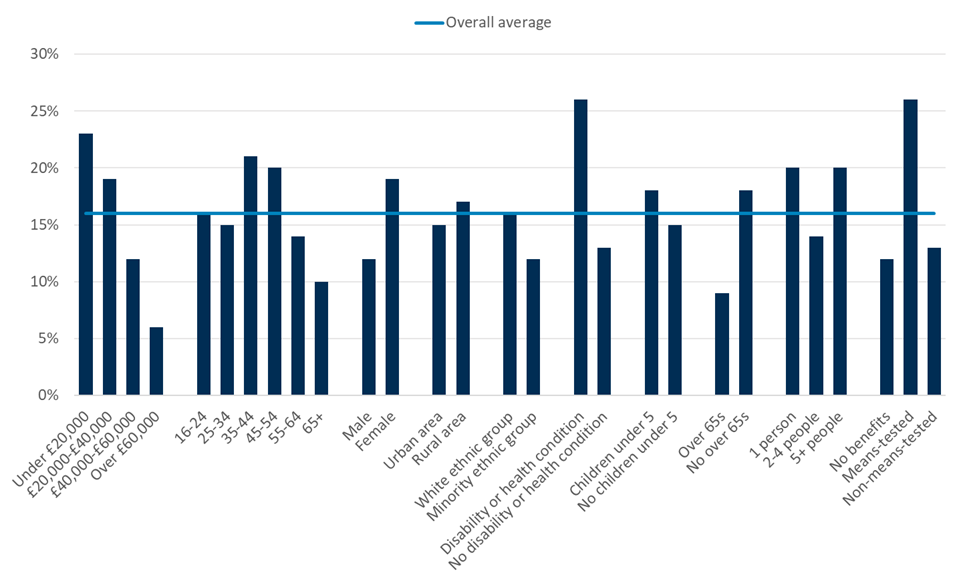
Source: Consumer Scotland analysis of our Energy Tracker, AFF3: How easy or difficult is it for your household to keep up with your energy bills nowadays?
We also examined the characteristics of the consumers who are most likely to report affordability challenges on our other two measures – whether they have cut back on at least one spending behaviour to pay for energy bills and those who cannot afford to heat their home to a comfortable level because of financial concerns.
In broad terms, the characteristics of respondents reporting affordability challenges are similar across all three affordability measures. Low income households, those with a long-term health or disability, and those receiving means-tested benefits are most likely to face affordability challenges; whilst working age households are more likely than state pension age households to experience affordability challenges.
The above analysis has only considered individual characteristics in isolation. However, many of these characteristics are related, so it is difficult to say from the initial analysis which are most relevant to any differences in affordability. To explore this further, we performed a logistic regression to model the probability of a household finding it difficult to keep up with their energy bills in January to February 2025, as a function of various explanatory variables. This works by taking these individual characteristics together, and estimating how they each predict the probability of respondents finding it difficult to keep up with their energy bills.
The results of the regression analysis are summarised in Chart 10. They indicate that:
- Households in lower income bands (under £20,000, £20,000 to £40,000 and £40,000 to £60,000) are more likely find it difficult to keep up with energy bills, compared to those with an income of over £60,000
- Female respondents are more likely find it difficult to keep up with energy bills, compared to males
- Households where a member has a disability or health condition are more likely to find it difficult to keep up with energy bills, compared to those that do not
- Households with no members aged 65-years-old or over are more likely to find it difficult to keep up with energy bills, compared to those with over 65-year-olds
- Those who receive means-tested benefits are more likely to find it difficult to keep up with energy bills, compared to those who receive no benefits
- The association between household size and the probability of finding it difficult to keep up with energy bills is no longer statistically significant when controlling for other factors
Chart 10: Households with low income, a disability or health condition, no over 65-year-olds, receiving means-tested benefits, and female respondents are associated with higher risks of energy affordability challenges
Logistic regression results on the probability of finding it difficult to keep up with energy bills, January/February 2025
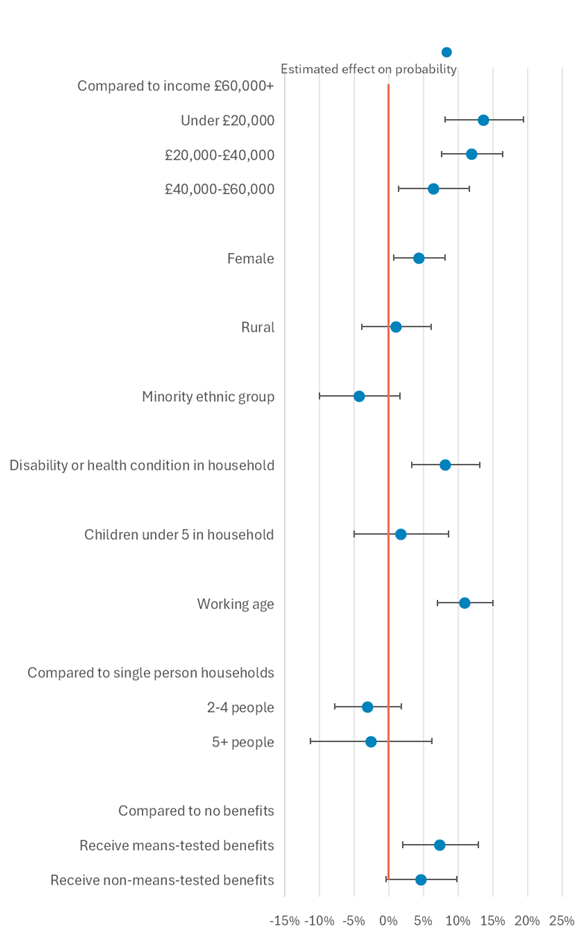
Source: Consumer Scotland analysis of our Energy Tracker, AFF3: How easy or difficult is it for your household to keep up with your energy bills nowadays?
A significant minority of consumers have borrowed money or sold items to pay for their energy bills
What impact have energy bills had on consumers? Around two in five (39%) respondents reported at least one impact that the cost of energy has had on their household this winter. This includes things like having to borrow money, selling items, seeking financial assistance, reducing the amount usually put on the prepayment meter, and missing rent or mortgage payments.
The most commonly reported impacts were: having to borrow money from friends or family (14% of all respondents); selling items in order to raise money to pay energy bills (11%); and having to borrow money from a bank, payday lender or other financial provider (8%).
A significant number of consumers have sought advice about their energy bills
A third (32%) of households reported that they had sought advice in the last 3 months about paying their energy bills. This has doubled since last year (18%). Advice Direct Scotland has also reported a 20% increase in consumers seeking advice on either billing or repayment in quarter 4 of 2024-2025 compared to the same quarter in 2023-2024.
Of those who had sought advice, the most reported source of advice was their friends or family (48%), followed by energy company (39%) and local council (21%). Ofgem’s current proposals for a debt relief scheme requires consumers to be in contact or to get in touch with their energy suppliers to access the scheme. Our research would suggest that this would be challenging in practice for many consumers in debt and arrears, as most are not currently going to their energy company for advice.
While most (70%) households are aware of at least one form of financial support that could help with the cost of energy, only a small proportion (24%) reported receiving at least one of these, compared with last year (34%). This decrease is expected, as it may reflect the restriction in the availability of Winter Fuel Payment in winter 2024-2025.
Chart 11: Friends or family are the most reported source of advice about paying energy bills
Of those who sought advice about paying energy bills, the proportion who sought advice from each source, January/February 2025
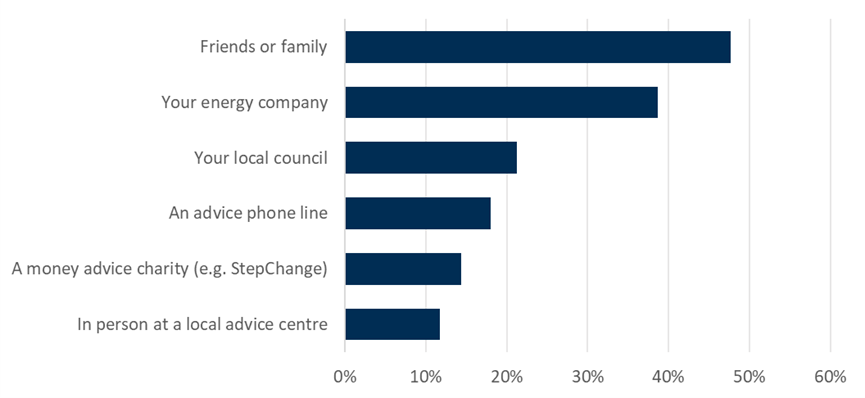
Source: Consumer Scotland Energy Tracker, AFF18: In the last 3 months, which, if any, of the following have you sought advice from about paying your energy bills, this could be online, over the phone, or in person (unless stated otherwise in the options below)?
The pressure of affording energy bills affects health
Overall, 29% of households reported that their mental health is negatively impacted ‘a lot’ or ‘a fair amount’ by keeping up with energy bills, and 22% said their physical health is negatively impacted.
The mental health impact of keeping up with energy bills has declined since winter 2022, which is consistent with the real term fall in energy bills over that period.
Households who find it difficult to keep up with their energy bills were significantly more likely to report that their mental and physical health is being negatively impacted compared to those who find it easy – over three times more likely for mental health, and around 2 and a half times more likely for physical health.
Chart 12: The health impact of affording energy bills has declined but remains high
The proportion of respondents who agreed that their health is being negatively impacted ‘a lot’ or ‘a fair amount’ by keeping up with their energy bills, November/December 2022 to January/February 2025
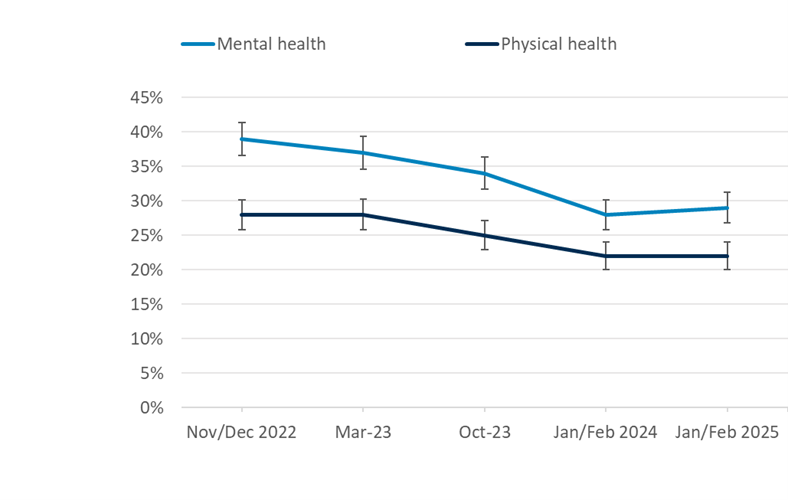
Source: Consumer Scotland Energy Tracker, AFF17a: To what extent, if at all, is your health being negatively impacted by keeping up with your energy bills? _1 Your mental health, _2 Your physical health
We explored the extent to which energy debt was associated with negative mental health outcomes. Our analysis (details of which are not included here but can be shared on request) found that being in energy debt was associated with a significantly greater probability of negative mental health impacts, even after controlling for affordability challenges and demographic characteristics such as income. This indicates that being in energy debt places a significant mental health burden on consumers, over and above the burden associated with having low income or struggling to keep up with energy bills more generally.
Low energy efficiency is associated with more difficulty in affording energy bills
The energy efficiency of a household underpins its overall energy needs. Improvements in energy efficiency can help reduce how much energy the household consumes and therefore lower energy bills.
Households who find it difficult to keep up with their energy bills were more likely to be unable to heat their home to a comfortable level because of poor insulation or energy inefficiency (46%) compared to those who find it easy (22%). They were also more likely to agree that they can’t afford to make energy efficiency improvements to their home (70%), compared to those who find it easy (29%) – Chart 13.
Our research found that households who find it easy to keep up with energy bills were more likely to agree that they know where to get information about how to improve the energy efficiency of their home (66%) compared to those who find it difficult (54%). They were also more likely to say they do not want to improve their home’s energy efficiency because they are happy with its current level (35%) compared to those who find it difficult (13%).
Interventions in the market could be made to support those households struggling financially to improve their energy performance certificate rating, such as through insulation or low carbon technologies, which would reduce their overall energy needs both now and in future. Our report on how consumers are accessing the low-carbon technology market sets out a number of recommendations for how this could be achieved.[17]
hart 13: Households who find it difficult to keep up with their energy bills are more likely to be unable to afford energy efficiency improvements, and can’t heat their home to a comfortable level because of energy inefficiency
Proportion of respondents who agreed they are unable to heat their home to comfortable level because of poor insultation or energy inefficiency, and can’t afford to make energy improvements to home, by ease of keeping up with energy bills, January/February 2025
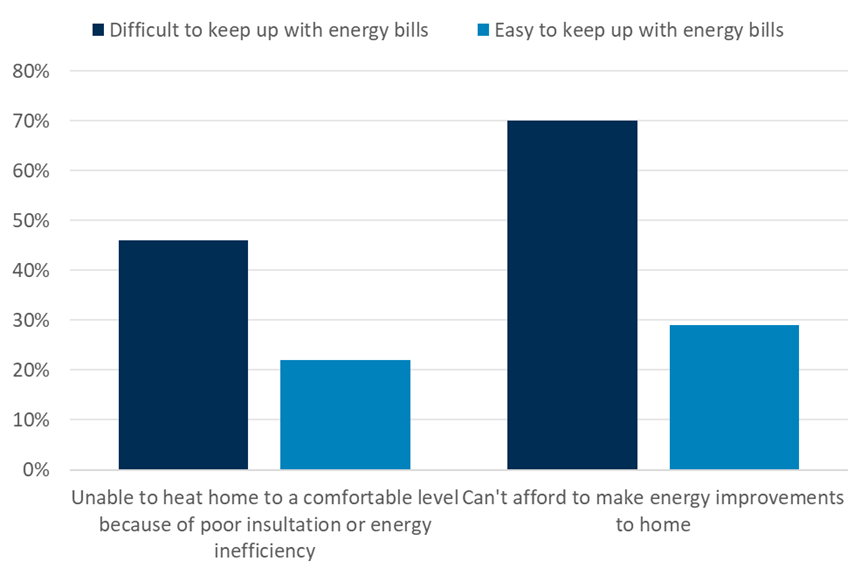
Source: Consumer Scotland Energy Tracker, AFF9: To what extent do you agree or disagree with these statements... I/we can’t heat my/our home to a comfortable level because of poor insulation/energy inefficiency. EPC2: To what extent do you agree with the following statements about your home’s energy efficiency? _4 I cannot afford to make energy efficiency improvements to my home.
4. Energy debt
The proportion of households in energy debt has increased
In the three most recent waves of our survey (October 2023, January/February 2024 and January/February 2025) we have asked participants if they were in energy debt or arrears. The definition of energy debt we used was deliberately broad to include cases where a consumer owes money to someone other than their energy supplier as a result of borrowing money to pay energy costs.
As such our survey can capture wider issues around energy debt that may be masked by the narrower definition used by Ofgem in the energy debt figures they publish, where “energy debt” means money owed to an energy company by a customer. In addition, we also asked about the nature of their debt, how long it had been in place, and about their experience of and response to being in debt.
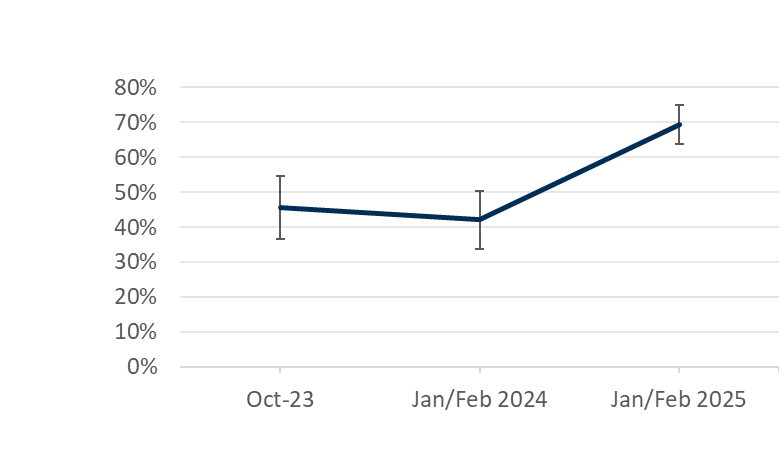
The scale of energy debt and arrears is currently a significant issue for some consumers in Scotland. While most (79%) households reported that they are not in energy debt or arrears, the proportion who reported that they are is 15% (equivalent to 383,000 households in Scotland).
Significantly, the proportion of consumers in energy debt has increased compared to last year when it was 9%. Citizens Advice Scotland estimate the average energy debt consumers are bringing to their local Citizens Advice Bureau in Scotland was £2,500, reaching £3,130 on average for rural consumers.[18]
Ofgem is finalising the design of a debt-relief scheme that will reduce some of the energy debt that households accumulated during the core part of the cost-of-living crisis.[19] Discussions are ongoing on the design and delivery of the proposed scheme, to which Consumer Scotland has been contributing.[20]
Chart 14: More households are now in energy debt or arrears
Proportion of respondents reporting being in energy debt or arrears, October 2023 to January/February 2025
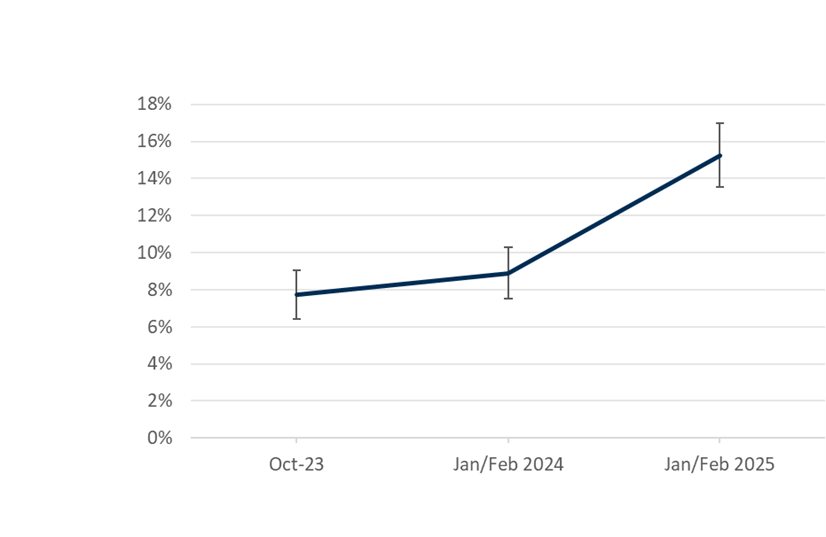
Source: Consumer Scotland Energy Tracker, AFF20: Are you in energy debt or arrears? By this we mean behind on energy bill payments, repaying debt to your energy supplier, paying debt recovery through a prepayment meter, or owing money to someone else as result of borrowing money to pay for energy costs.
Income, means-tested benefits, disability, age, and ethnicity are among the characteristics that determine the risks of energy indebtedness
Our survey revealed that some groups are more likely to be in energy debt than others. The groups more likely to be in energy debt or arrears are:
- Lower household incomes (under £20,000, 22%) compared to higher household incomes (between £40,000 to £59,999, 10%)
- Younger age groups (25-34, 25%) compared to older age groups (65+, 3%)
- Minority ethnic groups (26%) compared to white ethnic groups (14%)
- Households where a member has a disability or health condition (24%) compared to those that do not (13%)
- Households with children under 5 (26%) compared to those without children under 5 in the household (14%)
- Households with no over 65-year-olds (18%), compared to those with over 65-year-olds (10%)
- Those who receive means-tested benefits (32%) compared to those who receive non-means-tested benefits (12%) or no benefits (10%)
- Households with three or more (52%) or two generations (23%) of the same family living together compared to non-multigenerational households (10%)
- Those who pay their energy bill when it arrives (20%) or have a prepayment meter (20%) compared to those who pay by direct debit or standing order (14%)
Fewer than half of customers in energy debt have a repayment plan in place with their energy company
Our research found that half (49%) of households in Scotland in energy debt reported that they are behind on bills but do not have a formal debt repayment plan in place, equivalent to 188,000 households. Ofgem estimates the average debt level where there is no arrangement to repay the debt (arrears) was £1,617 for electricity accounts and £1,376 for gas accounts.[21] Debt is particularly burdensome for these customers.
Our research found that over a third (36%) of households in energy debt do have a repayment plan in place with their energy company. For those with a repayment plan, Ofgem estimates that the average debt remaining was £715 for electricity consumers and £581 for gas consumers.[22]
Chart 15: Half of households that are in energy debt are behind on bills but do not have a formal debt repayment plan in place
Of respondents in energy debt or arrears, the proportion of respondents reporting different types of debt, January/February 2025
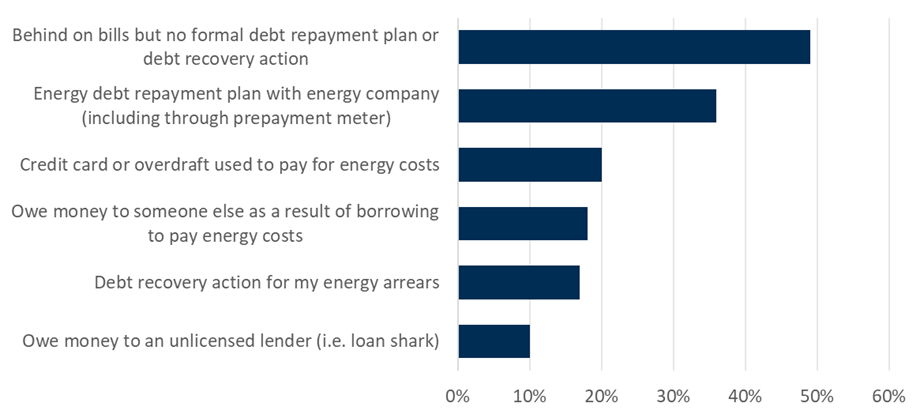
Source: Consumer Scotland Energy Tracker, AFF21: What is the nature of your energy debt or arrears?
A significant number of consumers have been moved on to prepayment meters as a result of their energy debt
Of those in energy debt or arrears, 34% reported being in debt for less than 4 months, 18% for 4 to 6 months, 8% for 7 to 9 months, 10% for 10 to 12 months, and 16% for over 12 months.
This year, 34% of respondents in energy debt or arrears reported that they have been put on a prepayment meter due to their debt, an increase from last year (16%). One factor which might contribute to this rise is that, starting in January 2024, Ofgem started to allow suppliers to re-engage in the practice of putting indebted consumers onto prepayment meters without permission, under tightly regulated circumstances.[23] [24] One of the reasons this increase is of potential concern is that bills for prepayment meter customers are more variable throughout the year, which can exacerbate affordability issues. For example, analysis by the Resolution Foundation found that consumers on prepayment meters needed to spend 30% of their income on energy costs during the winter months.[25]
Chart 16: The proportion of people who have been put on a prepayment meter due to their energy debt has increased
Proportion of respondents in energy debt or arrears who have been put on a prepayment meter due to their energy debt, October 2023 to January/February 2025
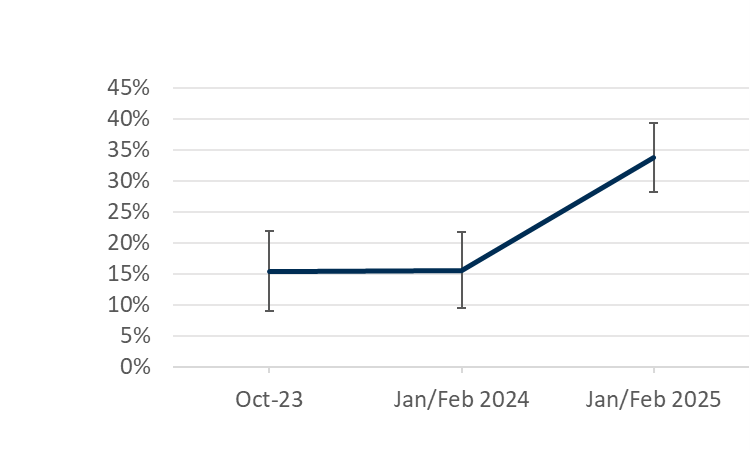
Source: Consumer Scotland Energy Tracker, AFF23: For each of the following statements, please indicate whether or not they apply to you/ your household… _6 I have been put on a prepayment meter due to my energy debt
Ofgem data shows that the average length of debt repayment plans agreed for Gas and Electricity prepayment consumers can range from 63 to 575 weeks and 113 to 2237 weeks respectively – which shows how long the burden of debt can impact the affected households.[26]
Being in energy debt can have pernicious impacts on wellbeing. Citizens Advice provided Consumer Scotland with analysis of Scottish consumers’ experiences. They found that, for those who are in energy debt, two thirds (63%) of people said that they had had to ration their energy, including switching off or turning down their heating or water in the past year as a result of their debt – potentially impacting their health and wellbeing.
Of those in energy debt or arrears, our survey found that 46% have sought debt advice and 30% have experienced legal action or debt recovery action. Ofgem research found that 29% of consumers who fell behind on their energy bills had no contact from their supplier about it, only 14% were contacted proactively by their supplier and 55% of consumers contacted their supplier.[27]
Confidence in clearing energy debt has increased
Although there has been an increase in the proportion of respondents reporting being in energy debt or arrears, for the first time since the survey began, most (69%) households in energy debt or arrears are confident they will be able to clear their debt. A quarter (26%) are not confident they will be able to clear the debt (called ‘bad debt’), equivalent to 101,000 households.
Chart 17: Most households in energy debt are confident they can clear their debt
Proportion of respondents reporting whether they feel confident they can clear their energy debt or arrears, October 2023 to January/February 2025
Source: Consumer Scotland Energy Tracker, AFF23: For each of the following statements, please indicate whether or not they apply to you/ your household… _1 I am confident I will be able to clear my energy debt or arrears
5. Conclusion
The seventh wave of our energy affordability survey, conducted in January and February 2025, shows that people’s perceptions of the affordability of their energy bills has continued to improve during the past 12 months. On our headline measure of affordability, affordability has improved significantly since last year; on other measures, affordability has improved less markedly in the last 12 months specifically, but is nonetheless an improvement since 2022.
Improvements in affordability since the peak of the cost-of-living crisis in 2022 and 2023 are to be expected given the reduction in bills since then. However, a large proportion of consumers in Scotland continue to face affordability challenges. These affordability challenges remain particularly acute for some groups, particularly those on lower incomes and those with long-term health problems or disability.
Energy bills remain higher in real terms than before the cost-of-living crisis. The impacts of this are seen in relatively high proportions of respondents reporting that they cannot heat their home to comfortable levels, and in adverse health impacts associated with keeping up with energy bills.
A mounting legacy of the rise in energy bills is the increase in households’ energy debt. Our survey reveals a significant increase in the proportion of customers in energy debt, up from 9% last winter to 15% in January/February 2025.
There are several implications of all this.
In the short-term, ongoing affordability challenges point to the need for targeted bill support for those most likely to need it. We welcome the UK Government’s plan to broaden the eligibility criteria for Warm Homes Discount in winter 2025-2026 to include all households in receipt of means-tested benefits. However, there is a need to identify opportunities to provide more comprehensive support, targeted at those in most need.[28] Delivering such support is likely to require more innovative use of a range of data sources, and we welcome the UK government’s commitments to improve the way that administrative data is used to target support.
It is also critical that proposed reforms to the Warm Home Discount, which apply directly to England and Wales, are matched by commensurate improvements to scheme operation in Scotland,[29] and avoid the outcome that the policy works less effectively for consumers in Scotland.
As well as improving the affordability of bills, the rise in household indebtedness must be addressed. Ofgem’s proposed Debt Relief Scheme will be a critical intervention to support those consumers, and the design of that intervention must be fair, appropriate and meets the needs of consumers in Scotland. The delivery of this scheme provides another opportunity to explore innovative ways of using a variety of data sources to ensure that debt relief is targeted where that will have the strongest impact on consumer wellbeing.
The doubling of consumers in debt on prepayment meters is troubling and warrants further research. While consumers can consent to the installation of a prepayment meter, or can be forced to have one installed in tightly regulated circumstances,[30] they may not be the best solution for supporting a consumer in debt. We would welcome more discussion on how consumers in debt and arrears are currently repaying their energy debts and how this will factor into Ofgem’s proposed Debt Relief Scheme.
There is also a need for greater support to encourage consumers to seek debt advice and engage with their suppliers. The current levels of debt and arrears highlight the critical importance of suppliers treating their customers with fairness and compassion in their debt management practices.
As well as reforms to affordability support and debt relief schemes, a number of broader changes are underway in the energy retail market. These include a growing number of time-of-use tariffs that provide opportunities for consumers to reduce bills by varying when or how they use energy. These impacts could be enhanced through the wider adoption of smart meters and smart appliances that allow consumers to better control their energy use. However, whilst these innovations provide opportunities to consumers, they also pose risks. Consumer Scotland will shortly publish work setting out the opportunities and risks for consumers arising from the developments.
In the slightly longer term, debates are underway about more fundamental reforms to the structure of energy wholesale markets. These reforms could have significant impacts on customer bills. Consumer Scotland will soon be publishing analysis of the Review of Electricity Market Arrangements (REMA), and the opportunities and risks this poses consumers in Scotland.
Consumer Scotland’s energy affordability tracker provides a snapshot of affordability issues facing Scottish consumers. Over time, it provides a rich picture on the evolution of affordability issues. The insights from the tracker will continue to provide useful analysis to inform wider debates on affordability policy, debt relief, tariff structure and wider market reform.
6. Endnotes
[1] 3. The differential effects of the cost of living crisis on households - Understanding the Cost of Living Crisis in Scotland - gov.scot
[2] Energy Consumption in the UK 2024 (DESNZ)
[3] Consumer Scotland analysis of ONS Consumer Trends: Consumer trends, UK - Office for National Statistics
[5] Overview - Scenario modelling 2023 fuel poverty levels under 2019 fuel prices - gov.scot; Home - Fuel Poverty Scotland
[10] Insights from latest Energy Affordability Tracker: Causes and impact of energy debt | Consumer Scotland
[11] 2. The cost of living crisis in Scotland - Understanding the Cost of Living Crisis in Scotland - gov.scot
[12] The findings from Consumer Scotland’s survey are consistent with the Financial Conduct Authority’s findings that 77% of consumers were managing well financially in Scotland in early 2024 financial-lives-cost-of-living-jan-2024-recontact-survey-findings.pdf
[13] Unless otherwise stated, differences (over time or between groups) mentioned throughout this report are statistically significant at 95% confidence levels. Error bars in charts are based on these 95% confidence intervals.
[14] According to analysis by Citizens Advice, the lowest earners spend around 41% of their earnings (after housing) on essential bills, compared to 11% of middle earners, and 5% for the highest earners Essential bills “eating away” at incomes of lowest earners - Citizens Advice
[17] Heat in Buildings - supporting the rollout of heat pumps and solar PV in Scotland | Consumer Scotland
[20] Ofgem consultation on Resetting the Energy Debt Landscape: The Case for a Debt Relief Scheme | Consumer Scotland