We are now nearly two years into the cost of living crisis, and indications are that it will remain a problem for some time to come. The time feels right to take stock of what has happened so far, consider who is being affected, and how. Recently, Consumer Scotland has been looking at how Scottish consumers have experienced the cost of living crisis and what has been striking are the differences as opposed to the similarities. Different markets and different consumers have been impacted differently, and responded differently.
An evolving crisis that is not yet over
The first difference is that individual markets have been affected at different times and in different ways, and though inflation is now coming down, the crisis is still far from over.
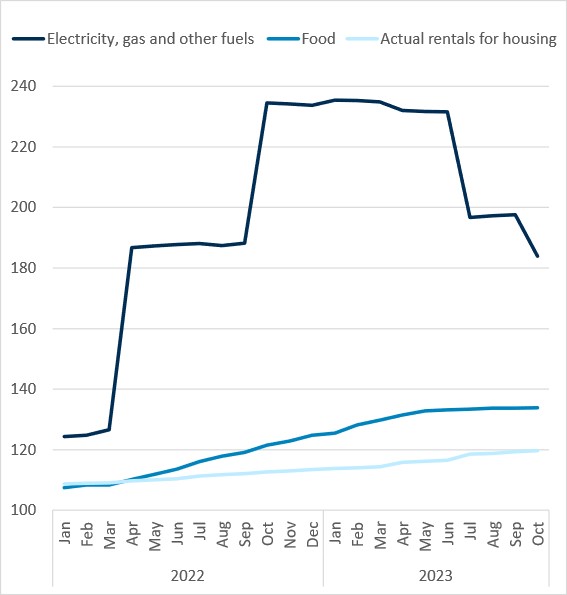
What we now call the cost of living crisis began with energy, when prices rose dramatically in early 2022. The price rise was sharp and required a crisis response which was delivered through interventions such as the Energy Price Guarantee and the Energy Bills Support Scheme. Energy prices have since dropped back somewhat, but remain high - gas prices are currently 60% higher than in October 2021 and electricity prices 40%.
Shortly after energy prices began rising, food prices also increased. The pattern was different to that in energy, with food prices rising more slowly but also in a more sustained fashion. Food prices are currently 30% higher than in October 2021.
More recently, the impact has been increasingly felt in housing, with rent increasing particularly since Spring 2023, and now at around 12% higher than in October 2021, and home owners facing significant increases to mortgage repayments given the rise in the Bank of England base rate from 0.1% in November 2021 to 5.25% today.
Different categories of essential expenditure have experienced different price changes
CPI indices for energy, food and rental, indexed to 2015 prices (2015 = 100)

Source: CPI Indices, 2015 = 100 (ONS)
So today we are dealing with significant price rises in three essential markets – energy, food and housing – each different in scale and having occurred at slightly different times, but each adding to the burden facing consumers. Inflation may be easing in some of these categories, but prices are still increasing and at historic highs. The crisis is not over.
Different impacts for different people
The second difference is that while virtually everyone will have felt some impact, what this looks like varies.
One characteristic that affects experience of inflation is income. Part of the reason for this is because income influences spending patterns. Not only have different categories of spending seen different price rises, but different groups of people spend proportionately more on some categories than others. This is covered in more detail in a previous blog, but the main point to highlight is that lower income households have much higher proportionate spend on the essential markets of food, energy and housing – 42% of their expenditure is on these three areas, compared to 22% for the highest income households.
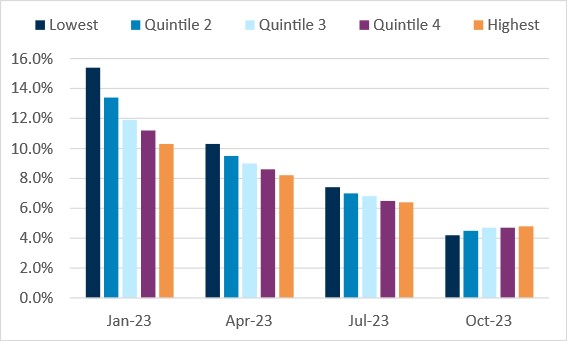
The difference in spending patterns means that inflation impacts different households differently. Consumer Scotland has been undertaking work to understand this, and as we previously highlighted this had meant that experienced inflation rates were higher for lower income households. In January, the lowest income households had an experienced inflation rate of 15.4%, compared to 10.3% for the highest income households. For the most recent inflation figures, however, this has reversed with the highest income households facing experienced inflation of 4.8% compared to 4.2% in the lowest income households.
The rate of experienced inflation had been consistently higher for lower income households, but this is no longer the case
12 month inflation rates by household income quintile

Source: Consumer Scotland analysis of the Living Costs of Food Survey, Consumer Price Index and Household Final Consumption Expenditure (ONS)
Note: Income quintiles are based on gross weekly household income. Quintile 1 is less than £330; Quintile 2 is £330 - £553; Quintile 3 is £553 - £840; Quintile 4 is £840 -£1,273; and Quintile 5 is over £1,273
Despite lower income households no longer facing a higher rate of inflation than higher income households, they are still struggling with the effects of having experienced higher inflation levels for longer, as well as having less of a financial buffer and less options to mitigate the impact of high inflation.
Different behavioural responses
The final difference is in behavioural responses, which are influenced in part by the variations already described.
One response has been to change spending patterns. Consumer Scotland’s regular tracker survey on energy affordability has included questions about whether respondents are cutting back on spending to afford energy bills, and if so where.
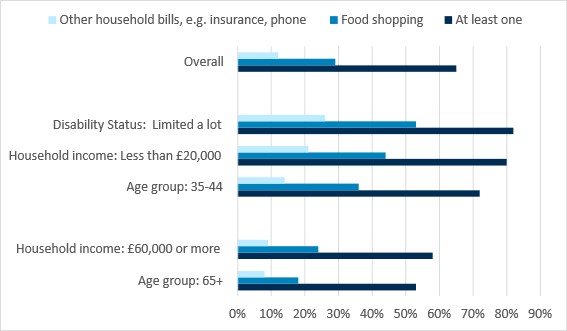
The most recent data from Autumn 2023 shows that 65% of households are cutting back on at least one area of expenditure, including essentials. As we’d expect, some groups were more likely to cut back than others. Those aged 35-44, limited a lot by disability or with the lowest household incomes were more likely to be making cuts. Of all the groups we considered, those aged 65+ and those in the highest income brackets were least likely to report cutting back.
While around two thirds of Scottish households report cutting back on expenditure, including on essential spending, some are more likely to do this
Survey findings detailing the proportion of respondents reporting that they are cutting back on expenditure in selected categories

Source: Consumer Scotland energy tracker question: Are you having to cut back your spending on any of these categories in order to afford to pay your energy bills nowadays? Please tick all that apply
Notes: Total sample size was 1589 adults. Fieldwork was undertaken online between 2nd - 18th October 2023. The figures have been weighted and are representative of all Scottish adults (aged 16+).
A second response has been increased interest in installing low carbon technologies that reduce energy consumption. Figures from MCS, a standards organisation for low-carbon products and installations, show that uptake of Solar PV panels has been significantly increasing in the last few years from 3,309 installed in 2021 to 9,848 in 2022 and 14,452 so far in 2023. While we cannot be sure what has caused this, it seems possible that the attraction of lower energy costs could have played a part.
Conclusion
So what can be concluded from all the above is that there is no universal single experience of the cost of living crisis. The scale and nature of the impact has varied over time, as different markets have been impacted by price rises at different times and it has varied through time as different groups of consumers have had different experiences. These variations have contributed to different behavioural responses from consumers in Scotland, with many cutting back on spending now, but others increasingly interested in investing in technologies that may help with future costs. What this means is that there cannot be a single response to the crisis. Rather, a holistic evidence-based approach that reflects the different markets and the different experiences is required.