The ONS published the latest inflation data on Wednesday, showing that the headline rate for the Consumer Price Index (CPI) fell slightly from 6.8% over the 12 months to July, to 6.7% for the 12 months to August. This means that, overall, prices are still rising but the rate of increase is lessening.
Anyone who has ever ‘shopped around’ knows that prices are different in different places, and that over time those prices also change differently. All in all, if you try to imagine all the different prices for things and how they might change over time at varying rates, it’s a pretty complex picture. The monthly inflation rates published by the ONS are an attempt to simplify this complex picture down to one number.
Over the last year, we’ve been working to roll that simplification back a level – to make the picture just one step more complex - and see how that overall inflation rate might be different for different sorts of household.
There are various reasons this might be the case. Prices might change more in some areas of the country than others, or the price of cheaper goods might change more than the price of expensive goods. Unfortunately these are not things we can measure with the data available. However we can look at what different sorts of household tend to spend money on, and whether that might mean that different households face different sets of price changes[i].
Inflation is falling faster for low income households than high income households
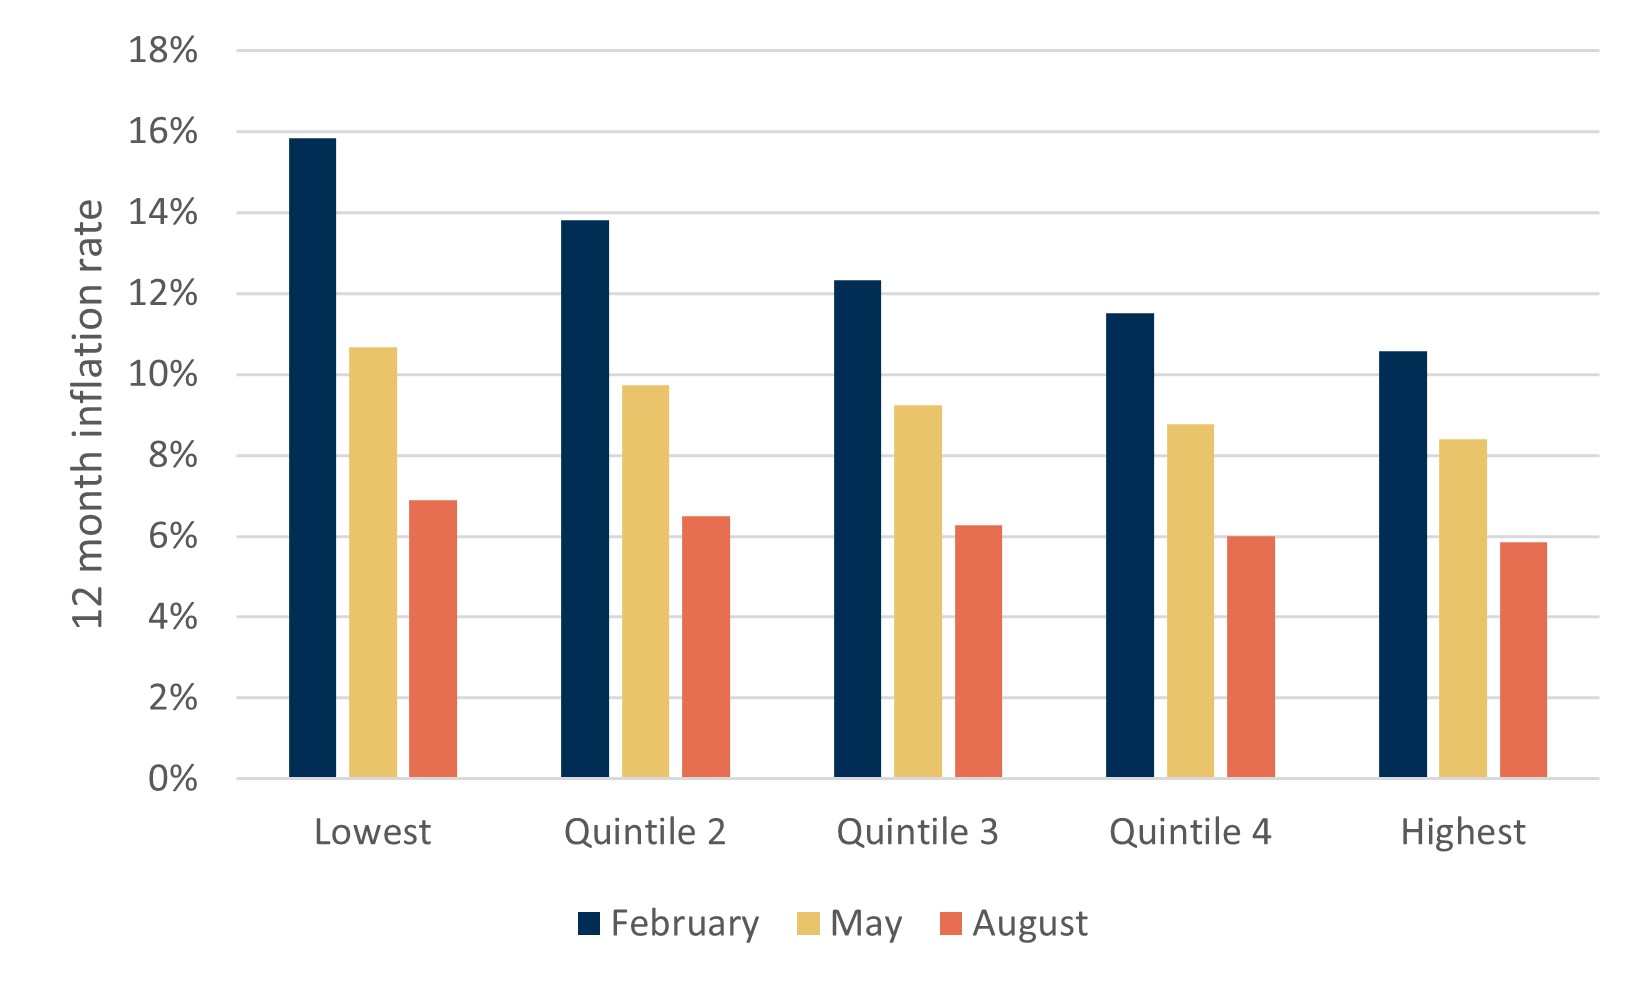
We divided the population into income quintiles – 5 groups of equal size according to household income. Quintile 1 represents those households in the bottom fifth by income, and quintile 5 represents the top fifth by income. Our analysis shows that, in August, UK households in the lowest income quintile faced a higher rate of inflation at 6.9%, compared to households in the highest income quintile where the inflation rate was 5.9% (Chart 1).
However, as the rate of inflation has fallen since the start of the year so the gap between the inflation rates experienced by the lowest and highest income quintiles has narrowed. In February households in income quintile 1 faced an inflation rate of 15.8%, while those in income quintile 5 experienced an inflation rate just two thirds of that, 10.6%. In other words, inflation has fallen faster for low income households than high income households, just as 2022 saw inflation rise faster for low income households.
Chart 1: The rate of inflation in 2023 has been higher for lower income households
12 month inflation rates by household income quintile
Source: Consumer Scotland analysis of The Living Costs and Food Survey, Consumer Price Index and Household Final Consumption Expenditure (ONS)
Note: Income quintiles are based on gross weekly household income. Quintile 1 is less than £330; Quintile 2 is £330 to £553; Quintile 3 is £553 to £840; Quintile 4 is £840 to £1,273; and Quintile 5 is over £1,273.
These differences are the result of differences in the composition of household expenditure – the proportion of total household expenditure that goes on different categories of goods and services. We looked at this in our previous inflation blog.
If we look at the different rates of inflation for different categories of goods and services (Table 1) we can see that the inflation rate remains highest for Food and Non-Alcoholic Beverages, which tends to make up the largest part of the expenditure of lower income households. Conversely transport costs, which tend to make up the largest part of high income households’ expenditure, have actually fallen over the 12 months to August - although this looks set to change as petrol prices start to climb.
Table 1: The inflation rate is different for different categories of goods and services
12 month inflation rates by category of goods and services
|
Category |
12 month inflation rate |
||
|---|---|---|---|
|
February |
May |
August |
. |
|
Food and non-alcoholic beverages |
18.0 |
18.3 |
13.6 |
|
Alcoholic beverages and tobacco |
5.7 |
9.3 |
10.5 |
|
Clothing and footwear |
8.1 |
7.1 |
7.0 |
|
Housing, water, electricity, gas and other fuels |
26.6 |
12.1 |
7.0 |
|
Furniture, household equipment and maintenance |
8.7 |
7.5 |
5.1 |
|
Health |
6.8 |
8.3 |
8.5 |
|
Transport |
2.9 |
1.2 |
-0.5 |
|
Communication |
3.7 |
9.1 |
8.2 |
|
Recreation and culture |
4.0 |
6.7 |
5.8 |
|
Education |
3.2 |
3.2 |
3.2 |
|
Restaurants and hotels |
12.1 |
10.3 |
8.3 |
|
Miscellaneous goods and services |
6.6 |
6.8 |
5.6 |
|
Overall |
10.4 |
8.7 |
6.7 |
Source: Consumer Price Inflation Detailed Reference Tables (ONS)
This results in an overall inflation rate that is higher for households that spend a greater proportion of their total expenditure on high inflation categories. At the moment, and for the last 18 months or so, this has been the situation for low income households.
However, that appears to be changing. Energy and food have been the main high inflation categories over the last year and a half, but energy costs have been falling throughout 2023, and the rise in food costs is finally starting to slow. In the most recent inflation figures, the rates of inflation on both Health and Restaurants & Hotels - which make up a larger proportion of the expenditure of higher income households - are higher than on Housing, Water and Fuels, which was by far the largest source of inflation back in February. So while our analysis shows that prices are still rising more for lower income households than higher income households, things seem to be moving away from that situation.
Inflation is a little higher in Scotland
At Consumer Scotland we are particularly interested in how inflation affects Scottish consumers. The process of gathering the prices that inflation indices are based is not designed to provide separate price data for Scotland, so it’s not yet possible to account for how prices might be changing differently in Scotland than in the rest of the UK. However we can look at how the composition of household expenditure might be different in Scotland, and how that might affect the rate of inflation experienced by Scottish households.
We found that the inflation rate for Scottish households is 6.4%, slightly higher than our calculated UK rate of 6.2% (different from the official rate because of differences in our methodology). This difference is largely driven by a higher Scottish inflation rate for housing, water and fuels. When looking more closely into the components of this category, the unsurprising culprit is the cost of energy, which makes up a greater proportion of Scottish households’ expenditure than it does for households in the rest of the UK (as a whole) - UK Government figures show median gas consumption is 8% higher in Scotland than in England and Wales.
We plan to carry out further work to enable a more nuanced view of price inflation in Scotland and its impact on Scottish households.
Notes
[i] In this analysis we used a methodology guided by the methodology used by the ONS, but not exactly in line. For example, we use figures for total household consumption expenditure from 2022 rather than 2021, and Living Costs and Food Survey figures from three years pooled rather than one year (in order to boost sample size in Scotland). This results in our estimated inflation rates being slightly different to official figures published by the ONS. For example, our methodology estimates an overall UK rate of inflation of 6.2%, rather than the official figure of 6.7% for CPI. However, on the assumption that the difference in methodology will affect estimates for all households in the same way, the comparisons we draw between different household groups should still be valid.
A further limitation of our analysis is that it applies one set of price changes to all households. The differences in estimated inflation rates we find are solely due to differences in the composition of household expenditure, and not due households experiencing different price changes for the same goods or services. If, for example, prices have changed differently in Scotland than in the rest of the UK, our analysis would not pick this up.