Summary
This blog describes recent trends in inflation and sets out the issues that will influence inflation in 2023. Inflation remains high but is being experienced differently by different groups. And whilst inflation is anticipated to fall rapidly in the second half of the year, price levels of most essential goods and services are likely to remain significantly elevated compared to 2021, with lasting consequences for consumers.
Inflation is falling but remains high
The ONS yesterday released its latest figures on inflation, covering the period up to February 2023. The Consumer Prices Index including owner occupiers' housing costs (CPIH) measure of inflation was 9.2% in the 12 months to February 2023. This was slightly higher than the 8.8% of the previous month, and only slightly below the high of 9.6% recorded in October.
Different categories of goods and services exhibit very different rates of price change. In the 12-months to February 2023, housing and household services (which includes energy costs) increased 11.8%, whilst food and non-alcoholic drink increased by 18.2% - the highest rate of inflation for this category since 1977. In contrast, the ONS measure of ‘core’ inflation – which excludes energy, food, alcohol and tobacco – was ‘just’ 5.7%.
The contribution of different categories of goods and services to the overall inflation rate is determined by the price change for that category as well as its weight in household spending. In the year to February 2023, the largest upward contributions to the annual CPIH inflation rate came from housing and household services (principally from electricity, gas, and other fuels), and food and non-alcoholic beverages. Contributions from these two categories accounted for over half of the annual CPIH inflation rate.
This continues the pattern of previous months. Chart 1 shows the substantial contribution to overall inflation made by the Housing and household services category in the last 18 months. The chart also shows that, over the last year, food prices have also been a significant driver of inflation, adding 1.7 percentage points to the overall inflation rate in the most recent figures, while the contribution of transport costs to inflation has decreased, reflecting the rise and fall of pump prices.
Chart 1: Inflation has been driven by increases in food prices and energy bills (the largest part of Housing and household services)
Contributions to the annual CPIH inflation rate, UK, February 2021 to February 2023
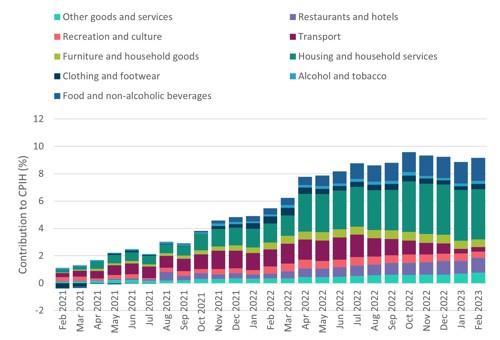
Source: ONS Consumer price inflation, UK: February 2023. Note: electricity, gas and other domestic fuels accounted for 2.5 percentage points of the 9.2% inflation in February 2022.
Why inflation is much higher for low-income households
Headline measures of inflation, including The Consumer Prices Index (CPI) and CPIH, describe the rate of increase in the prices of a representative basket of goods and services.
But like any aggregate measure of the economy, these headline indices mask significant variation in the way that inflation is experienced by different groups of consumers.
The ONS collects prices for a list of around 700 products and services, and uses expenditure patterns derived from a household survey to determine how much each type of product or service should contribute to the overall measure of inflation. That means that the headline measure of inflation represents the change in the cost of goods and services for the ‘average household’, and that households with expenditure patterns that differ from this average may find that the headline rate of inflation does not reflect the changes in costs they experience.
If we categorise expenditure by type of product or service we can examine how much households tend to spend on each category, and how these spending shares might differ between households.
Chart 2 shows the average amount spent on each category[i] of products and services by households in each income quintile, in Scotland[ii]. Unsurprisingly it shows that, overall, households with higher incomes have higher expenditure. Households in the highest income quintile spend, on average, over four times as much as households in the lowest income quintile - £1011 per week compared to £238 per week.
Chart 2: The highest income households spend more on all categories of goods and services than the lowest income fifth
Mean weekly household expenditure by income quintile[iii], Scotland
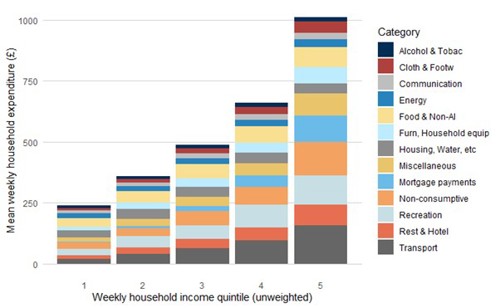
Source: Consumer Scotland analysis of Living Costs and Food Survey, 2017-2018 to 2019-2020
Whilst higher income households spend more on all categories of goods and services in absolute terms than lower income households, the shares of total spending on different categories of goods and services varies significantly between those household groups. It is these differences in the proportion of household expenditure going on each category that will mean that households experience inflation differently.
Chart 3 shows the same data as Chart 2, but as proportions (or shares) of total expenditure rather than in pounds spent. Some categories – for example, ‘Clothing and footwear’ or ‘Furnishings, household equipment and routine household maintenance’ – make up a relatively consistent proportion of expenditure for households across the income quintiles. Other categories – for example, ‘Mortgage payments’ and ‘Transport’ – make up a larger proportion of expenditure as household income increases. Finally some categories – most notably ‘Energy’, ‘Food and non-alcoholic beverages’ and ‘Housing, water, etc’ – make up a smaller proportion of the expenditure of households in higher income quintiles than lower.
Chart 3: The share of household spending on different categories of goods and services varies significantly between lower and higher income households
Weekly household expenditure as a proportion of total expenditure by income quintile, Scotland
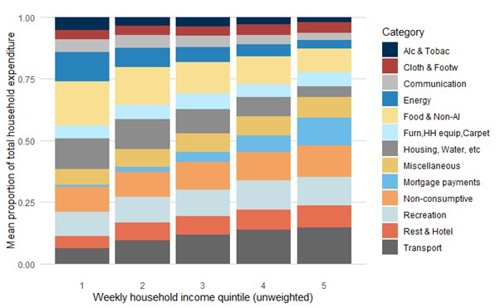
Source: Consumer Scotland analysis of Living Costs and Food Survey, 2017-2018 to 2019-2020
The rising cost of energy has been at the centre of the recent cost of living crisis. The data shown here are from 2017-2020, and so don’t take account of recent increases in energy costs. However, the fact that spending on energy makes up a larger proportion of the spending of lower income households illustrates why low income households are particularly exposed to energy price rises.
During the period covered by the data, households in the lowest income quintile in Scotland paid 11.7% of their total expenditure towards energy bills, while households in the highest quintile paid just 3.8%.
These differences in spending shares underlie estimates from the ONS that the lowest income 10% of households experienced an effective inflation rate of 10.3% in 2022, whereas the highest income 10% of households experienced an effective inflation rate of only 8.2% (Chart 4).
Chart 4: Experienced inflation in 2022 has been highest for low-income households
CPIH-consistent inflation rate estimates by decile of household income, UK
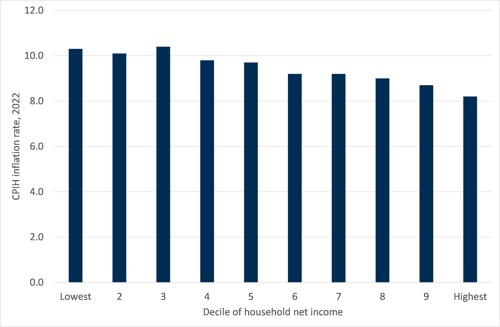
Source: ONS, CPI and CPIH-consistent inflation rate estimates for UK household groups: November to December 2022 data
Inflation is forecast to fall throughout the rest of 2023, but prices of some goods and services will remain high
Inflation is anticipated to fall rapidly throughout the remainder of 2023. Both the Bank of England’s February forecasts and the OBR’s March forecasts anticipate inflation falling to below 4% by the end of 2023, and below 2% in the first half of 2024 (Chart 5).
Chart 5: Inflation is expected to fall rapidly throughout 2023
CPI inflation and the direct contribution of energy to CPI
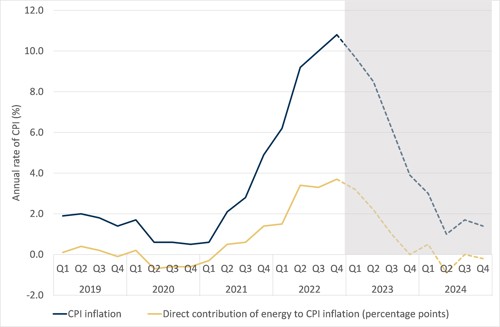
Source: Bank of England, Monetary Policy Report, February 2023
There is of course uncertainty around the forecasts for inflation. Inflation in the second half of 2023 could turn out higher than anticipated if there are unexpected disruptions to gas supply or storage, or a re-emergence of global supply chain pressures.
Lower inflation would be good news for consumers. High inflation is detrimental for consumers because it erodes the real terms value of their incomes. But inflation affects consumer welfare in other ways too, making it harder to work out what is a good and bad deal when prices are changing frequently and rapidly.
But it is important to remember that falling inflation does not mean falling price levels; merely that the rate of increase will slow. Even where prices for particular goods and services do fall, they are extremely unlikely to fall anywhere close to their pre-2022 levels in the near future. Energy bills for example are on course to finish the year almost twice as high as they were in 2021. The rise in food and drink prices should ease substantially, but it is unlikely that much if any of the 24% cumulative rise in food and drink prices since February 2021 will unwind.
The legacy for consumers of the inflation of 2022 and 2023 is likely to persist, even as the headline inflation rate begins to fall. The impact of these changes may not be evenly distributed across income distribution given the significant differences in the shares of spending on different categories of goods and services by lower and higher income households. Inflation has made us all poorer, but it has made some poorer than others.
Endnotes
[i] The categories used are based on the Categorisation of Individual Consumption According to Purpose (COICOP), published by the United Nations Statistics Division, and used in CPIH statistics, but differ in the following ways: In COICOP energy expenditure is included in ‘Housing, water, electricity, gas and other fuels’ but is shown separately here; the ‘Mortgage payments’ category includes both mortgage interest and principal, neither of which are included in COICOP – mortgage interest is included in the ‘Non-consumptive’ category in CPIH but is removed from that category here; The ’Miscellaneous’ category shown here includes ‘Health’ and ‘Education’, which are separate categories in both COICOP and CPIH.
[ii] The chart uses data from the Living Costs and Food Survey (LCFS) spanning financial years 2017-2018 to 2019-2020. Because 2020-2021 (the most recent year for which LCFS data is available) was an unusual year (as a result of the pandemic and lockdown) it has been excluded from the three-year average figures presented here.
[iii] The weekly income income quintiles are as follows: Quintile 1: £0-£276. Quintile 2: £276-£461. Quintile 3: £461-£721. Quintile 4: £721-£1101. Quintile 5: £1101-£2496.