1. Executive summary
The social rented sector plays a vital role in Scotland’s housing system, providing affordable and secure homes for those who might struggle in the private market. Almost a quarter (23%) of Scotland’s homes are social rented properties.
Our review of existing research identified a lack of recent evidence on the experiences of social renters, how those vary across characteristics of social renter, and how those compare with renters in the private rented sector. To better understand these experiences and identify where improvements to policy or practice could be made, Consumer Scotland commissioned IFF Research to undertake a representative survey of renters in Scotland’s social rented sector. The research aimed to generate robust evidence to support policy development, advocacy, and allow comparisons with the private rented sector.
The research explored key issues affecting social renters, including differences in experience across landlord types and demographic groups, to inform policy or practice changes which could strengthen renter outcomes. The research achieved a final sample of 1,402 Scottish social renters, via a blended methodology of online responses and telephone interviews to reduce digital exclusion and age bias. The survey covered landlord satisfaction, communication, property conditions, reporting and rights, accessibility and security, improvements, and demographic information.
Key findings
Most social renters are satisfied with their renting experience, but there are key demographic differences in the renter experience:
- Most (74%) social renters are satisfied with their overall experience of renting their property – including the property itself, its costs, and their dealings with their landlord
- The majority of renters are happy with their home, with 77% rating the overall condition as good
- Energy efficiency/cost to heat the property is the poorest-performing area of self-reported property condition, with only 62% rating this as good
- Most renters are satisfied with the overall repairs service (79%) but slightly less so for timeliness (76%) and communication (73%) of repairs
Certain groups consistently report worse experiences across a range of measures, even when controlling for the effects of potential explanatory variables:
- Renters who have health conditions or disabilities that limit their day-to-day activities[1]
- Renters aged 35-44
- Renters living in older unrenovated properties (that have been built over 10 years ago and have not been recently renovated)
- Renters without a known housing officer or named point of contact (do not have one or do not know how to contact them)
Problems are common, and handled poorly:
- Over half (53%) of social renters have experienced at least one problem with the condition of their property in the last six months, such as difficulty keeping the home warm, repairs not being carried out, and serious damp or mould
- Only 30% of renters who reported their condition-related problem to their landlord had it fully resolved
- A small proportion (18%) of renters made a complaint to their landlord in last 12 months
- Few renters are satisfied with their landlord interaction following a complaint – of those who made a complaint, only 30% are satisfied with the speed at which the complaint was resolved
- Around a quarter (28%) of renters reported paying for or completing a repair themselves that they believed should have been covered by their landlord
- Most renters (59%) always report issues to their landlord, but some choose not to for practical reasons – such as fixing the problem themselves or feeling it is not urgent or serious enough – rather than out of fear of landlord retaliation
Many renters are unaware of their rights and routes to redress:
- Few social renters know their rights; only 48% say that they know where to go if their landlord fails to address their issue or complaint
- Similarly, only 43% of renters with property condition problems that had not been fully resolved by their landlord sought further help or advice
- Most (71%) renters have a local housing officer or named point of contact and know how to contact them, but 29% do not
2. Introduction
This report presents analysis of new survey data on renters’ experiences in Scotland’s social rented sector. It covers the main findings from the survey, across topics such as property conditions; repairs and maintenance; experience of problems; awareness of redress systems; and landlord relationships.
The social rented sector plays a vital role in the housing system, providing affordable and secure homes for people who might struggle in the private market. Almost a quarter (23%) of Scotland’s homes are social rented properties.[2]
A Consumer Scotland 2024 scoping study found that, while there is a range of valuable existing evidence on the social rented sector, there remains limited large-scale, representative research capturing renters’ experiences in sufficient detail to inform policy development.[3] Existing sources – including the Scottish Housing Regulator’s National Panel of Renters and Service Users,[4] the National Report on the Scottish Social Housing Charter,[5] and the Scottish House Condition Survey[6] – provide useful high-level indicators. However, because they largely focus on housing stock characteristics or rely on data reported by landlords, they offer only a partial picture of renters lived experience across the sector. This highlights a gap for more granular, solution-focused evidence to inform decision-making.
Existing social rented sector research provides valuable insights into renter experiences, but much of it is thematic or based on relatively small, non-representative samples. For example, the National Panel research in 2025 provided strong qualitative evidence from 84 individuals, but the survey element only achieved 230 responses and was therefore not representative of the wider social rented population. Our initial review also highlighted important differences across tenures – such as between council and housing association renters, and social rented sector and private rented sector renters – which have not yet been fully explored in existing research.[7]
Recent private rented sector surveys, including RentBetter[8] and Voice of the Tenant[9], allow for detailed understanding of private renters’ experiences. However, no equivalent large scale, representative data currently exists for the social rented sector.
At the same time, existing evidence indicates that many social renters continue to face issues relating to repairs, communication, influence over decisions, and landlord transparency. For example, the National Panel found that only a third (36%) of those who reported an issue felt it had been completely resolved, and many were not confident that their landlord would deal effectively with future problems.
To better understand the experiences of social renters in Scotland and to identify where improvements might be made to benefit those across both sectors, we resolved to:
- Gather quantitative evidence on the experiences of social renters, to identify what affects satisfaction levels and where improvement may be needed
- Compare our evidence with similar recent surveys of private tenants, to identify disparities in outcomes across tenure types and support advocacy for improvements in each sector
Consumer Scotland therefore commissioned IFF Research to conduct a representative survey of social renters in Scotland to get a better understanding of their experiences. This research seeks to address gaps by generating a richer, more representative picture of renter experiences across the social rented sector. This will help us identify where policy or practice change could most effectively improve outcomes for social renters.
The following report covers main findings from the survey. A separate policy briefing covers the wider policy context and recommendations based on these results.
3. Methodology
Consumer Scotland commissioned this research to better understand the experiences of social renters in Scotland. See Appendix A for further information on methodology.
The research project began in January 2025 with a review of existing survey research. This review identified three themes central to renter satisfaction:
- Repairs and maintenance
- Communication
- Security of tenure
Three virtual focus groups were conducted in February 2025 with 18 participants from a diverse mix of demographics to further refine themes for the wider research. During the focus groups, participants expressed frustration with inconsistent waiting times and poor communication, including delays and lack of follow-up. Repairs dominated discussion, especially in older properties, with renters reporting issues around damp, mould and poor build quality. Many renters lacked awareness of their rights and wanted greater transparency and involvement in decision-making.
These insights shaped the pilot questionnaire, which was piloted in March 2025 with 100 respondents. The questionnaire covered satisfaction, communication, property conditions, problems and complaints, rights and redress routes, accessibility and security of tenure, and suggestions for improvement. Survey questions were designed to mirror existing measures, including: the Tenant Satisfaction Measures (England)[10]; the RentBetter Research Programme[11]; and the Voice of the Tenant Survey Scotland.[12]
The mainstage survey ran between July and September 2025. A blended methodology (approximately 1,050 online responses and 350 telephone interviews) was used to reduce digital exclusion and age bias. The survey achieved a sample of 1,402 Scottish social renters, with quotas to balance representation between council and housing association renters. Weighting was applied to align the sample with the age profile of social renters in the Scottish Household Survey.
IFF Research provided the raw dataset and accompanying data tables, which include descriptive statistics for all survey questions and highlight statistical significance between key groups (based on significance testing at the 95% confidence level).
Consumer Scotland conducted additional analysis on the data, including further descriptive statistics, chi-square tests and logistic regression modelling. Because subgroup analysis only considers individual characteristics in isolation, logistic regression was used to identify which demographic and household characteristics were statistically significant predictors of key outcomes (such as overall satisfaction), after controlling for other relevant factors including property age and landlord type.
To support interpretation of these results, the report only presents descriptive subgroup percentages for those characteristics that remained statistically significant in the regression models. Unless otherwise specified, subgroup differences reported in the text are statistically significant at the 95% confidence level, and remain significant after accounting for potential explanatory variables, such as property age and landlord type.[13]
For example, initial results suggested that council tenants reported poorer property conditions and renting experiences than those renting from housing associations. However, once other variables were accounted for, many of these differences were no longer statistically significant. This indicates that the gap between landlord types is largely explained by other factors – most notably property age, given that council renters are more likely to live in older properties than housing association renters.[14]
Where possible, throughout this report we compare survey results with those from private rented sector studies, RentBetter and Voice of the Tenant.
4. Renter satisfaction
This chapter presents renters’ satisfaction with their overall experience of renting their property – including the property itself, its costs, and their dealings with their landlord. While 74% of renters are satisfied with their renting experience, satisfaction was notably lower among some renters, particularly those living in older homes (over 10 years old) that have not been recently renovated and renters aged 35-44. Low satisfaction is also driven by renters’ experiences – including having had a previous negative experience, encountering a recent condition-related problem, and having made a complaint.
Overall satisfaction
Most (74%) renters are satisfied with their overall experience of renting their property – including the property itself, its costs, and their dealings with their landlord. While a minority (13%) are dissatisfied, this corresponds to a substantial number of people – equivalent to 140,000 social renters in Scotland.
Variation by demographic characteristics
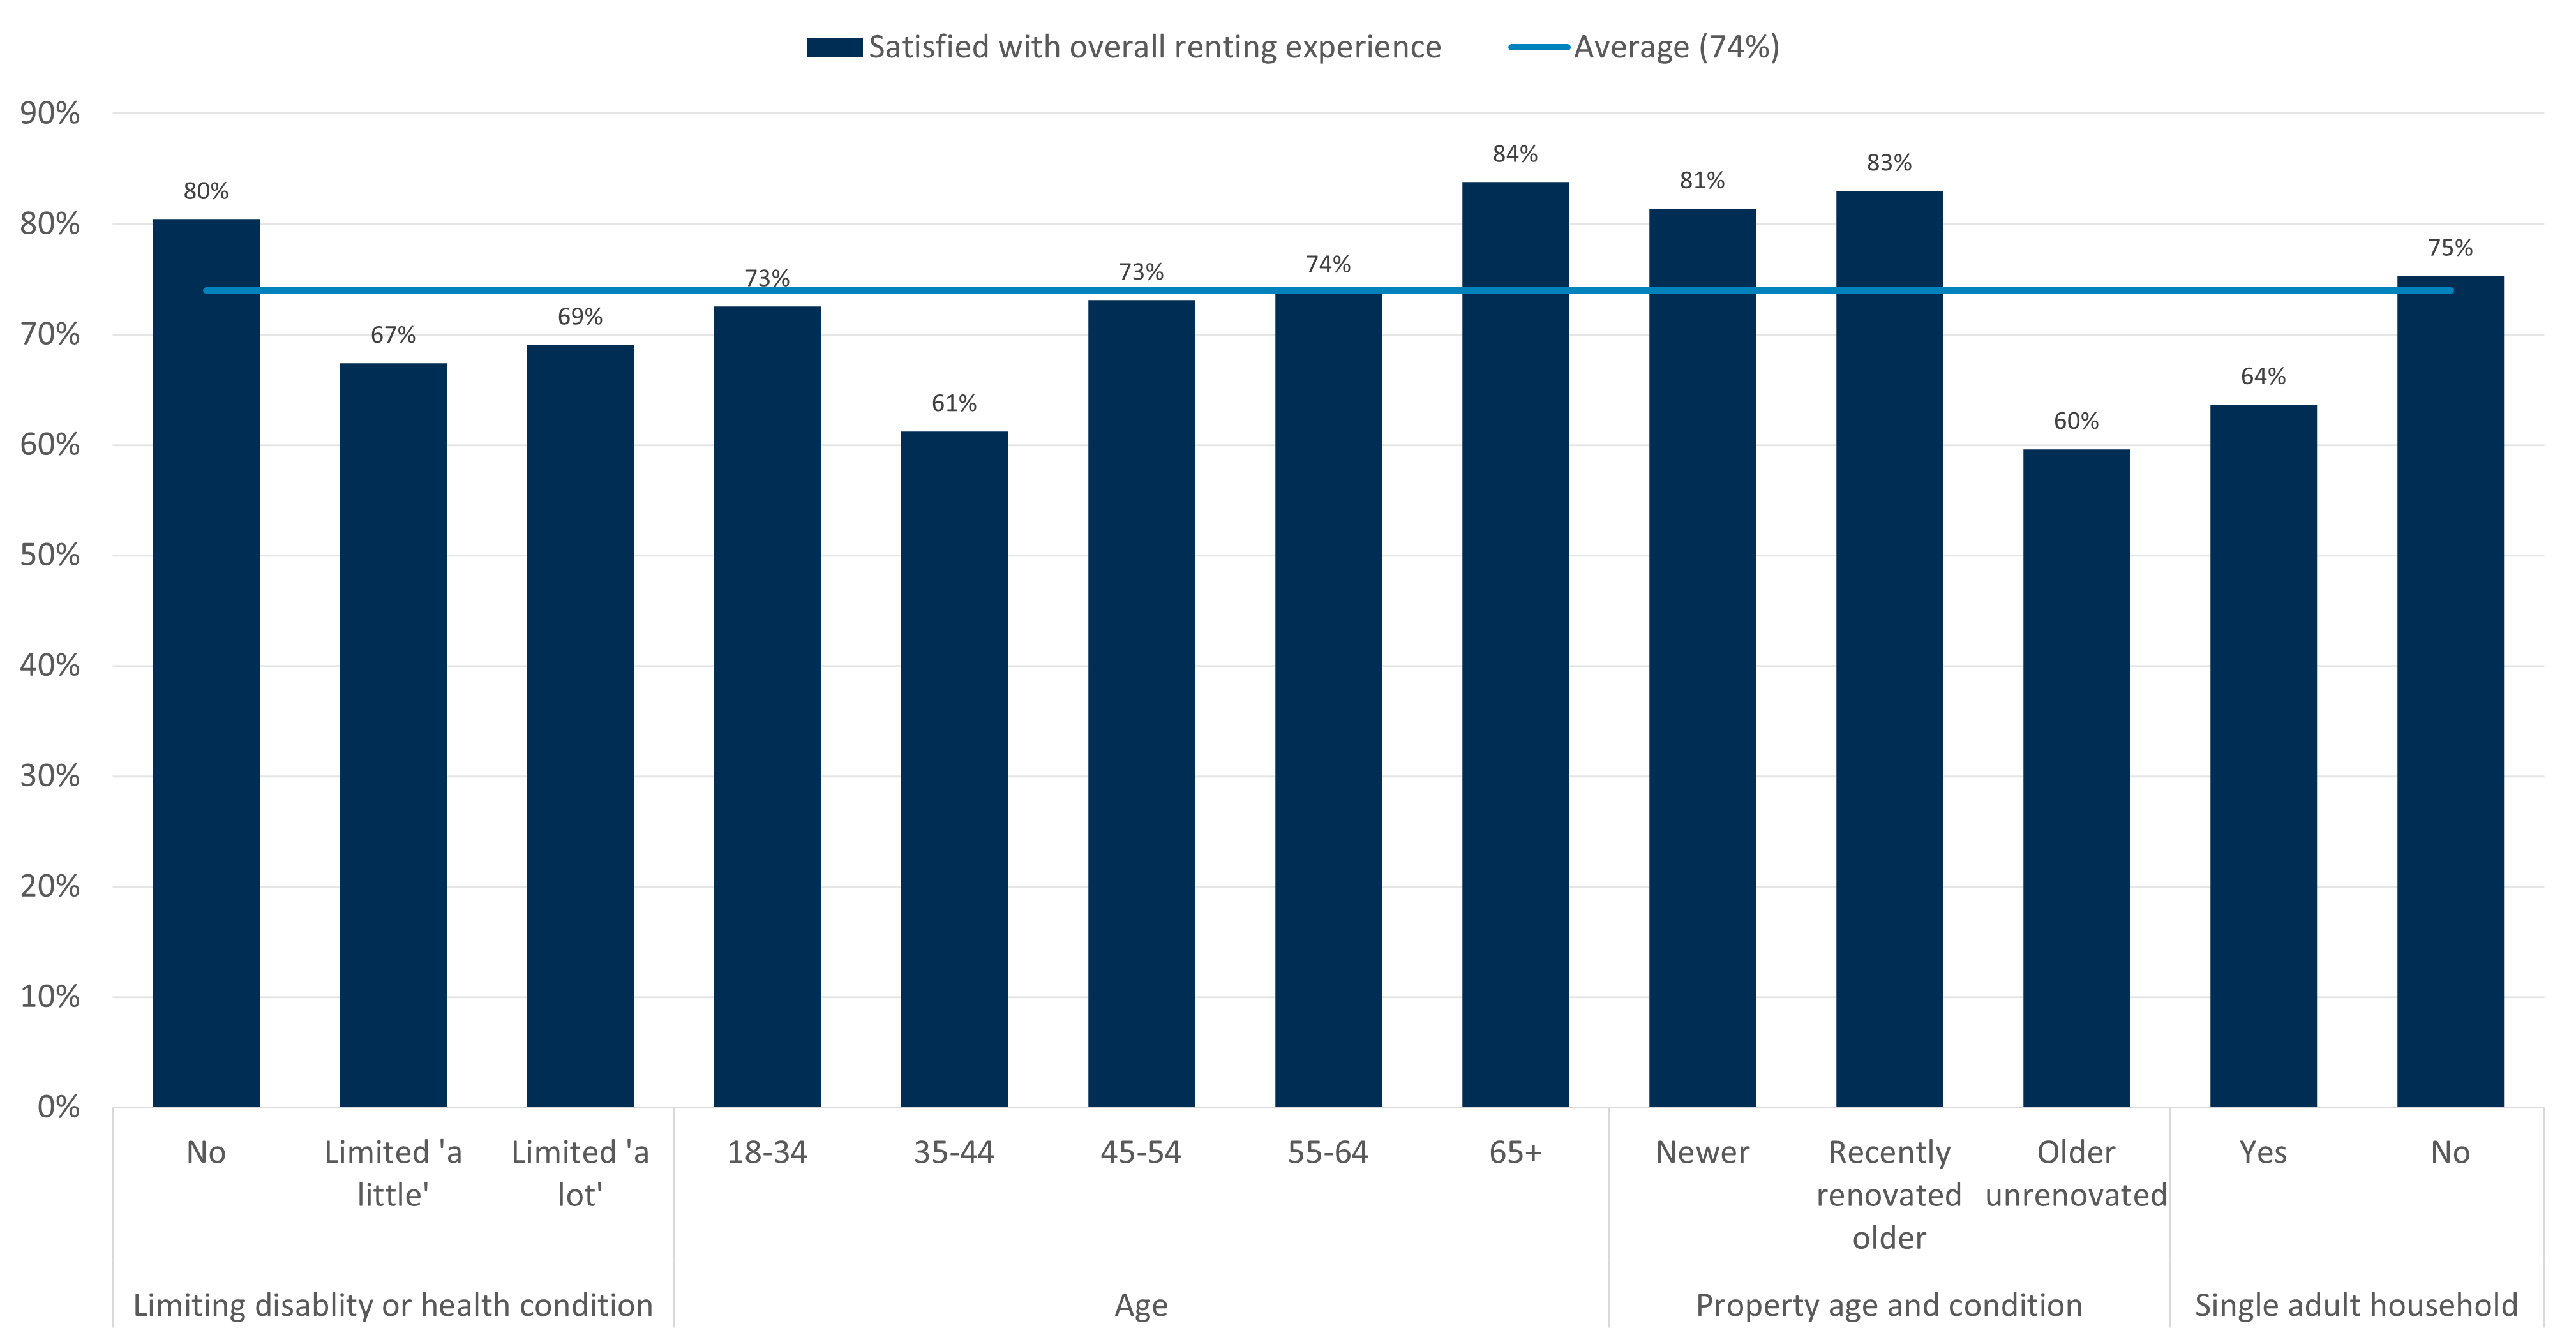
Certain groups of renters are less satisfied with their overall renting experience (Chart 1):[15]
- Renters who have disabilities or health conditions that limit their day-to-day activities ‘a little’ (67%) or ‘a lot’ (69%), compared with those without (80%)
- Renters aged 35-44 (61%), compared with 65+ (84%)
- Renters living in older unrenovated properties (over 10 years old and not recently renovated, 60%), compared with those in newer (81%) or recently renovated older properties (83%)
- Single adult households (64%) compared with other household types (75%)
Why is there this dip in satisfaction among 35-44 year olds? We explored several potential explanations—such as the possibility that this age group tends to have shorter tenancies or is more likely to have children in the household, factors which could reasonably influence housing experiences. However, the trend persists even after controlling for key variables including income, tenancy length, the presence of children under 18, and whether the household is a single adult household. This suggests that the lower satisfaction among 35-44 year olds cannot be fully explained by these characteristics alone and may reflect other experiences or characteristics specific to this life stage.
Chart 1: Renter satisfaction is particularly lower among renters living in older properties (over 10 years old) that have not been recently renovated, and renters aged 35-44
Percentage of respondents who are ‘very satisfied’ or ‘fairly satisfied’ with the overall experience of renting their property, by demographics.
Source: Consumer Scotland’s Social rented sector survey, A1. Thinking about your overall experience of renting this property including the property itself, its costs, and your dealings with your landlord, how satisfied or dissatisfied are you with your overall experience? N = 1,402.
Drivers of renter satisfaction
Having established overall satisfaction varies across demographic groups, this section further examines the underlying drivers of those differences. Logistic regression analysis allows us to assess which experiences continue to predict satisfaction after controlling for both renter characteristics and property characteristics.[16] The results show that, while these demographic differences remain significant, experience‑based variables also predict satisfaction levels.
The model includes a range of experience‑based indicators, such as whether renters have:
- Had a negative experience while renting in the past five years (such as repairs not being done, complaints not being taken seriously, an unreasonable rent increase)
- Experienced a problem with the property’s condition in the last six months
- Had a repair carried out by their landlord in the last 12 months
- Reported anti-social behaviour to their landlord in the last 12 months
- Made a complaint to their landlord in the last 12 months
- Reported any other issues to their landlord in the last 12 months
- Know where to go if their landlord fails to address their issue or complaint
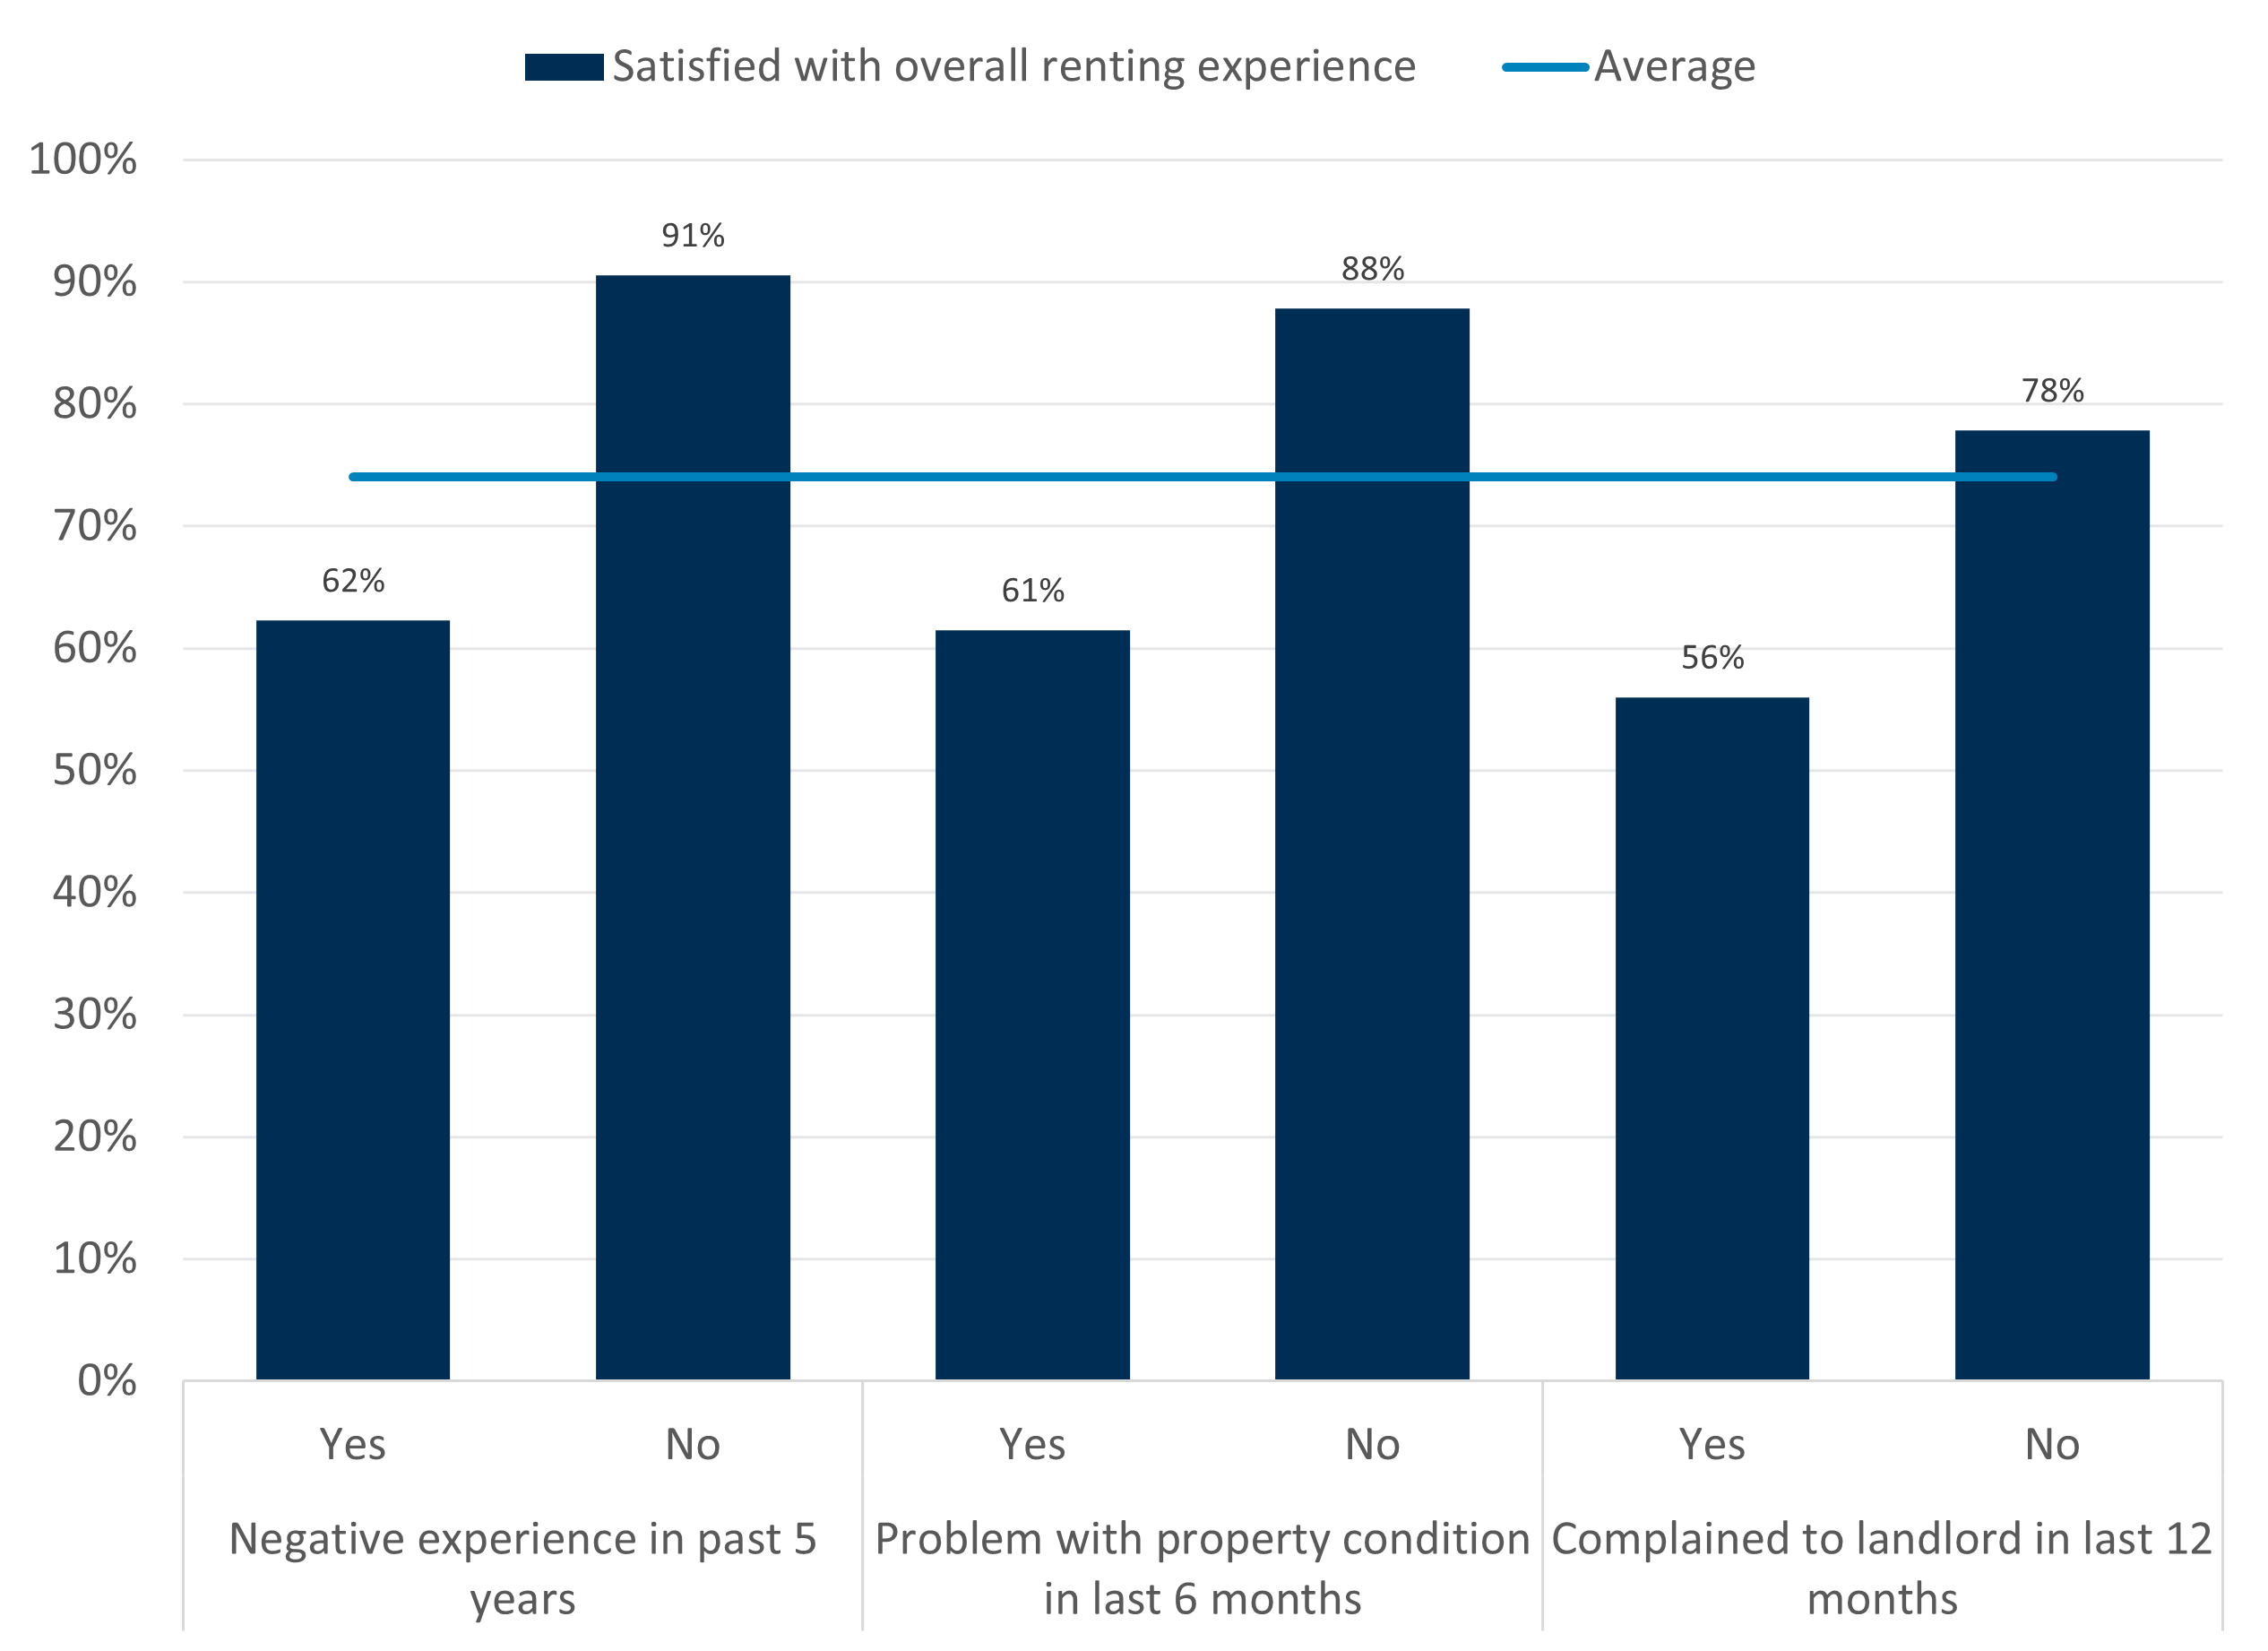
The analysis shows that specific types of negative renter experiences contribute most to overall dissatisfaction, over and above the demographic characteristics identified earlier (Chart 2). In particular:
- Having had a negative experience in the past five years is the strongest predictor in the model; renters who have had one were around 24 percentage points less likely to be satisfied with their overall renting experience
- Renters who experienced a property condition problem in the last six months were also significantly less likely to be satisfied (by around 12 percentage points)
- Renters who had made a complaint in the last 12 months were also less likely to be satisfied (by around seven percentage points)
Other experience indicators – such as whether a repair had been carried out in the last 12 months or whether they had reported anti‑social behaviour or other issues – showed no meaningful independent effect once the model adjusted for wider factors. The same was true of knowing where to seek help if a landlord fails to act, which was positive but not significant.
Chart 2: Renter satisfaction is also predicted by experience-based indicators, particularly whether renters have previous negative renting experiences
Percentage of respondents who are ‘very satisfied’ or ‘fairly satisfied’ with the overall experience of renting their property, by experience-based predictors of satisfaction
Source: Consumer Scotland’s Social rented sector survey, A1. Thinking about your overall experience of renting this property including the property itself, its costs, and your dealings with your landlord, how satisfied or dissatisfied are you with your overall experience? N = 1,402.
5. Property conditions
This chapter explores how social renters perceive the quality of their homes and how well they meet their needs and expectations. It examines renter perceptions of specific aspects of their property, such as overall condition and energy efficiency/cost to heat the property. Renters generally rate their property well, but less so for energy efficiency/cost to heat it. Perceptions of property condition are particularly poorer among those living in older properties (over 10 years old) that have not been recently renovated.
Renter perceptions of their home
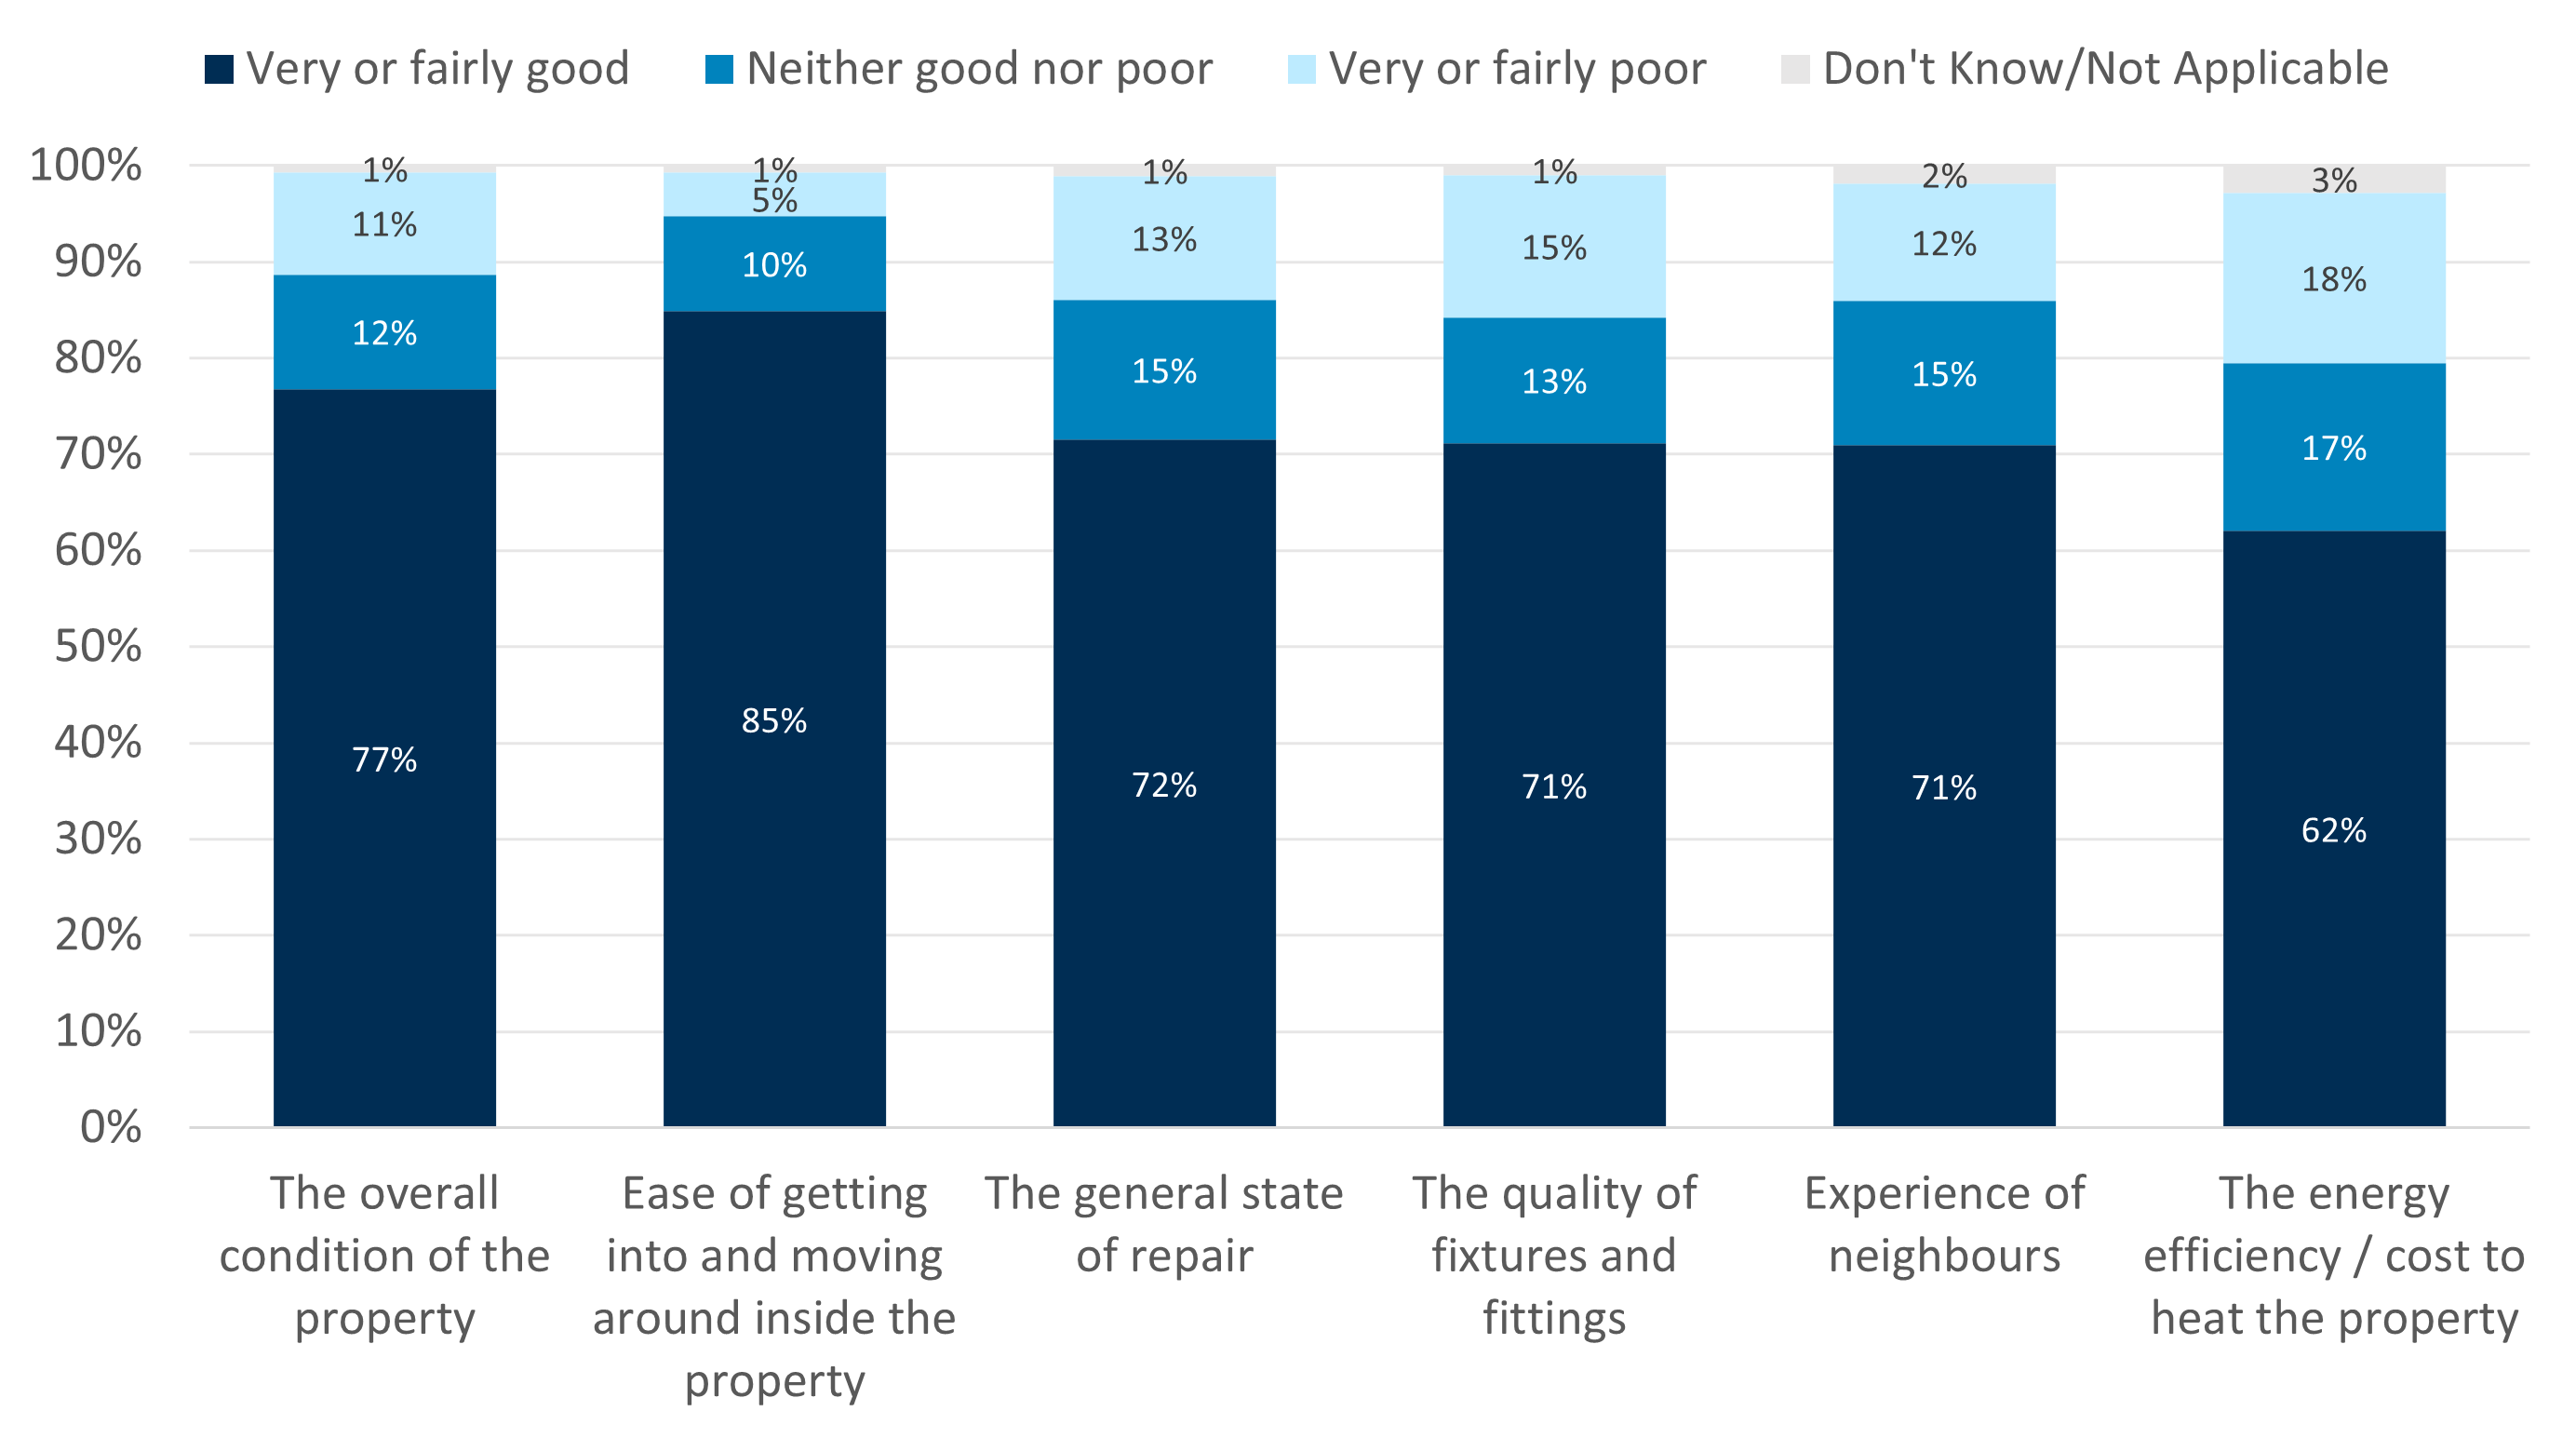
We asked renters about specific aspects of their property – including the overall condition; accessibility; state of repair; quality of fixtures and fittings; experience of neighbours; and energy efficiency/cost to heat the property – to allow comparison with the private rented sector.
Overall, social renters have positive perceptions of their homes; 77% rate the overall condition of their property as good, while 11% rate it as poor (Chart 3). The best-performing area is ease of getting into and moving around inside the property, with 85% rating this as good.
Renters are less happy with the energy efficiency/cost to heat the property, with only 62% rating this as good (and 18% rating it as poor). While this data highlights clear concerns, it is not possible to determine the extent to which these perceptions are driven by the property’s actual energy efficiency – where landlords have direct influence – or by wider energy costs, which are out with landlords’ control.
This distinction is important given that the social housing sector is generally more energy‑efficient than other tenures; with higher levels of insulation and better EPC ratings (Scottish House Condition Survey).[17] One factor explaining this is the introduction of the Scottish Housing Quality Standard in 2004, which requires social housing properties to have loft insulation if they have appropriate loft space.[18]
Despite this higher energy efficiency in the social rented sector, fuel poverty rates are significantly higher in this sector; 49% of social renters are in fuel poverty compared with 22% of private renters.[19] This highlights a structural challenge: social renters often have lower incomes and face higher rates of vulnerability, making them more exposed to energy cost pressures despite living in more energy‑efficient homes.
Chart 3: Social renters generally rate the condition of their property as good, but less so for energy efficiency/cost to heat the property
Extent to which respondents rate their property condition as good.
Source: Consumer Scotland’s Social rented sector survey, C1. How would you rate the following aspects of the property? N = 1,402.
Variation by demographic characteristics
Patterns across these measures were broadly similar across groups of renters. Chart 4 shows the ‘overall condition of the property’ measure to illustrate this:
- Perceptions of property condition generally improve with age, but dips among renters aged 35-44.
- For some aspects, including overall property condition, perceptions also improve with income.
- Renters living in older unrenovated properties (over 10 years old and not recently renovated) are less positive about their home than those in newer homes or recently renovated properties.
- Renters without a known housing officer are less positive compared with those with one.[20]
Chart 4: Perceptions of property condition are particularly poorer among those living in older properties (over 10 years old) that have not been recently renovated
Percentage of respondents rating the overall condition of their property as ‘very good’ or ‘fairly good’, by demographics
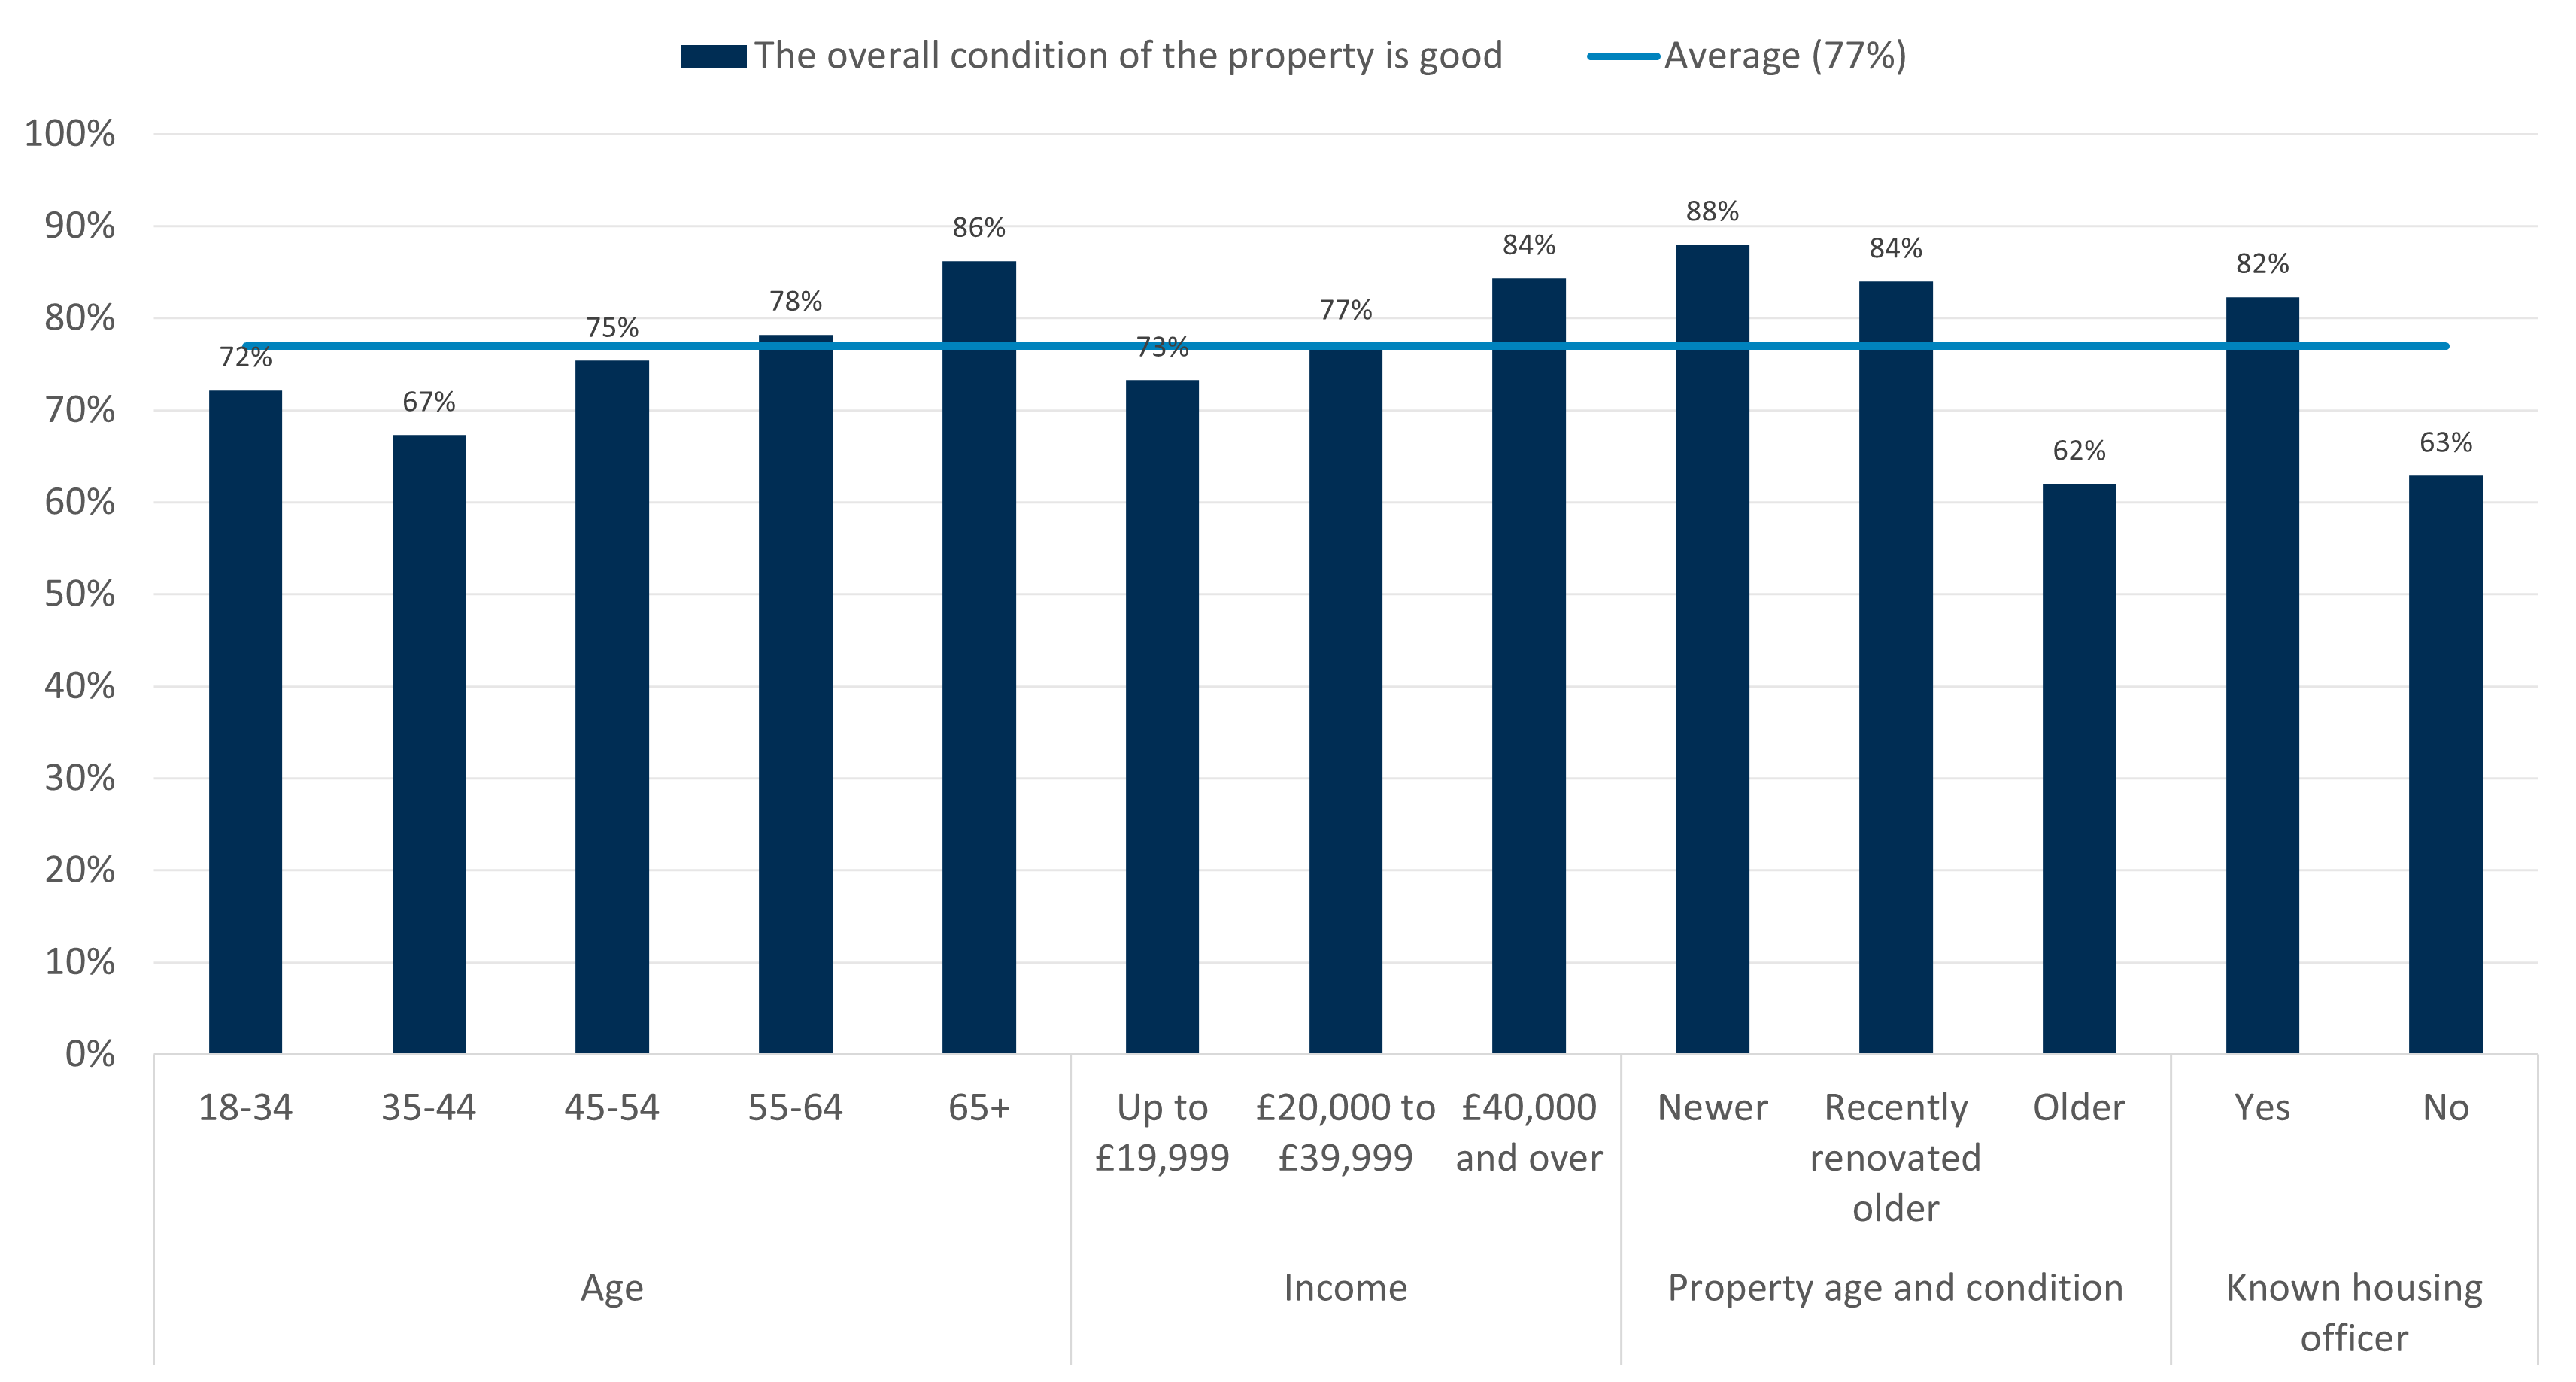
Source: Consumer Scotland’s Social rented sector survey, C1-1. How would you rate the following aspects of the property? The overall condition of the property. N = 1,402.
Energy efficiency/cost to heat the property is a particular concern across renters; it is consistently the poorest-rated aspect of property condition.
As with overall property condition, the same groups of renters give lower ratings on energy efficiency / cost to heat the property: renters aged 35-44; lower-income households; those living in older unrenovated properties; and those without a known housing officer (Chart 5).
However, there is an additional effect of disability or health condition status. Only 54% of those with a condition that limits their day-to-day activities ‘a little’ and 55% of those limited ‘a lot’ rate the energy efficiency / cost to heat the property as good, compared with 70% of those without. This discrepancy also appears consistently throughout other measures of property condition.
As with overall property condition, positive perceptions of energy efficiency / cost to heat the property are particularly low among renters living in older unrenovated properties (over 10 years old and not recently renovated); only 47% rate this aspect as good.
These findings suggest that properties may not always be fully meeting the needs of renters with greater mobility, accessibility, or health-related requirements. In addition, aspects of the fabric of older unrenovated properties may contribute to poorer energy efficiency, higher heating costs, and lower satisfaction among these renters.
Chart 5: Energy efficiency / cost to heat the property is a concern for renters, especially those living in older properties (over 10 years old) that have not been recently renovated
Percentage of respondents rating the energy efficiency / cost to heat the property as ‘very good’ or ‘fairly good’, by demographics
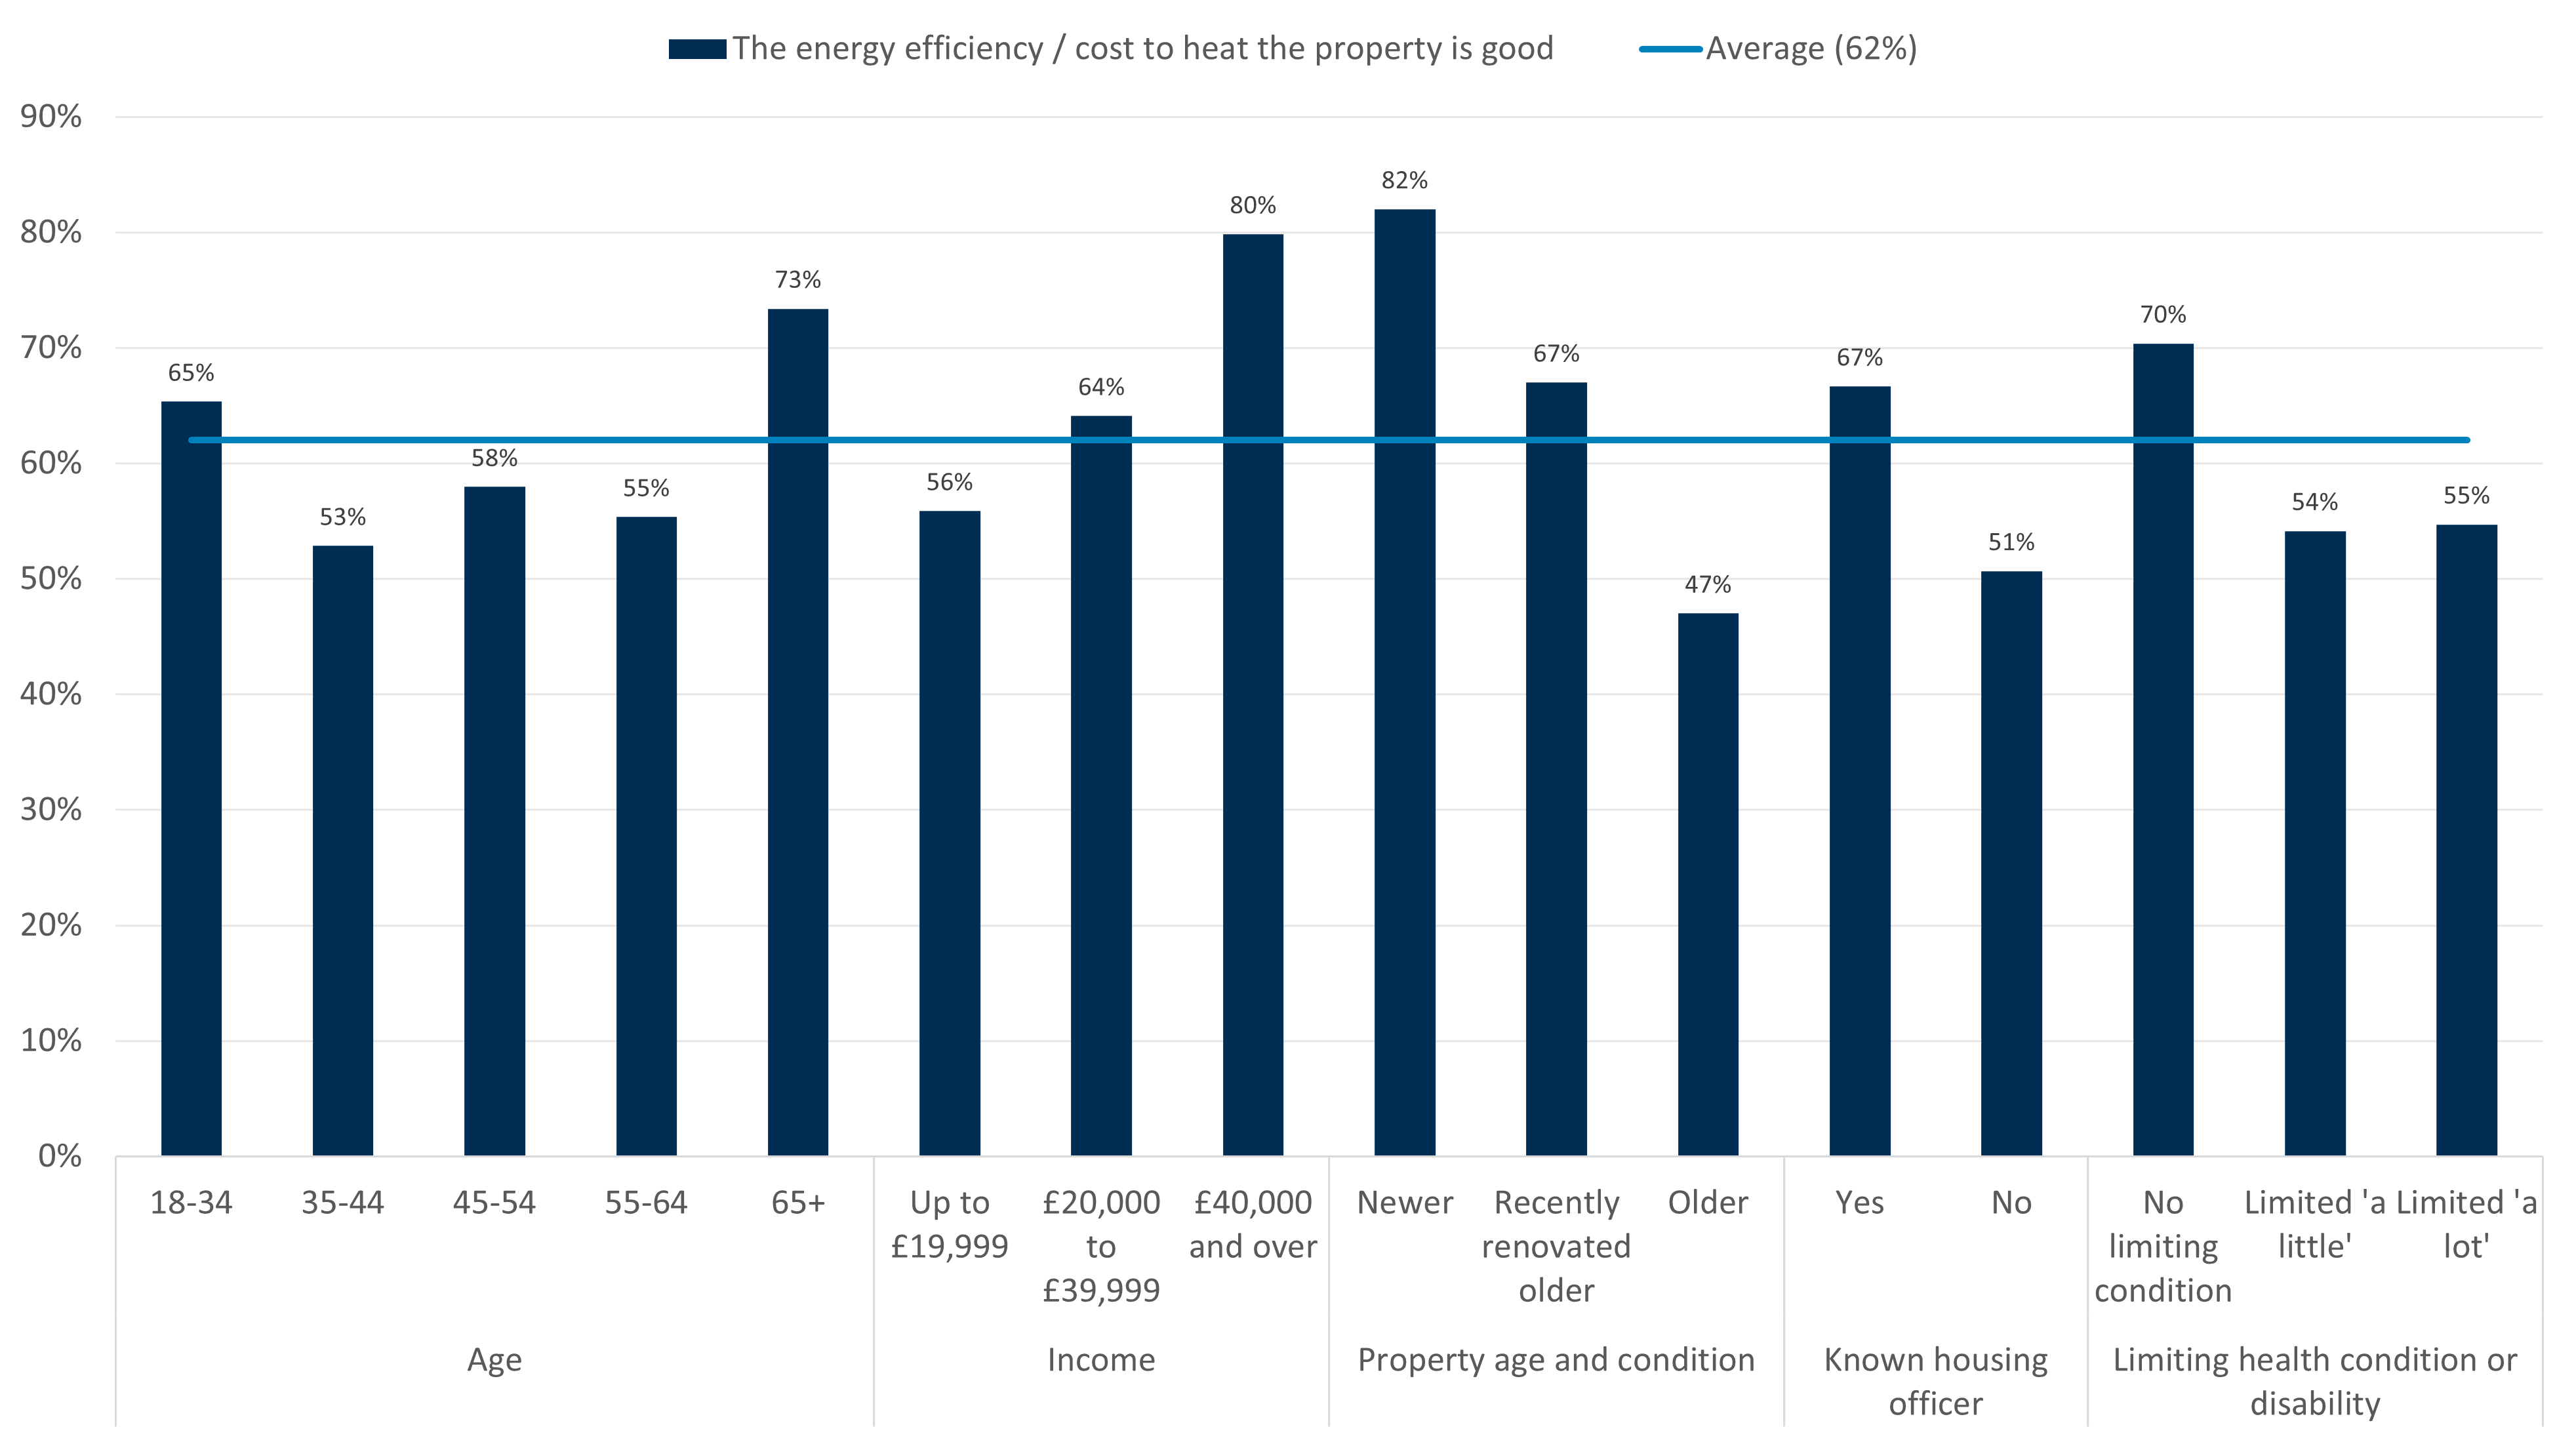
Source: Consumer Scotland’s Social rented sector survey, C1-4. How would you rate the following aspects of the property? The energy efficiency / cost to heat the property. N = 1,402.
Properties meeting renters’ needs
Most renters (86%) feel that their current property meets their needs well, including 44% who said it meets their needs ‘fully’. However, one in eight (13%) said their property meets their needs ‘not very well’, or ‘not at all’.
Variation by demographic characteristics
The characteristics of renters less likely to feel that their property meets their needs well mirror those associated with poorer perceptions of property condition (Chart 6):
- Renters who have disabilities or health conditions that limit their day-to-day activities ‘a little’ (85%) or ‘a lot’ (80%), compared with those without (90%)
- Renters aged 18-44 (78-81%), compared with those aged 65+ (95%)
- Renters living in older unrenovated properties (over 10 years old and not recently renovated, 81%), compared with those living in newer (91%) or recently renovated older properties (90%)
- Renters without a known housing officer (78%) compared with those with one (90%)
Chart 6: Most renters feel that their property meets their needs well, but this is lower for some groups of renters
Percentage of respondents rating their property as meeting their needs ‘fully’ or ‘fairly well’, by demographics
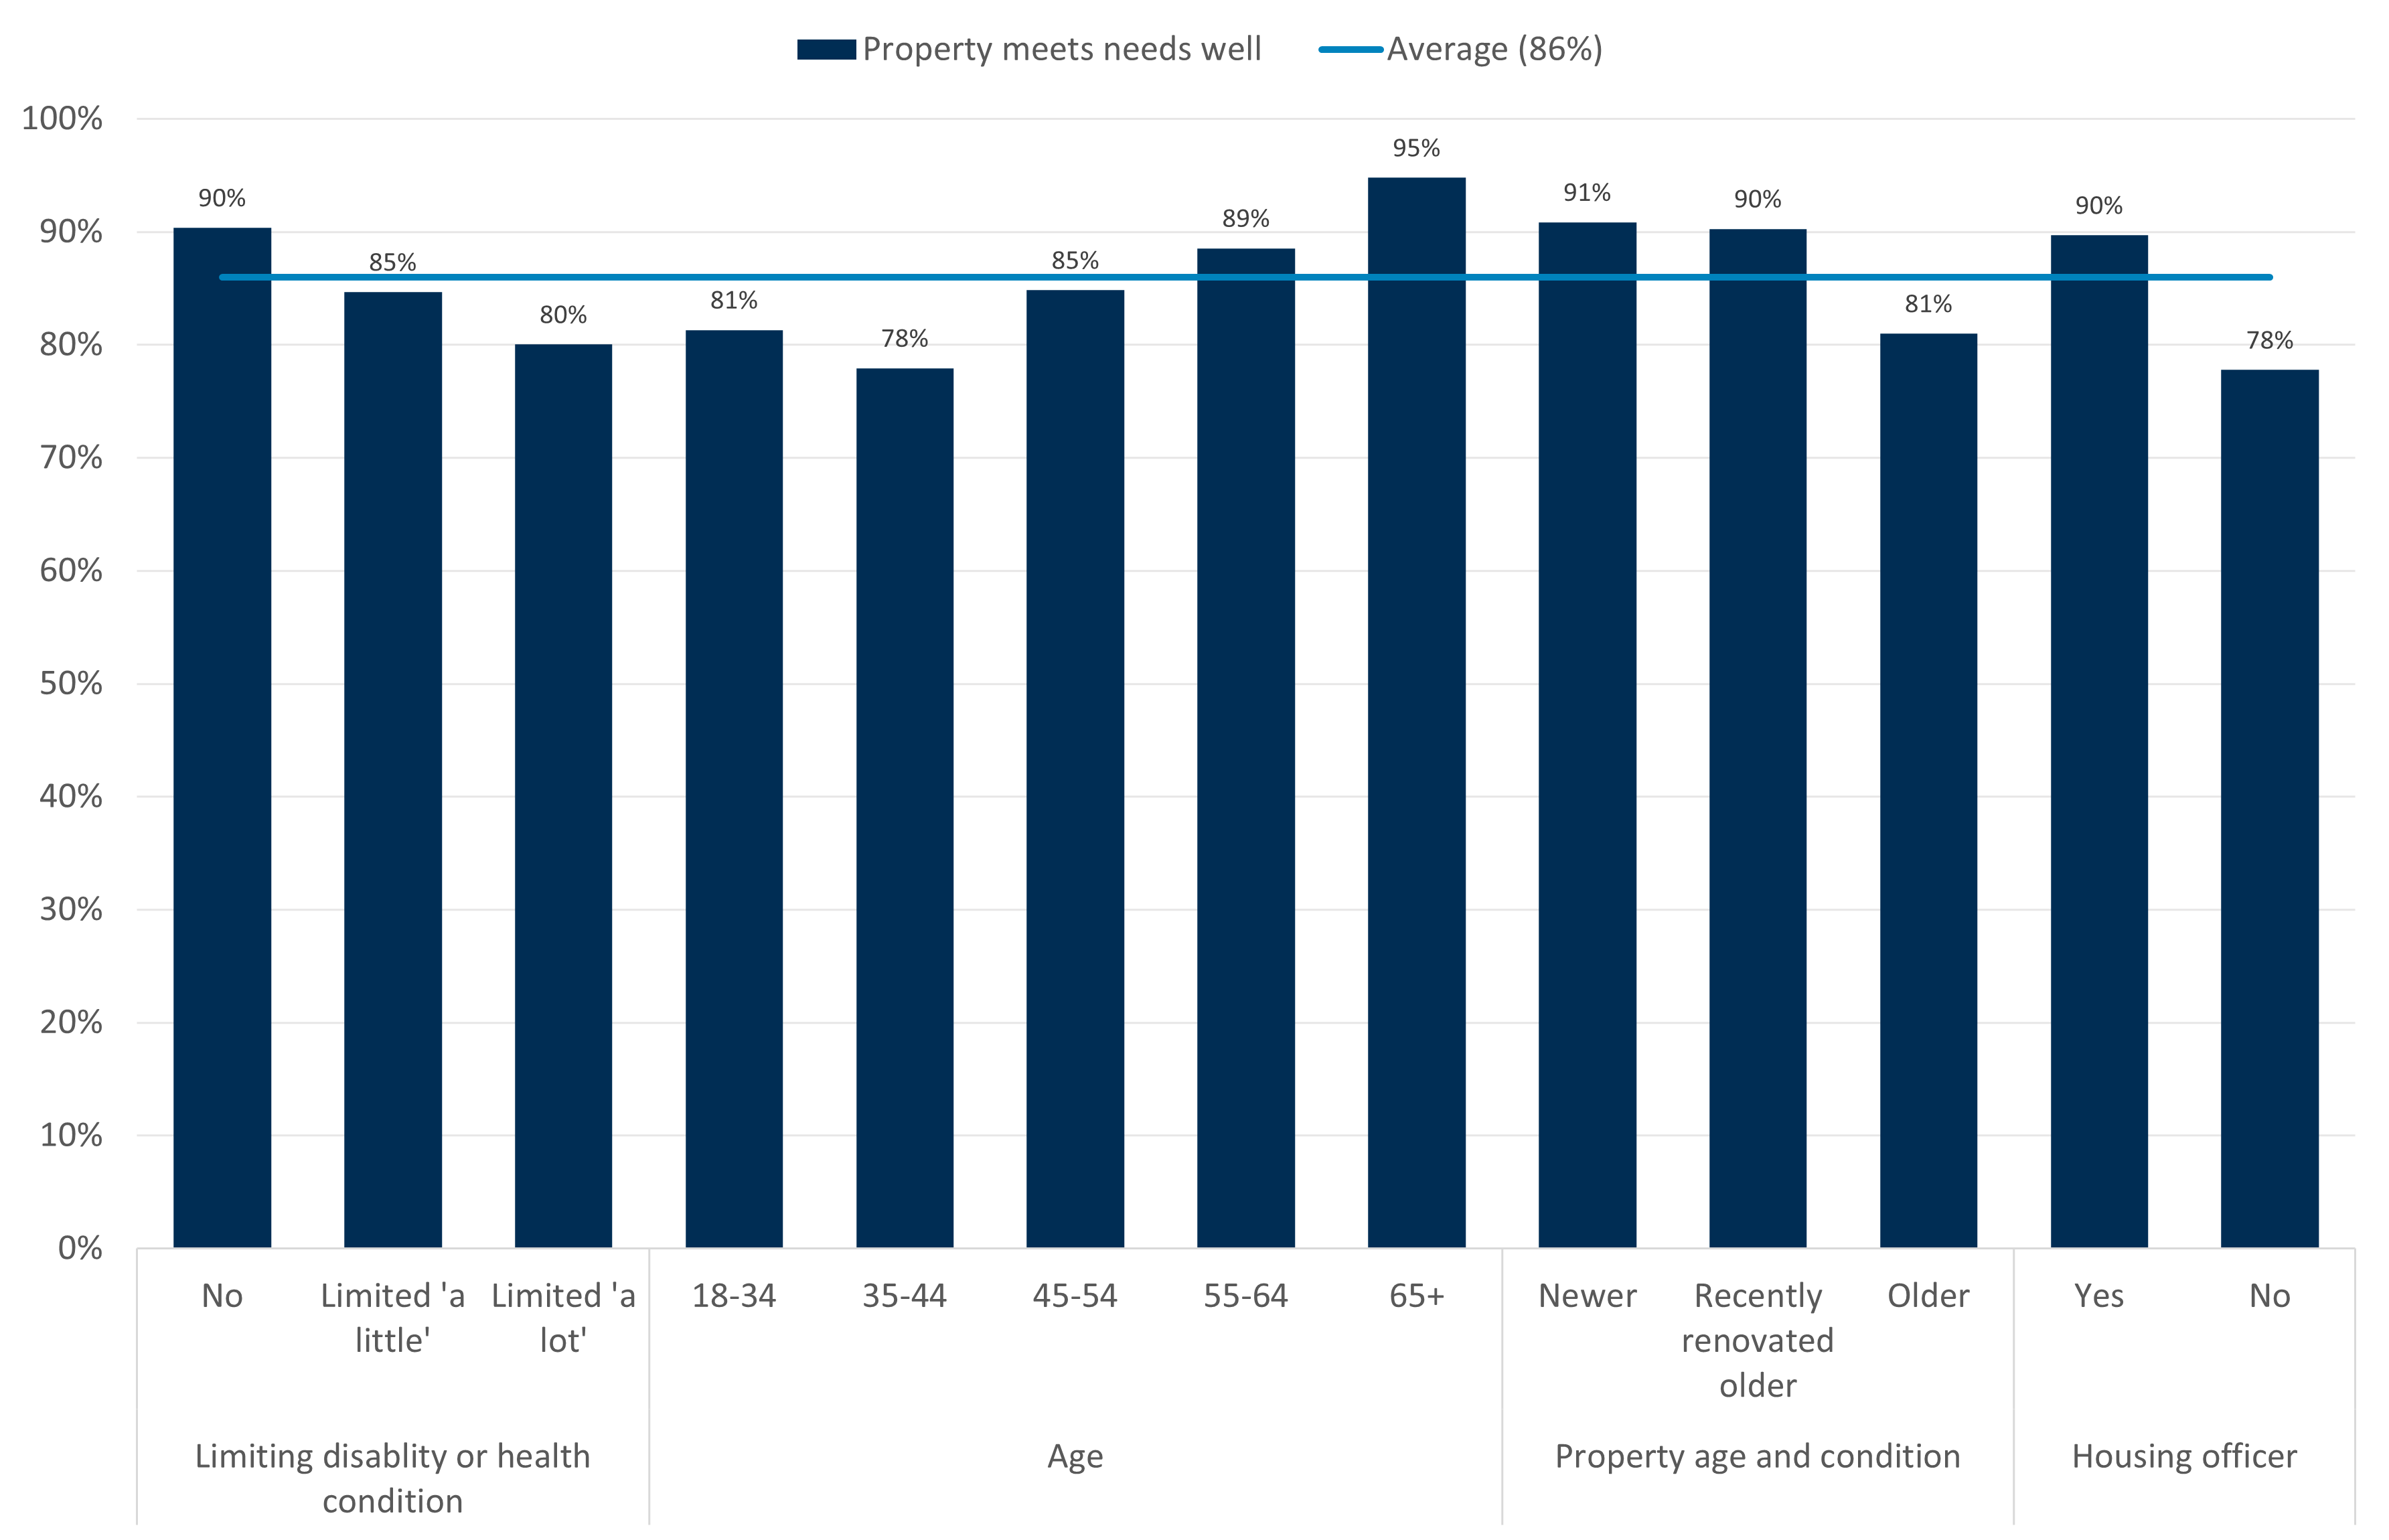
Source: Consumer Scotland’s Social rented sector survey, E4. How well does your current property meet your needs? N = 1,402
6. Experience of problems
This chapter examines whether renters have experienced problems with the condition of their home, and how well these were resolved. Just over half of renters encountered at least one condition-related problem with their home in the last six months. The most common are heating difficulties, unresolved repairs, and serious problems with damp or mould. Although most renters report these problems to their landlord, only a minority see them fully resolved. The chapter also covers why renters may not always report issues, and whether they self-manage repairs.
Problems with property condition
We asked respondents whether they had experienced any problems with the condition of their home in the last six months, to allow us to compare with data on the private rented sector.[21]
Over half (53%) of renters have experienced at least one problem with the condition of their home (Chart 7). The most frequent problems are:
- Difficulty keeping the home warm (16%)
- Repairs not carried out (15%)
- Serious problems with damp or mould (15%)
Other notable issues include plumbing or water leaks (14%); problems with outside doors, walls, roof, or windows (14%); and difficulty keeping the home cool (11%) (Chart 7).
Among those who had experienced a condition-related problem, over half (54%) reported having multiple issues.
Chart 7: Just over half of social renters had experienced a problem with the condition of their home in the last six months
Percentage of respondents who have experienced an issue with the condition of their home in the last six months
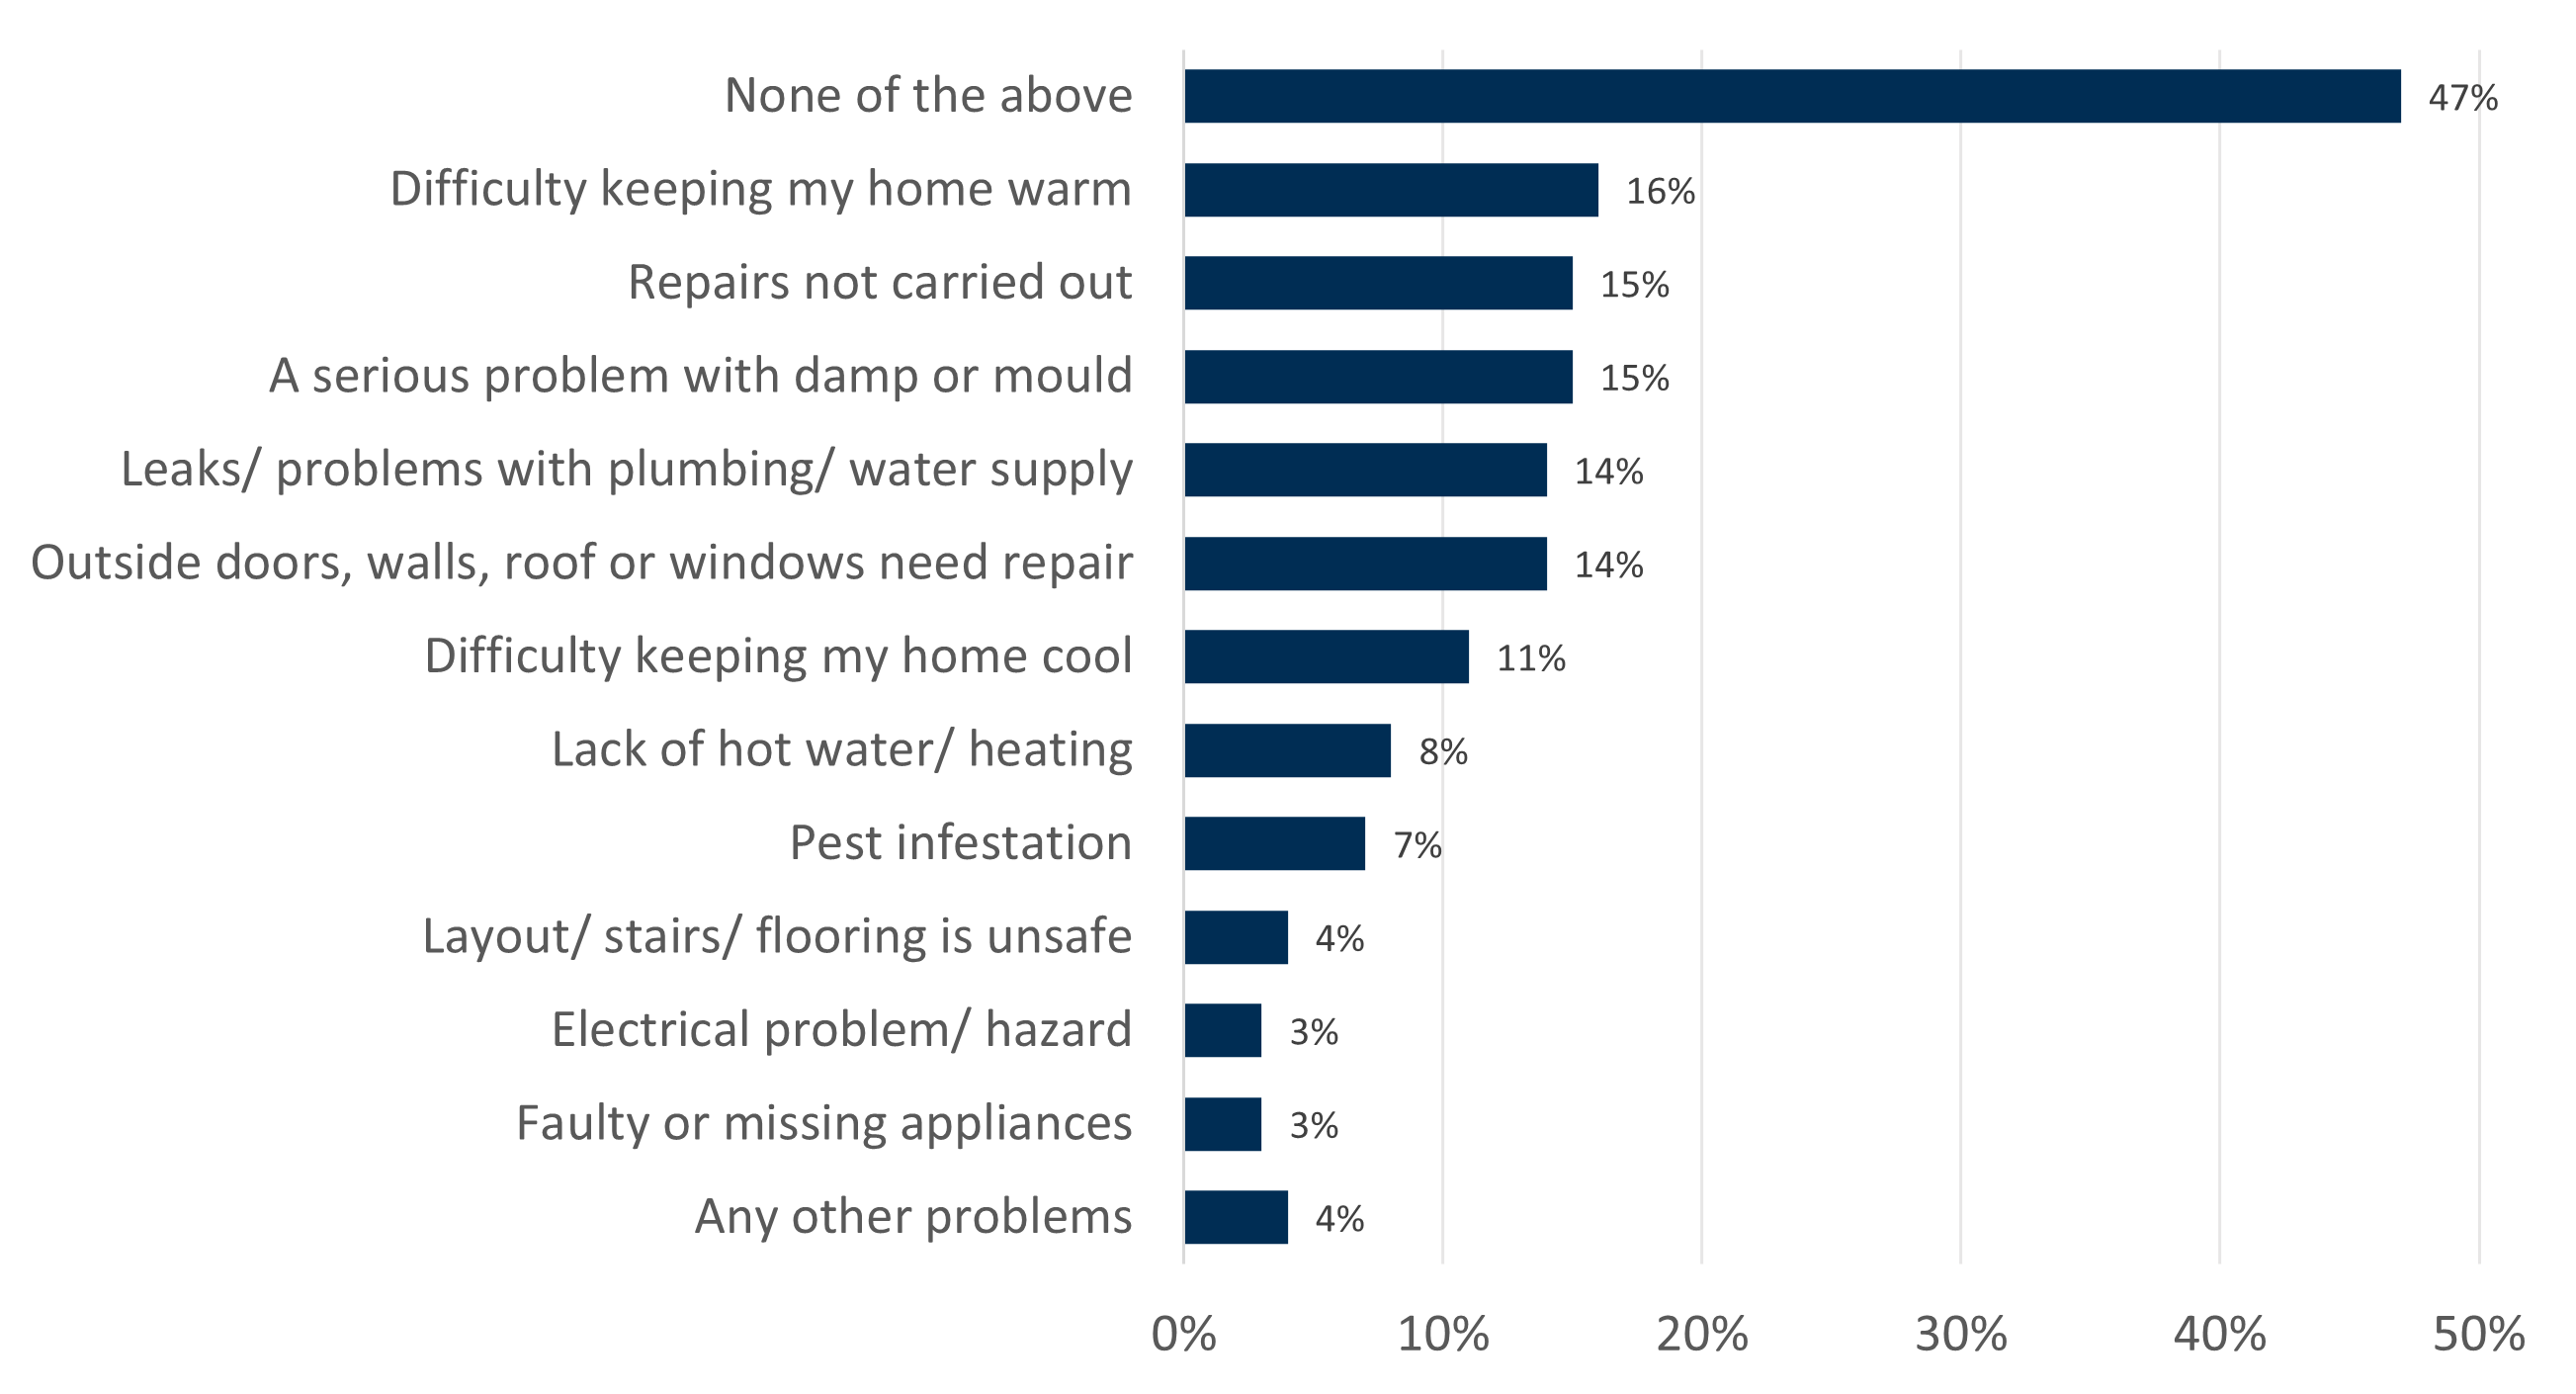
Source: Consumer Scotland’s Social rented sector survey, D1. In the last 6 months, have you experienced any problems with the condition of your home, for example a serious problem with damp or mould, lack of hot water or heating or pest infestation? A small number of respondents selected ‘No working smoke/ fire alarm or other fire hazard’. N = 1,402.
Variation by demographic characteristics
Certain groups of renters are more likely to have experienced a problem with the condition of their home in the last six months (Chart 8):
- Renters who have disabilities or health conditions that limit their day-to-day activities ‘a little’ (57%) or ‘a lot’ (59%), compared with those without (49%)
- Renters aged 18-44 (65-70%), compared with 65+ (35%)
- Renters from non-white British backgrounds (72%) compared with white British renters (52%)
- Renters living in older unrenovated properties (over 10 years old and not recently renovated, 65%), compared with those living in newer (52%) or recently renovated older properties (46%)
- Renters without a known housing officer (66%) compared with those with one (47%)
- Renters living in flats (55%) compared with houses (50%)
Chart 8: Renters aged 35-44 are particularly more likely to have experienced a problem with the condition of their home in the last six months
Percentage of respondents who experienced a problem with the condition of their home in the last six month, by demographics.
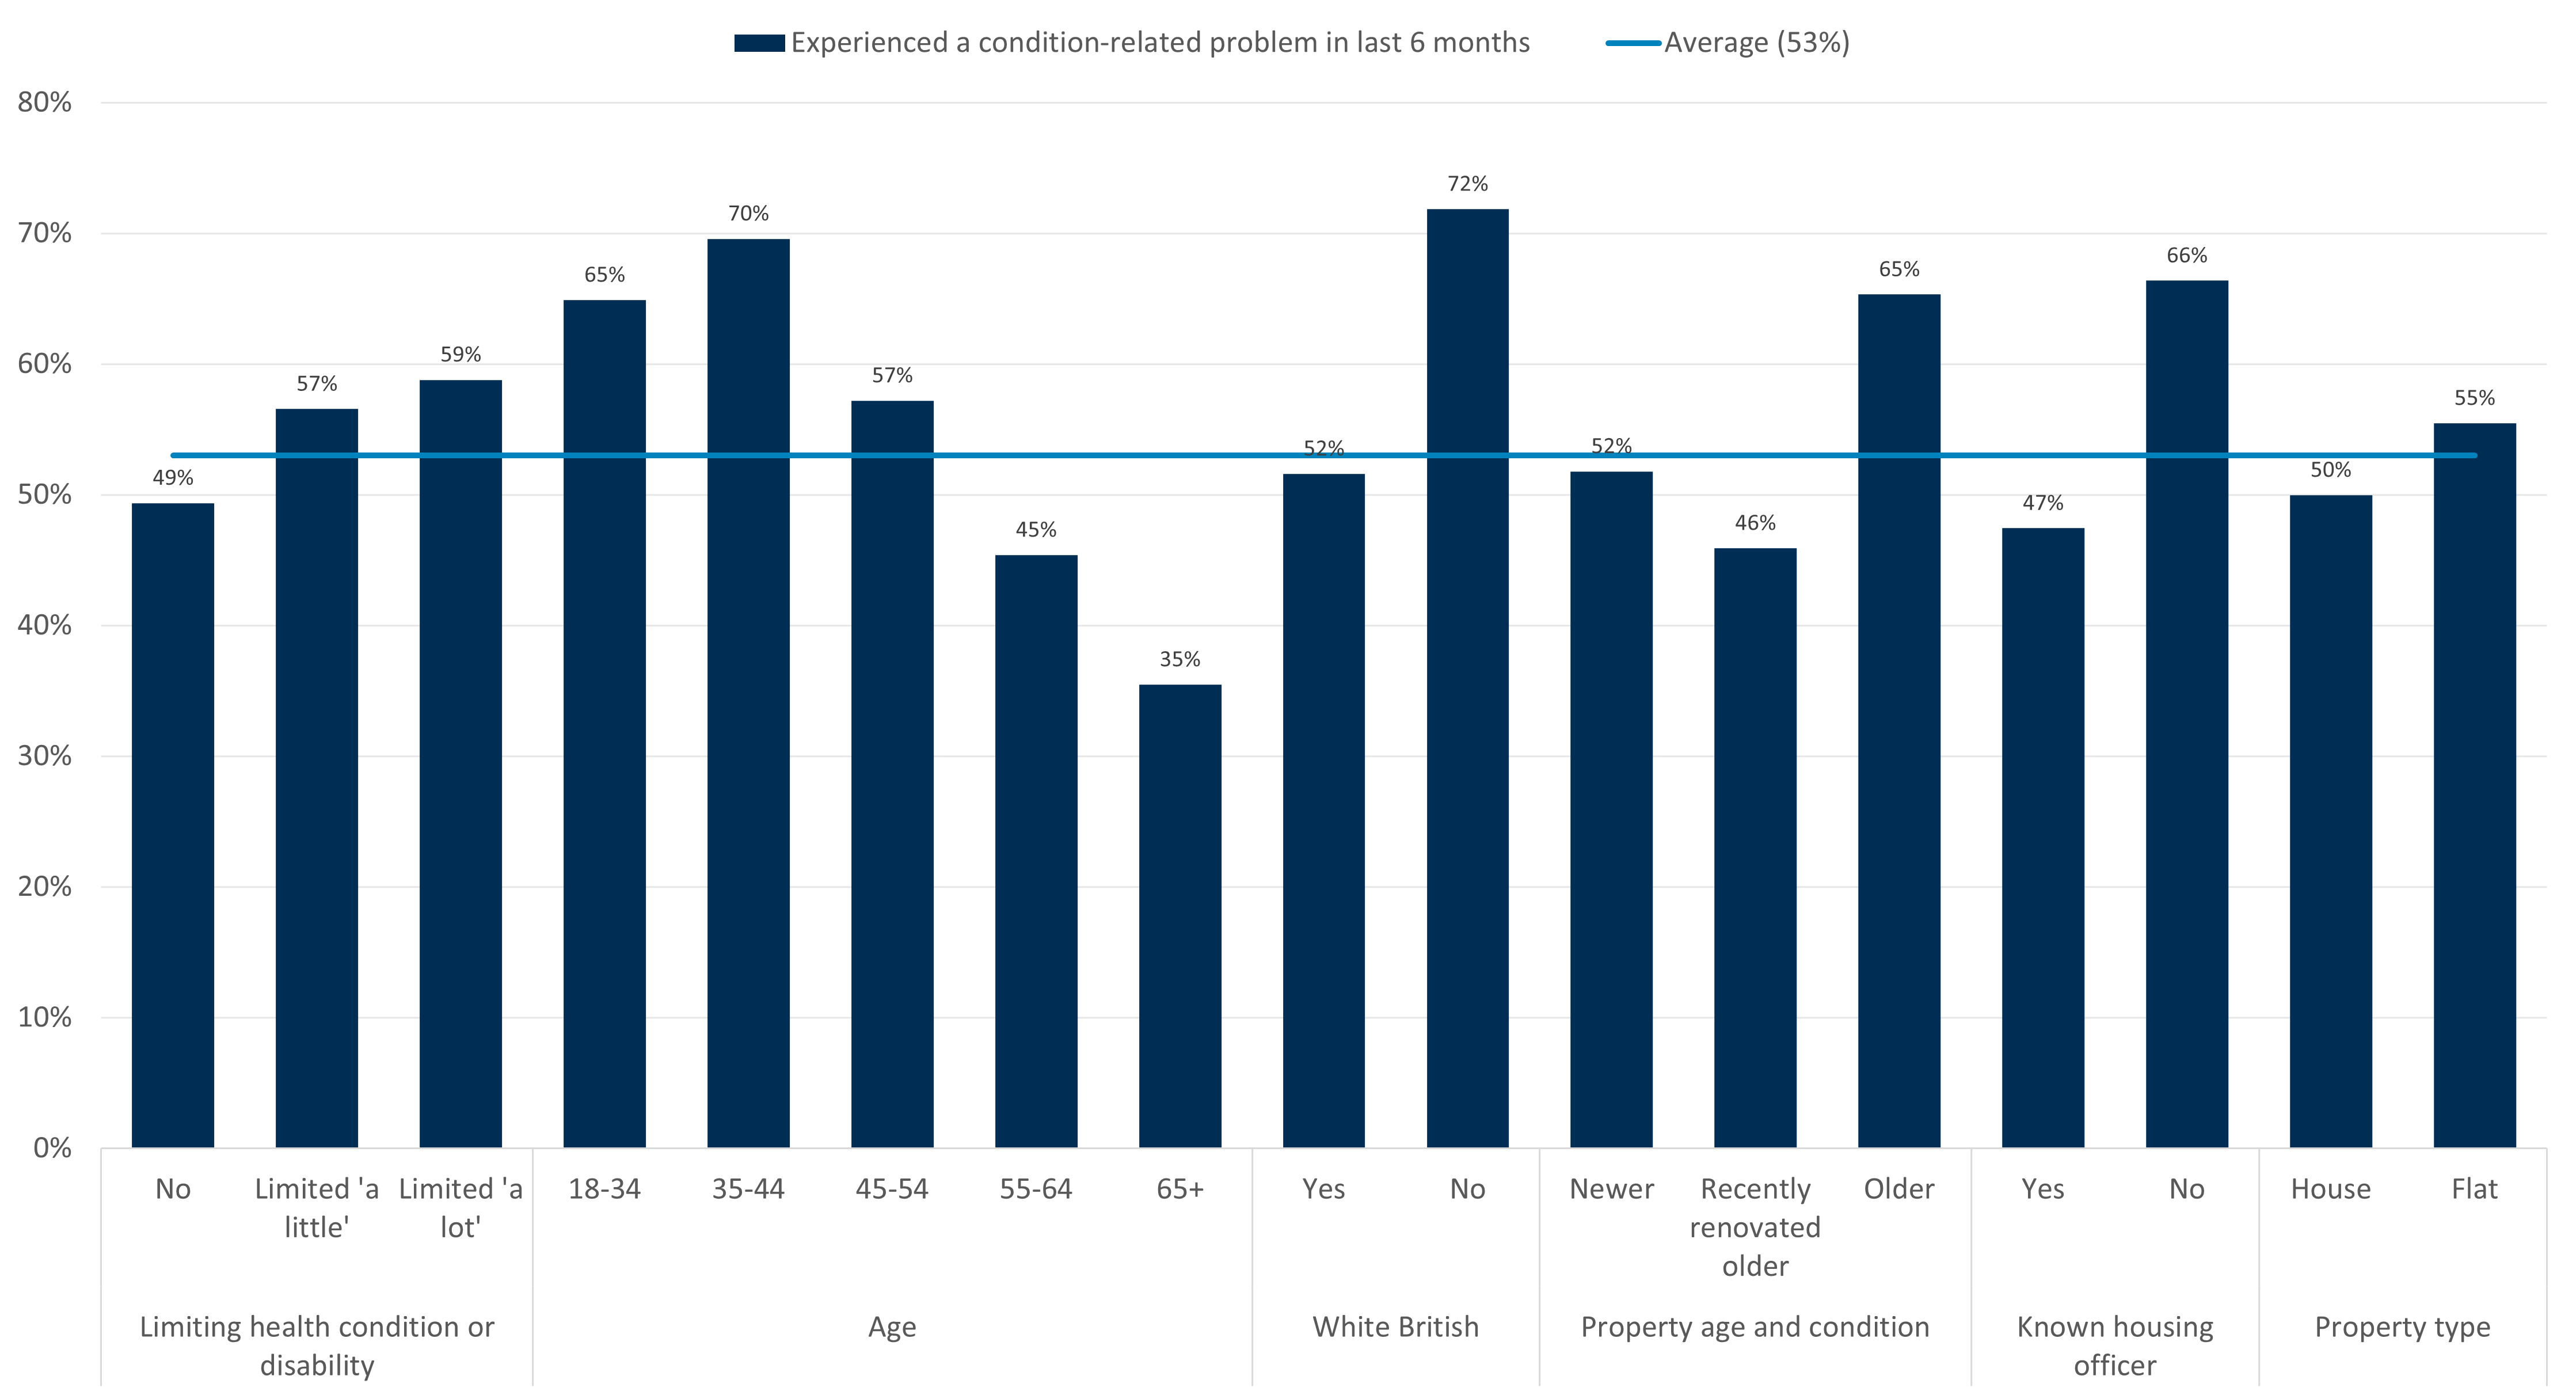
Source: Consumer Scotland’s Social rented sector survey
Renter journeys following a property condition problem
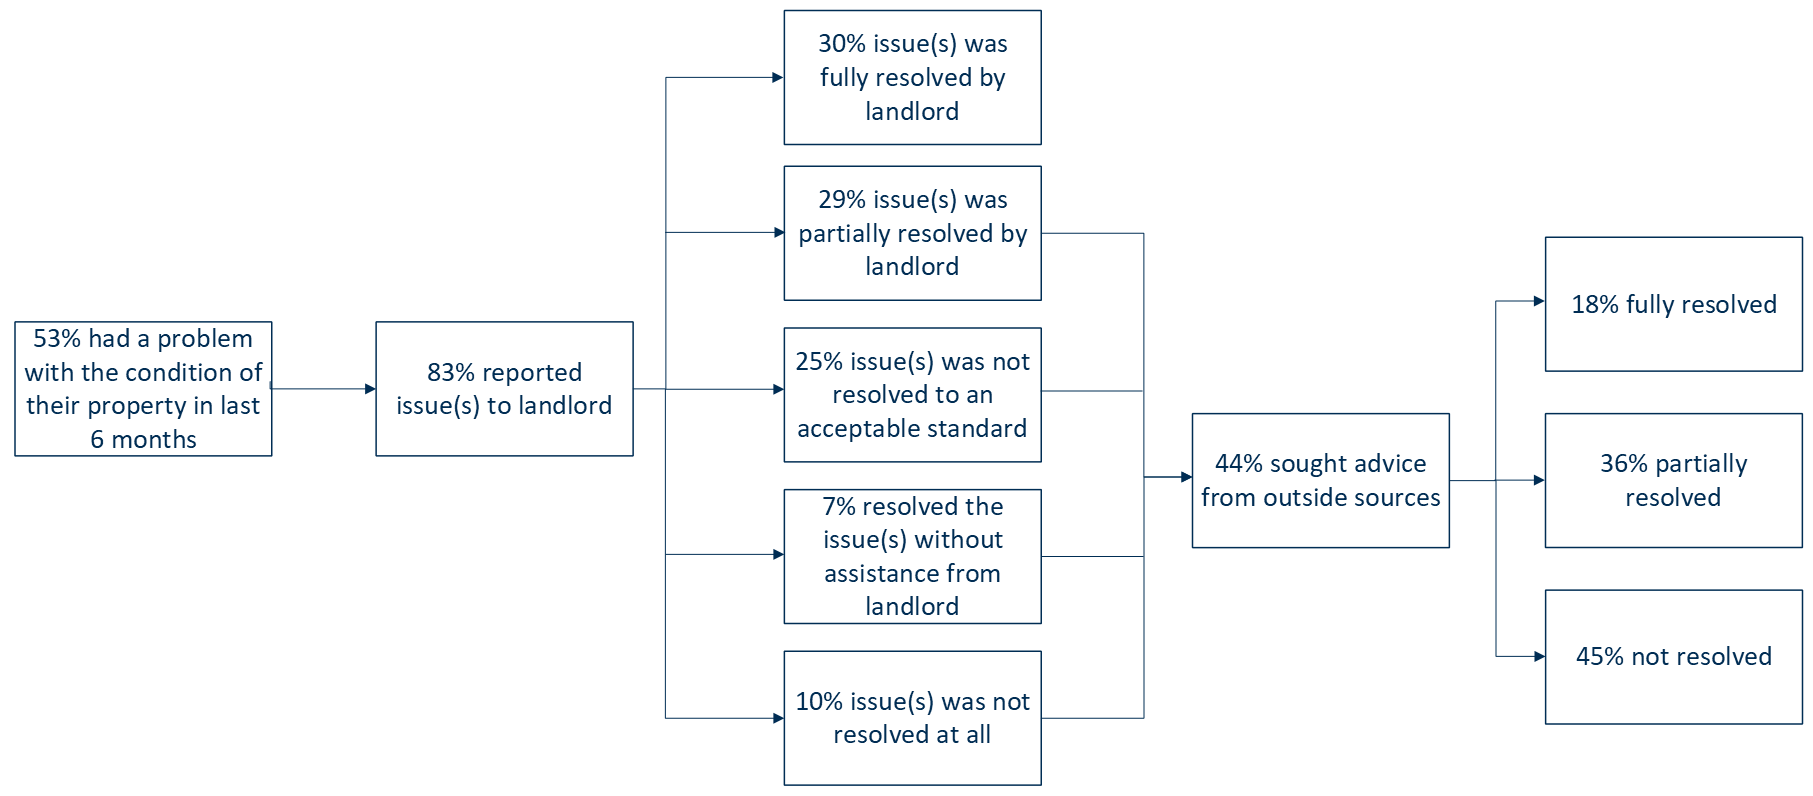
Most social renters who experienced one of these problems reported it to their landlord (83%), but only 30% of these renters felt that it had subsequently been fully resolved.
Of those whose issue was not fully resolved, only 43% sought help or advice from other sources, of which 18% had their issue fully resolved after doing so (Chart 9).
Chart 9: Only 30% of social renters feel that their issue was fully resolved by their landlord
Percentage of respondents reporting having a problem with the condition of their home, whether it was reported, and whether it was resolved.
Source: Consumer Scotland’s Social rented sector survey
Less than half (44%) of respondents sought external advice or support regarding their unresolved condition-related problem (Chart 10). The most common source of advice was friends or family (20%), followed by contacting a local Councillor, MSP, or MP (17%). Smaller proportions sought help from other channels, such as the Citizens Advice Bureau or similar bodies and renter representatives or advocacy groups.
When excluding those who only sought advice from informal channels (friends or family), the percentage of people who sought advice falls to 33%. This suggests that renters tend to handle issues independently or rely on informal networks rather than formal support channels.
Chart 10: Half of renters did not seek external advice or support about their unresolved problem
Percentage of respondents who sought external advice to help with the unresolved issue or complaint
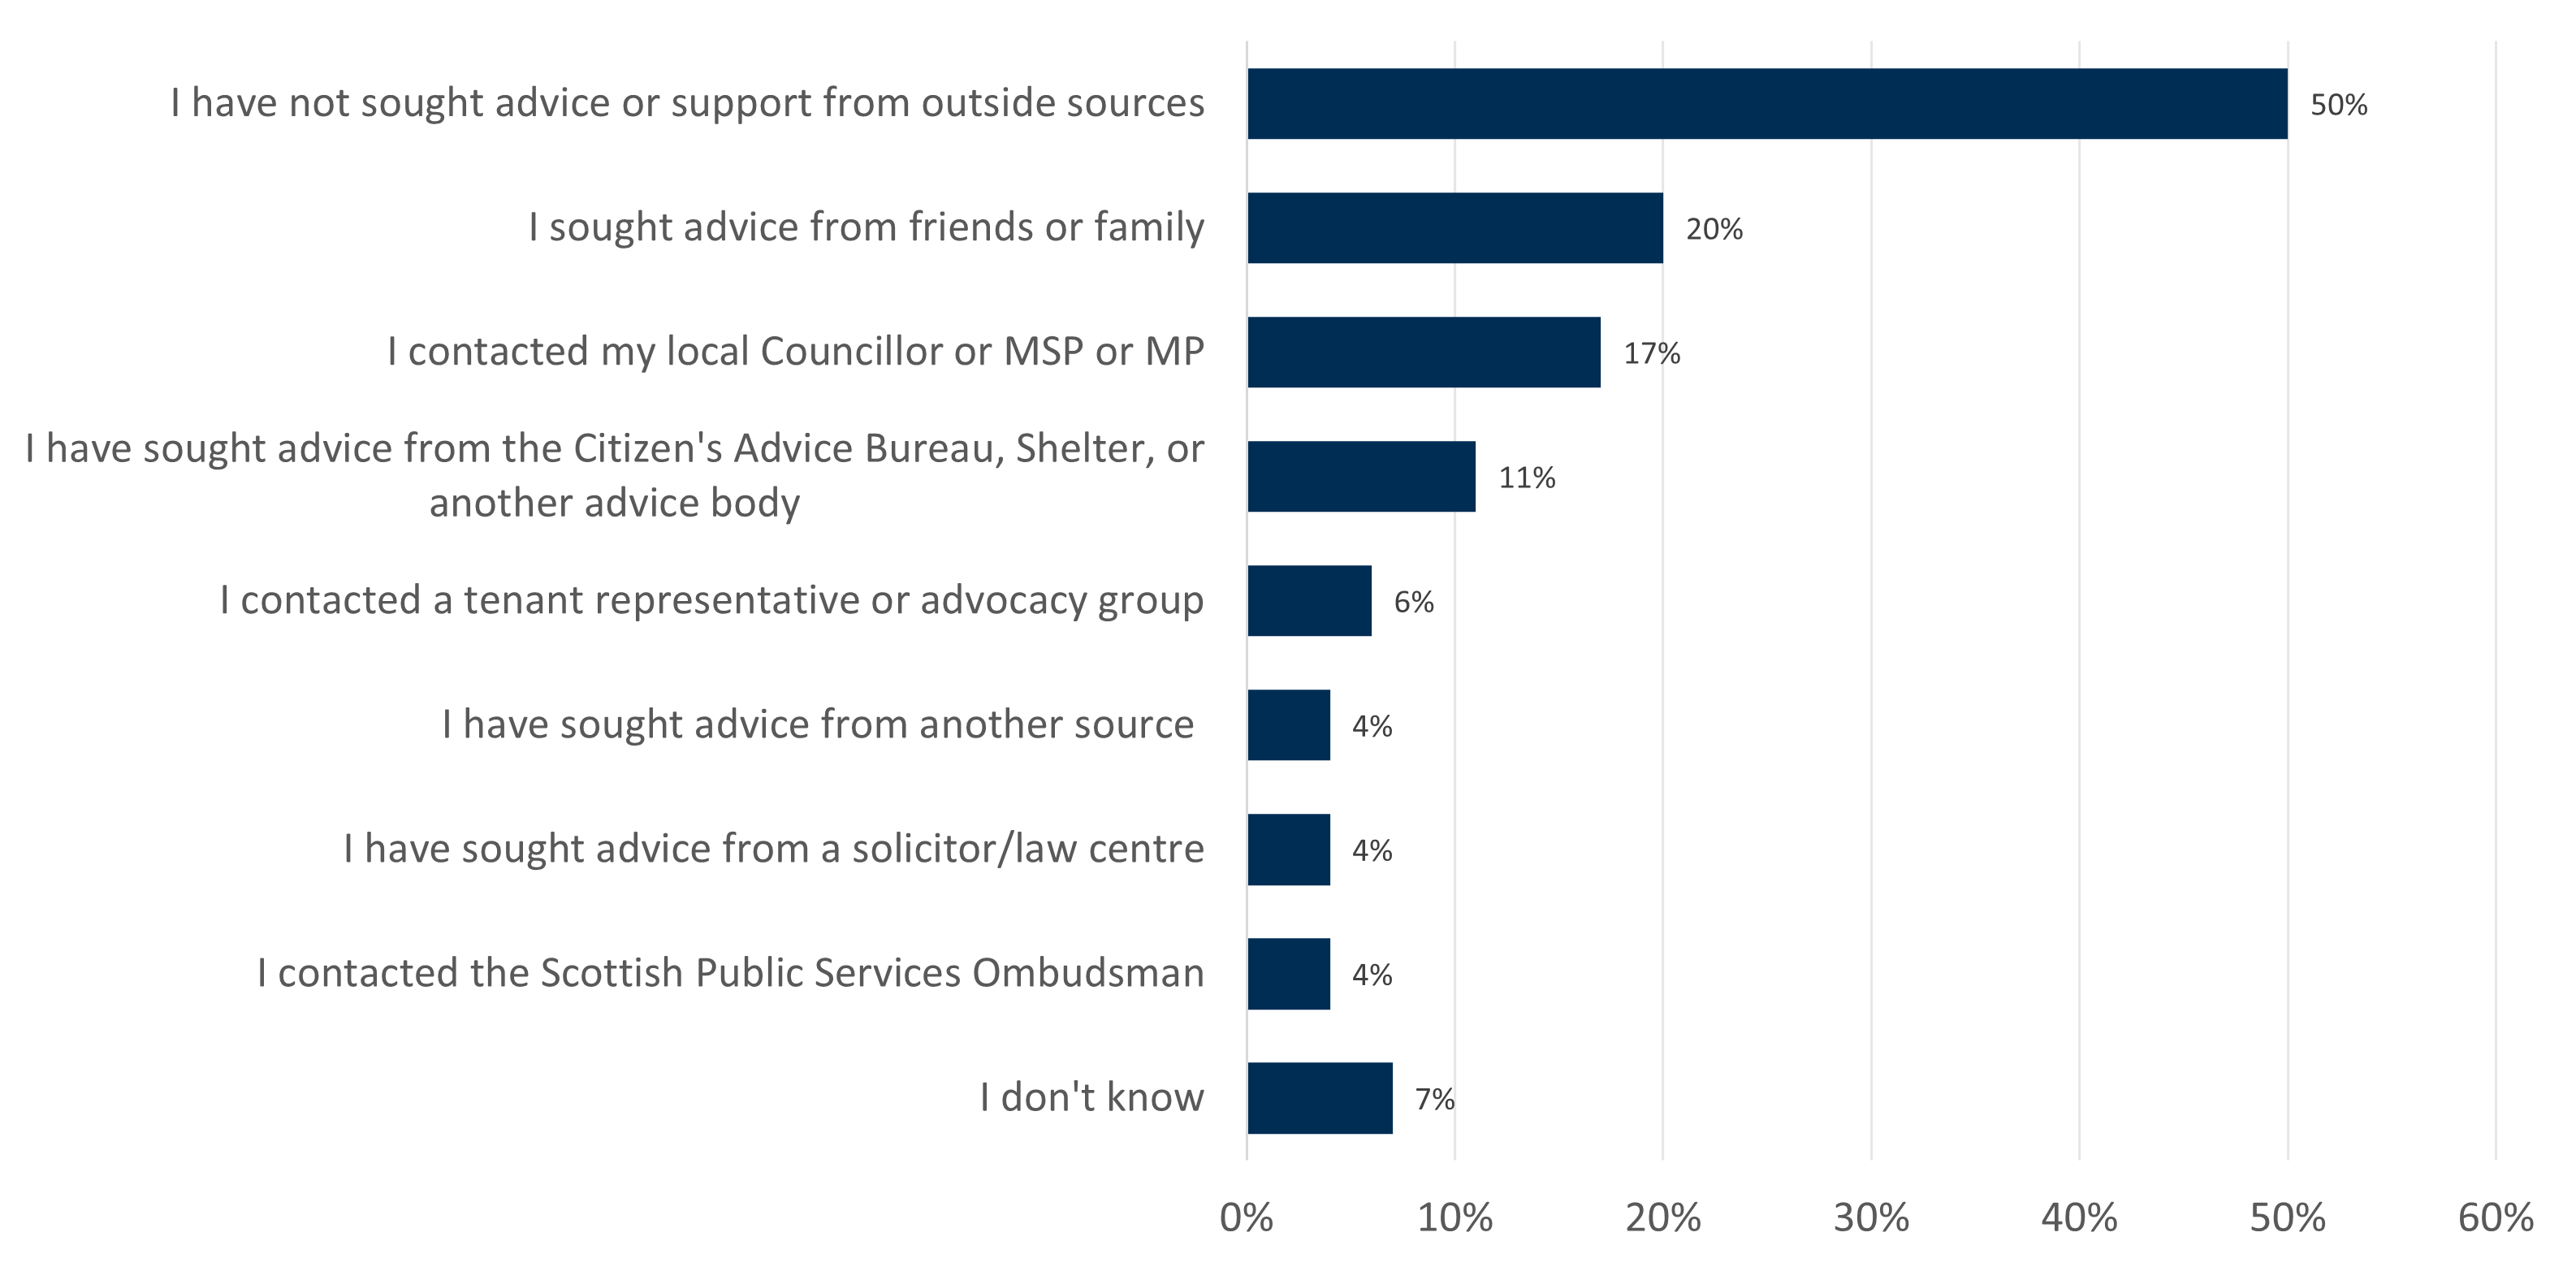
Source: Consumer Scotland’s Social rented sector survey, D5. Did you seek advice or support from sources to help with the issue or complaint? N = 441.
Renters not reporting issues
The previous section focused on behaviours when a renter experienced a specific problem relating to property condition in the previous six months. We were also keen to explore more widely whether there were circumstances in which they did not or would not report to their landlord.
Most renters (59%) say they always report issues, but a substantial minority indicated that there are certain circumstances in which they would choose not to (Chart 11). Because respondents could select multiple reasons, some who say they “always report” also identified situations where they might not.
The most common reasons for not reporting were:
- Deciding to fix the problem themselves (19%)
- Feeling the issue is not serious or urgent enough to report (15%)
- Not thinking that anything would be done about it (12%)
Smaller proportions do not report issues because they find the process too much hassle (5%), they want to be seen as a ‘good tenant’ (5%), or do not want to bother a landlord with whom they have a good relationship (4%). Only 3% say they worry their landlord might ask them to leave if they raise an issue.
This is quite different to the private sector, in which a quarter of renters do not report issues because they want to be seen as a ‘good tenant’ (26%) and are worried that the landlord might ask them to leave (24%, Voice of the Tenant survey); suggesting that there are lower levels of concern about retaliatory eviction in the social rented sector.
Chart 11: While most renters predict they would always report problems to their landlord, the most common reason for not doing so deciding to fix the problem themselves
Percentage of respondents who always report issues to their landlord, and the reasons for them not reporting
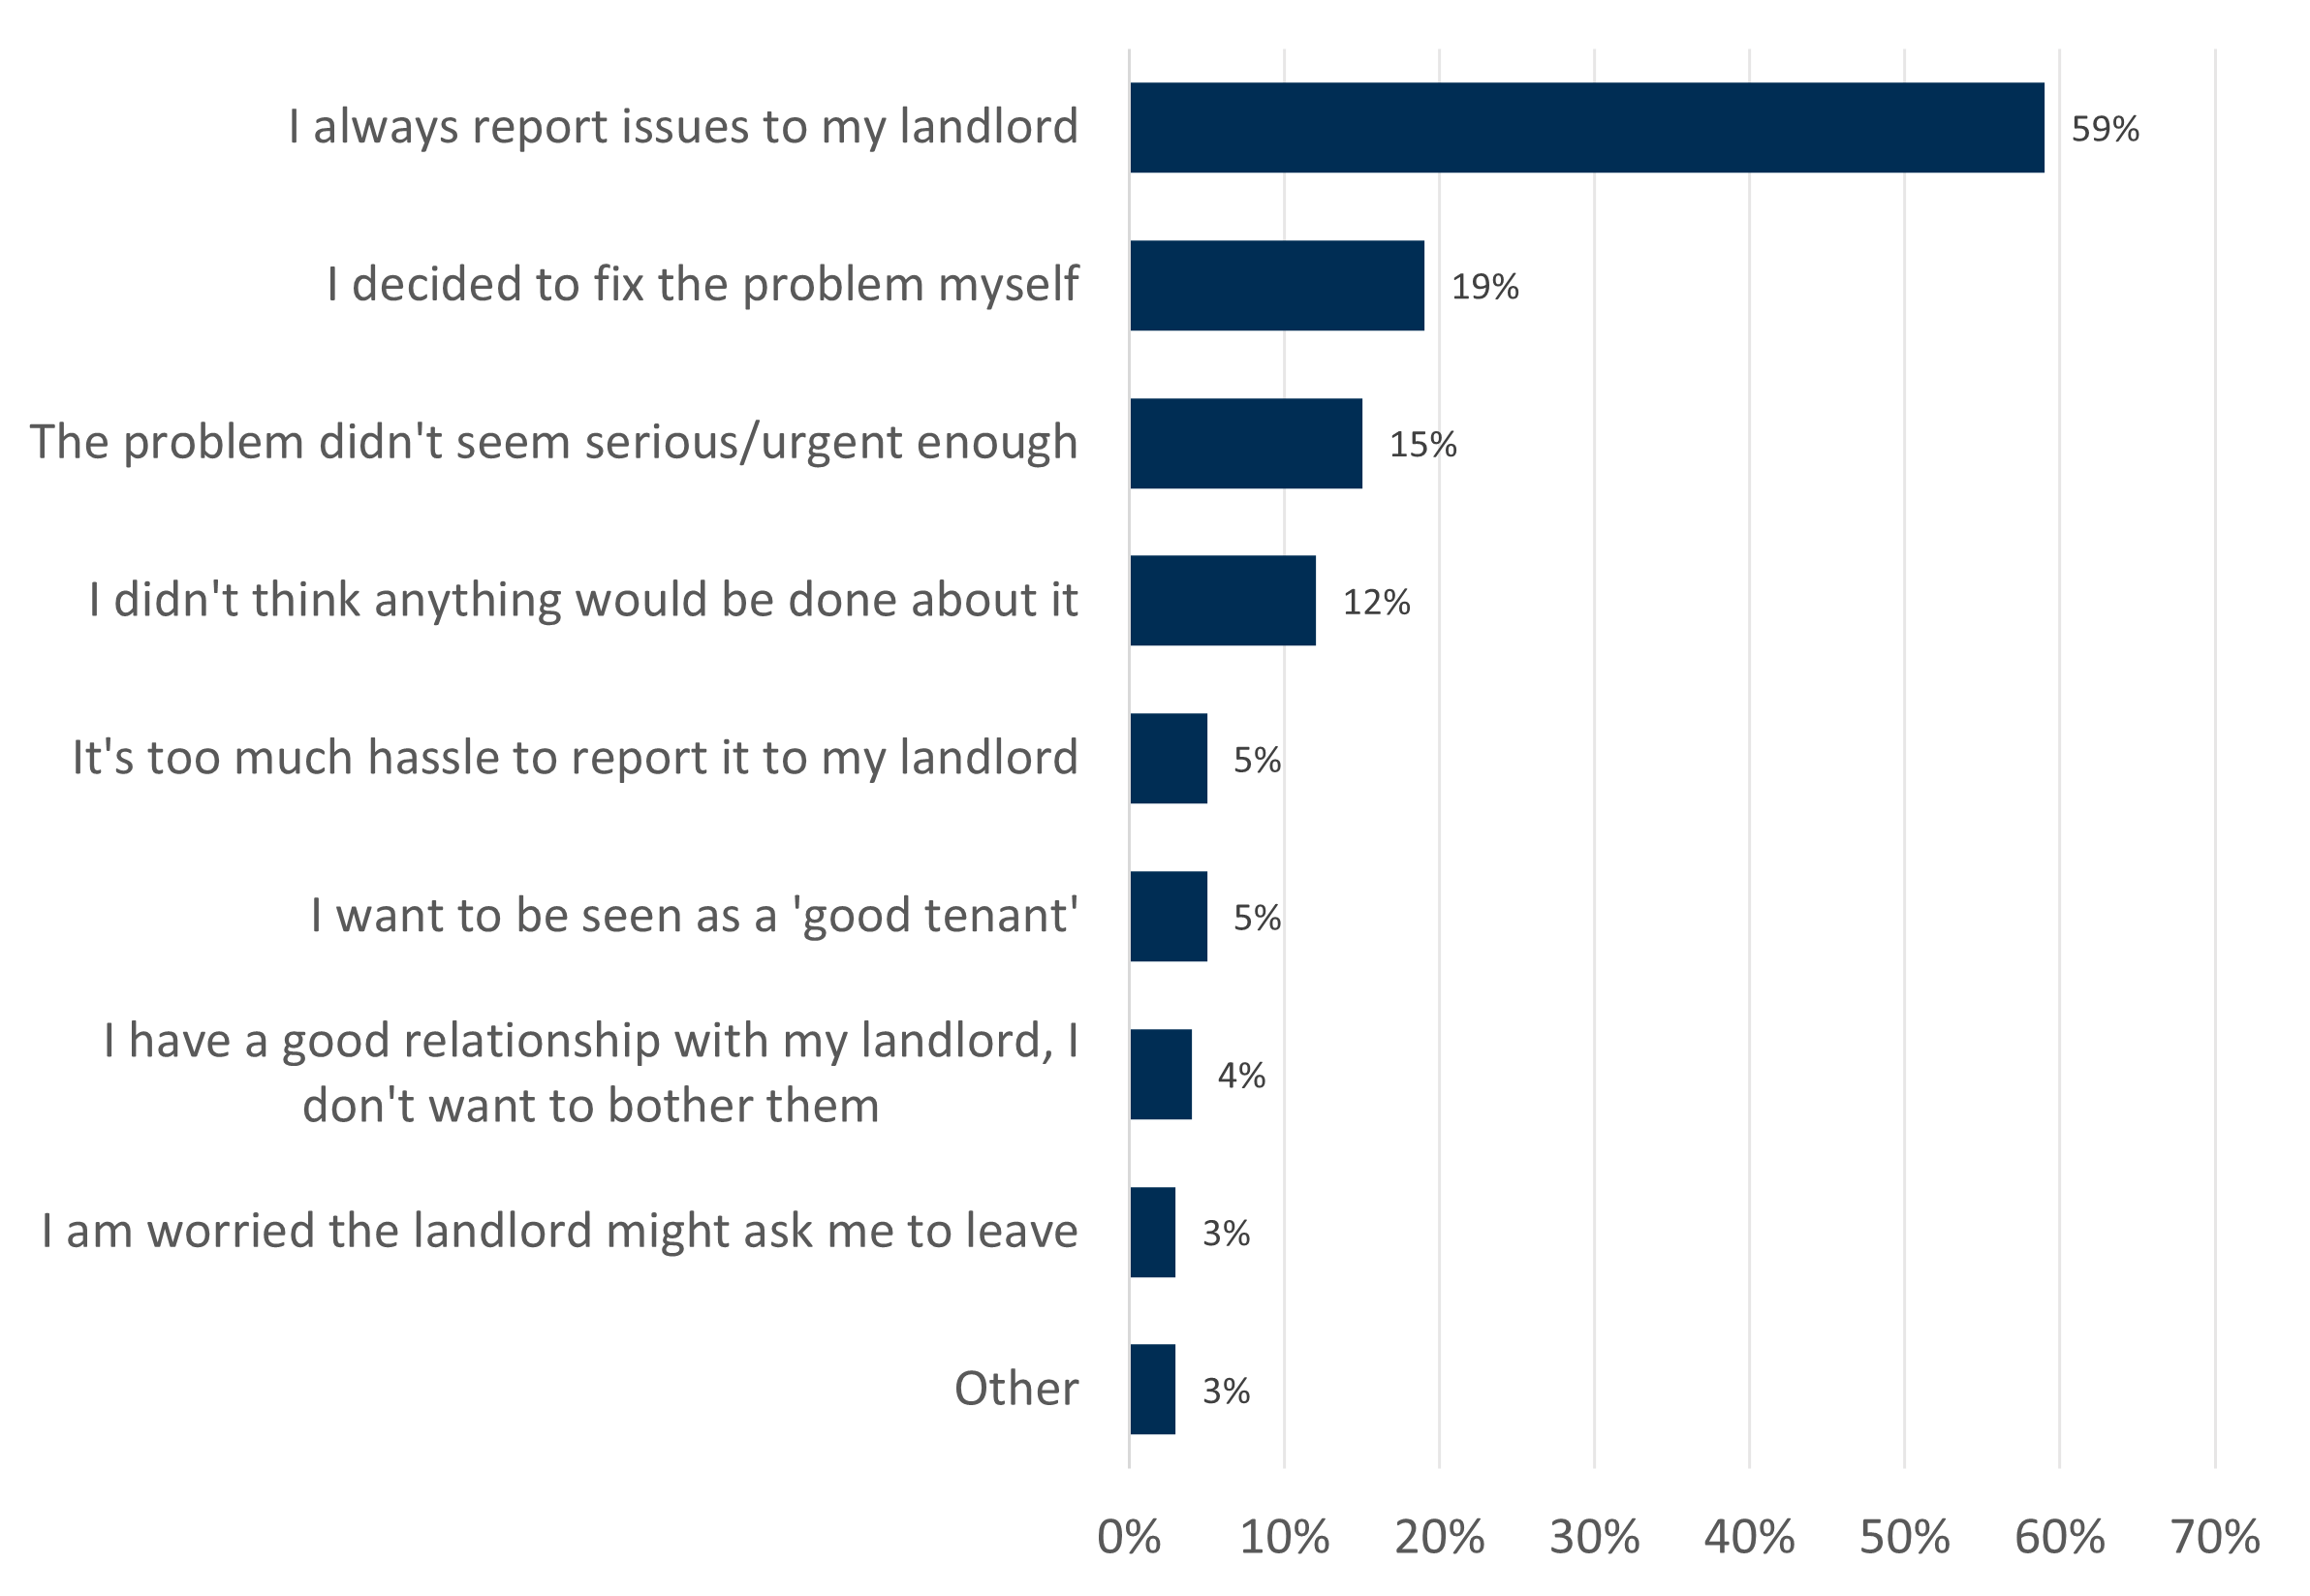
Source: Consumer Scotland’s Social rented sector survey, D7. Are there certain issues that you did not or would not report to your landlord? If so what were your reasons? N = 1,402. Respondents could choose more than one response option, to totals may not sum to 100%.
Renters self-managing issues
We also asked renters if they had ever paid for or repaired something themselves that they believed should have been covered by their landlord. Over a quarter (28%) of renters reported that they had done this at some point.
As the question does not specify when renters have done this, we do not know whether they undertook this work before contacting their landlord, or after reporting the issue but not receiving a satisfactory response. Nor do we know the types of issues they are choosing to resolve themselves.
Variation by demographic characteristics
The groups most likely to self-manage repairs differ slightly from those highlighted in earlier sections (Chart 12). Renters who are most likely to self-manage are:
Renters aged 18-54 (33-35%), compared with those aged 65+ (18%)
Renters from non-white British backgrounds (40%) compared with white British renters (27%)
Higher-income households (over £40,000) are more likely to manage repairs themselves (37%), compared with lower-incomes (up to £19,999, 25%), likely due to fewer resources to fund repairs out-of-pocket
Renters living in older unrenovated properties (over 10 years old and not recently renovated, 37%), compared with those in newer properties (24%)
Chart 12: A third of renters aged 18-54 had self-managed a repair
Percentage of respondents who had paid for or repaired something themselves that they believe should have been covered by the landlord, by demographics.
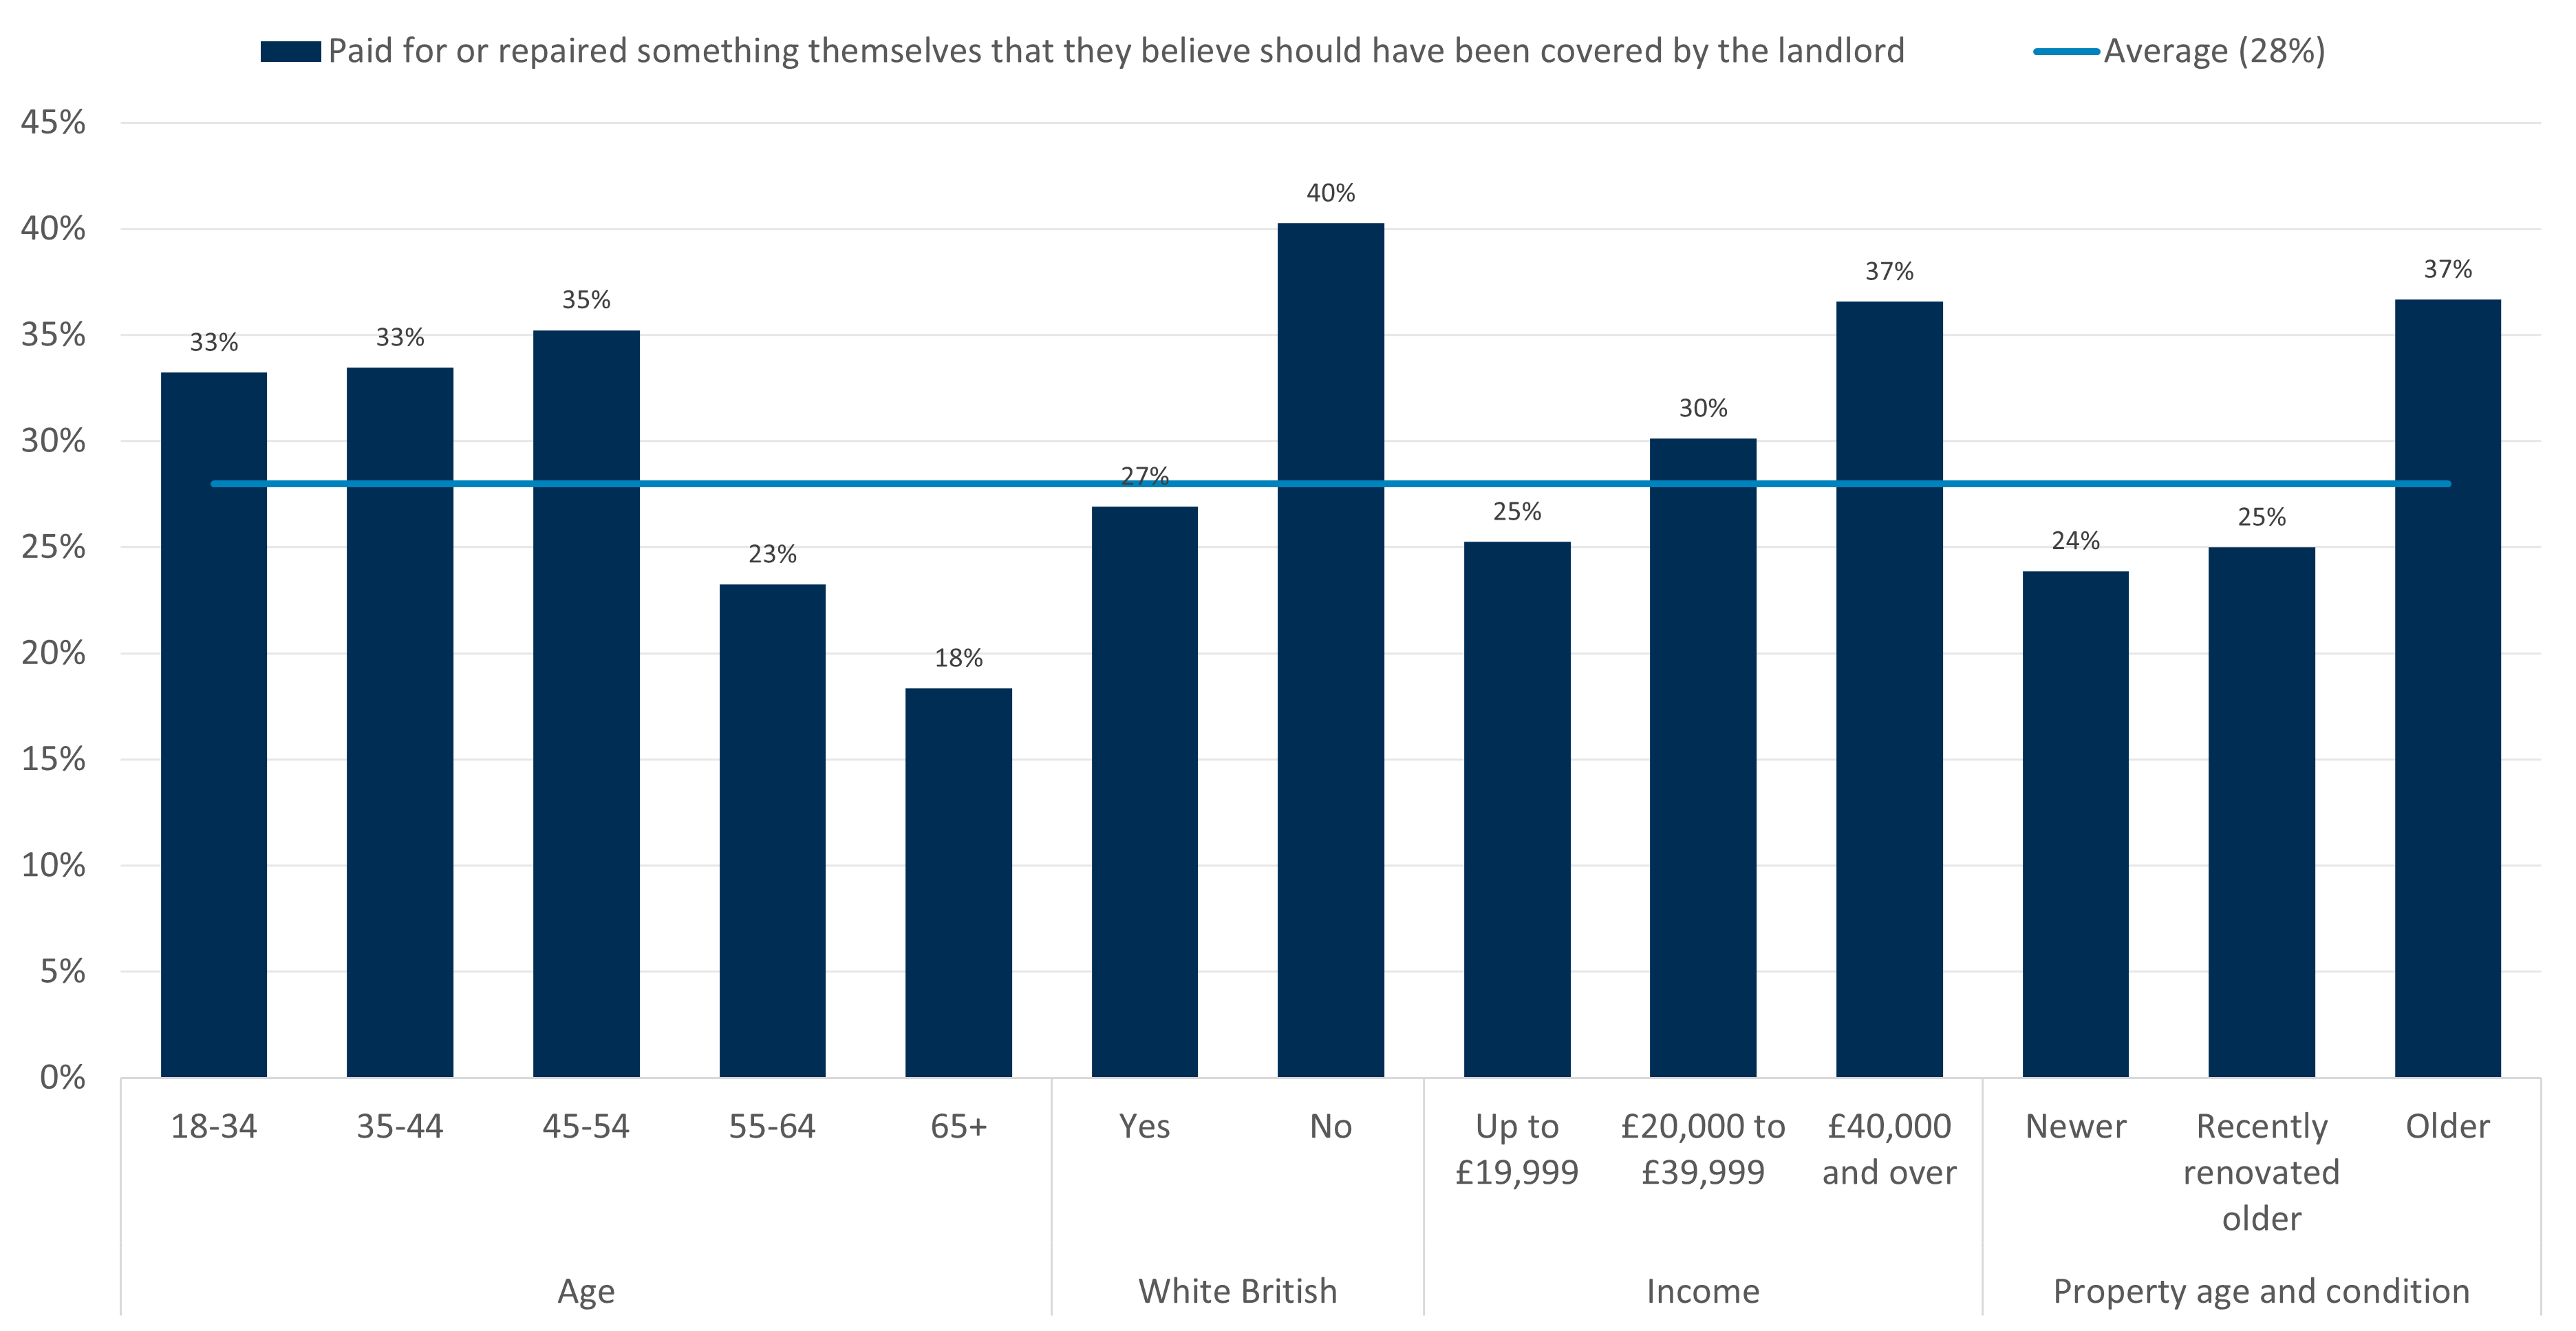
Source: Consumer Scotland’s Social rented sector survey, D8. Have you ever paid for or repaired something yourself that you believe should have been covered by your landlord? N = 1,402.
7. Awareness of rights and routes to redress
This chapter explores renters’ understanding of where to seek help if issues remain unresolved, their familiarity with key regulatory bodies and housing standards, and how awareness varies across demographic and property characteristics. While most renters report feeling confident about their responsibilities and ability to contact their landlord, awareness of external redress pathways is notably weaker.
Knowing where to go if landlord fails to resolve issues
We asked all renters whether they would know where to go if their landlord fails to address their issue or complaint, to allow us to compare with the private rented sector.
Although most renters were aware of at least one housing standard or body, only 48% said that they would know where to go if their landlord fails to address an issue or complaint.[22] A further 40% said they do not, and 12% said they do not know.
Variation by demographic characteristics
Certain groups of renters are less likely to know where to go if their landlord does not resolve an issue or complaint (Chart 13):
- Renters aged 55-64 (42%), compared with 65+ (57%)
- Lower-income households (up to £19,999, 44%) compared with higher income (£40,000 and over, 56%)
- Renters living in older unrenovated properties (over 10 years old and not recently renovated, 44%), compared with newer properties (58%)
- Renters without a known housing officer (29%) compared with those with one (56%)
These findings indicate that many renters are unaware about where to seek help, with particularly low levels of awareness among these groups. This gap in knowledge is especially concerning given that those living in older unrenovated properties and those without a known housing officer report poorer experiences across areas such as property condition, repairs handling and landlord relationship. As a result, the challenges they face may be further compounded by not being able to access effective routes to redress.
Chart 13: Only 29% of renters without a known housing officer know where to go if their landlord fails to address their issue or complaint
Percentage of respondents who know where to go if their landlord fails to address their issue or complaint, by demographics.
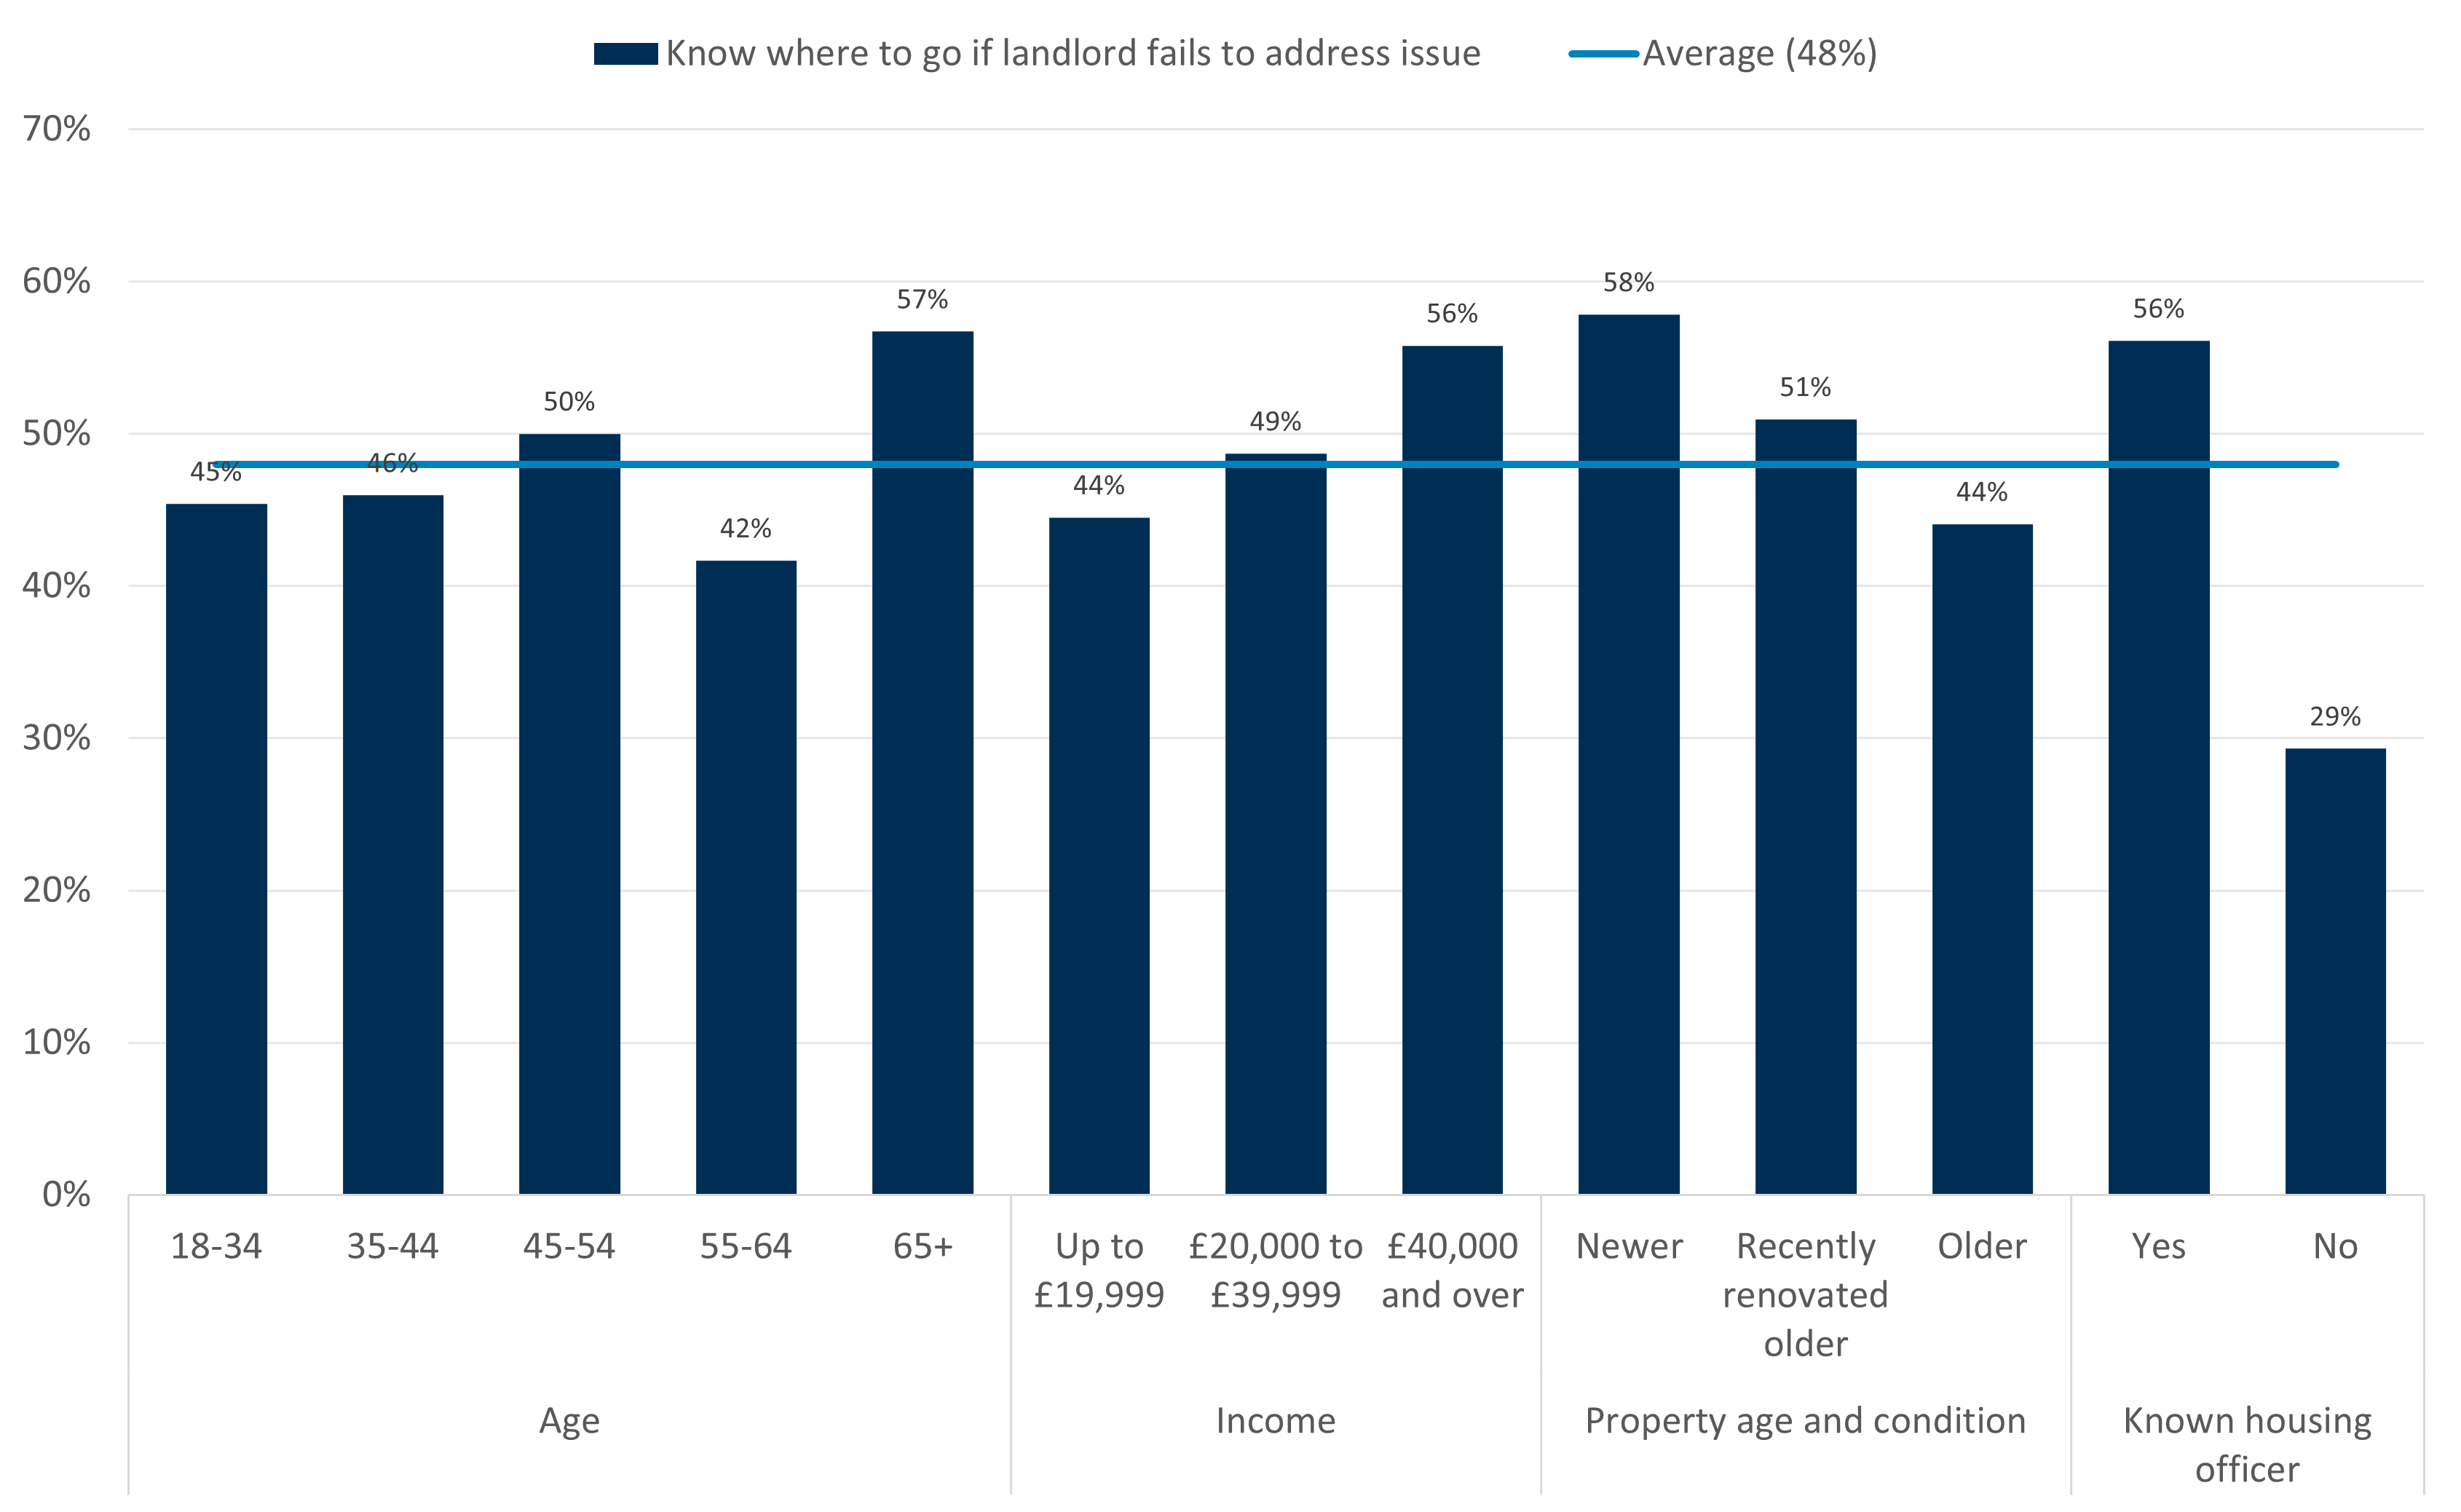
Source: Consumer Scotland’s Social rented sector survey, D10. Do you know where to go if your landlord fails to address your issue or complaint? N = 1,402.
Awareness of rights and redress pathways
Most (90%) renters feel that they understand they have certain responsibilities as a renter (Chart 14). Most also feel confident they could contact their landlord to resolve an issue (76%) and around seven in ten (72%) feel that they have a good understanding of their rights as a renter.
However, fewer renters feel confident about where to seek help if issues remain unresolved. Only 61% agree that they know where to go for advice, support, or information if they have a problem that their landlord has not resolved to their satisfaction.
Chart 14: Most renters feel they understand their rights and responsibilities, but fewer know where to go if their landlord does not address their issues
Extent to which respondents understand renter responsibilities and rights
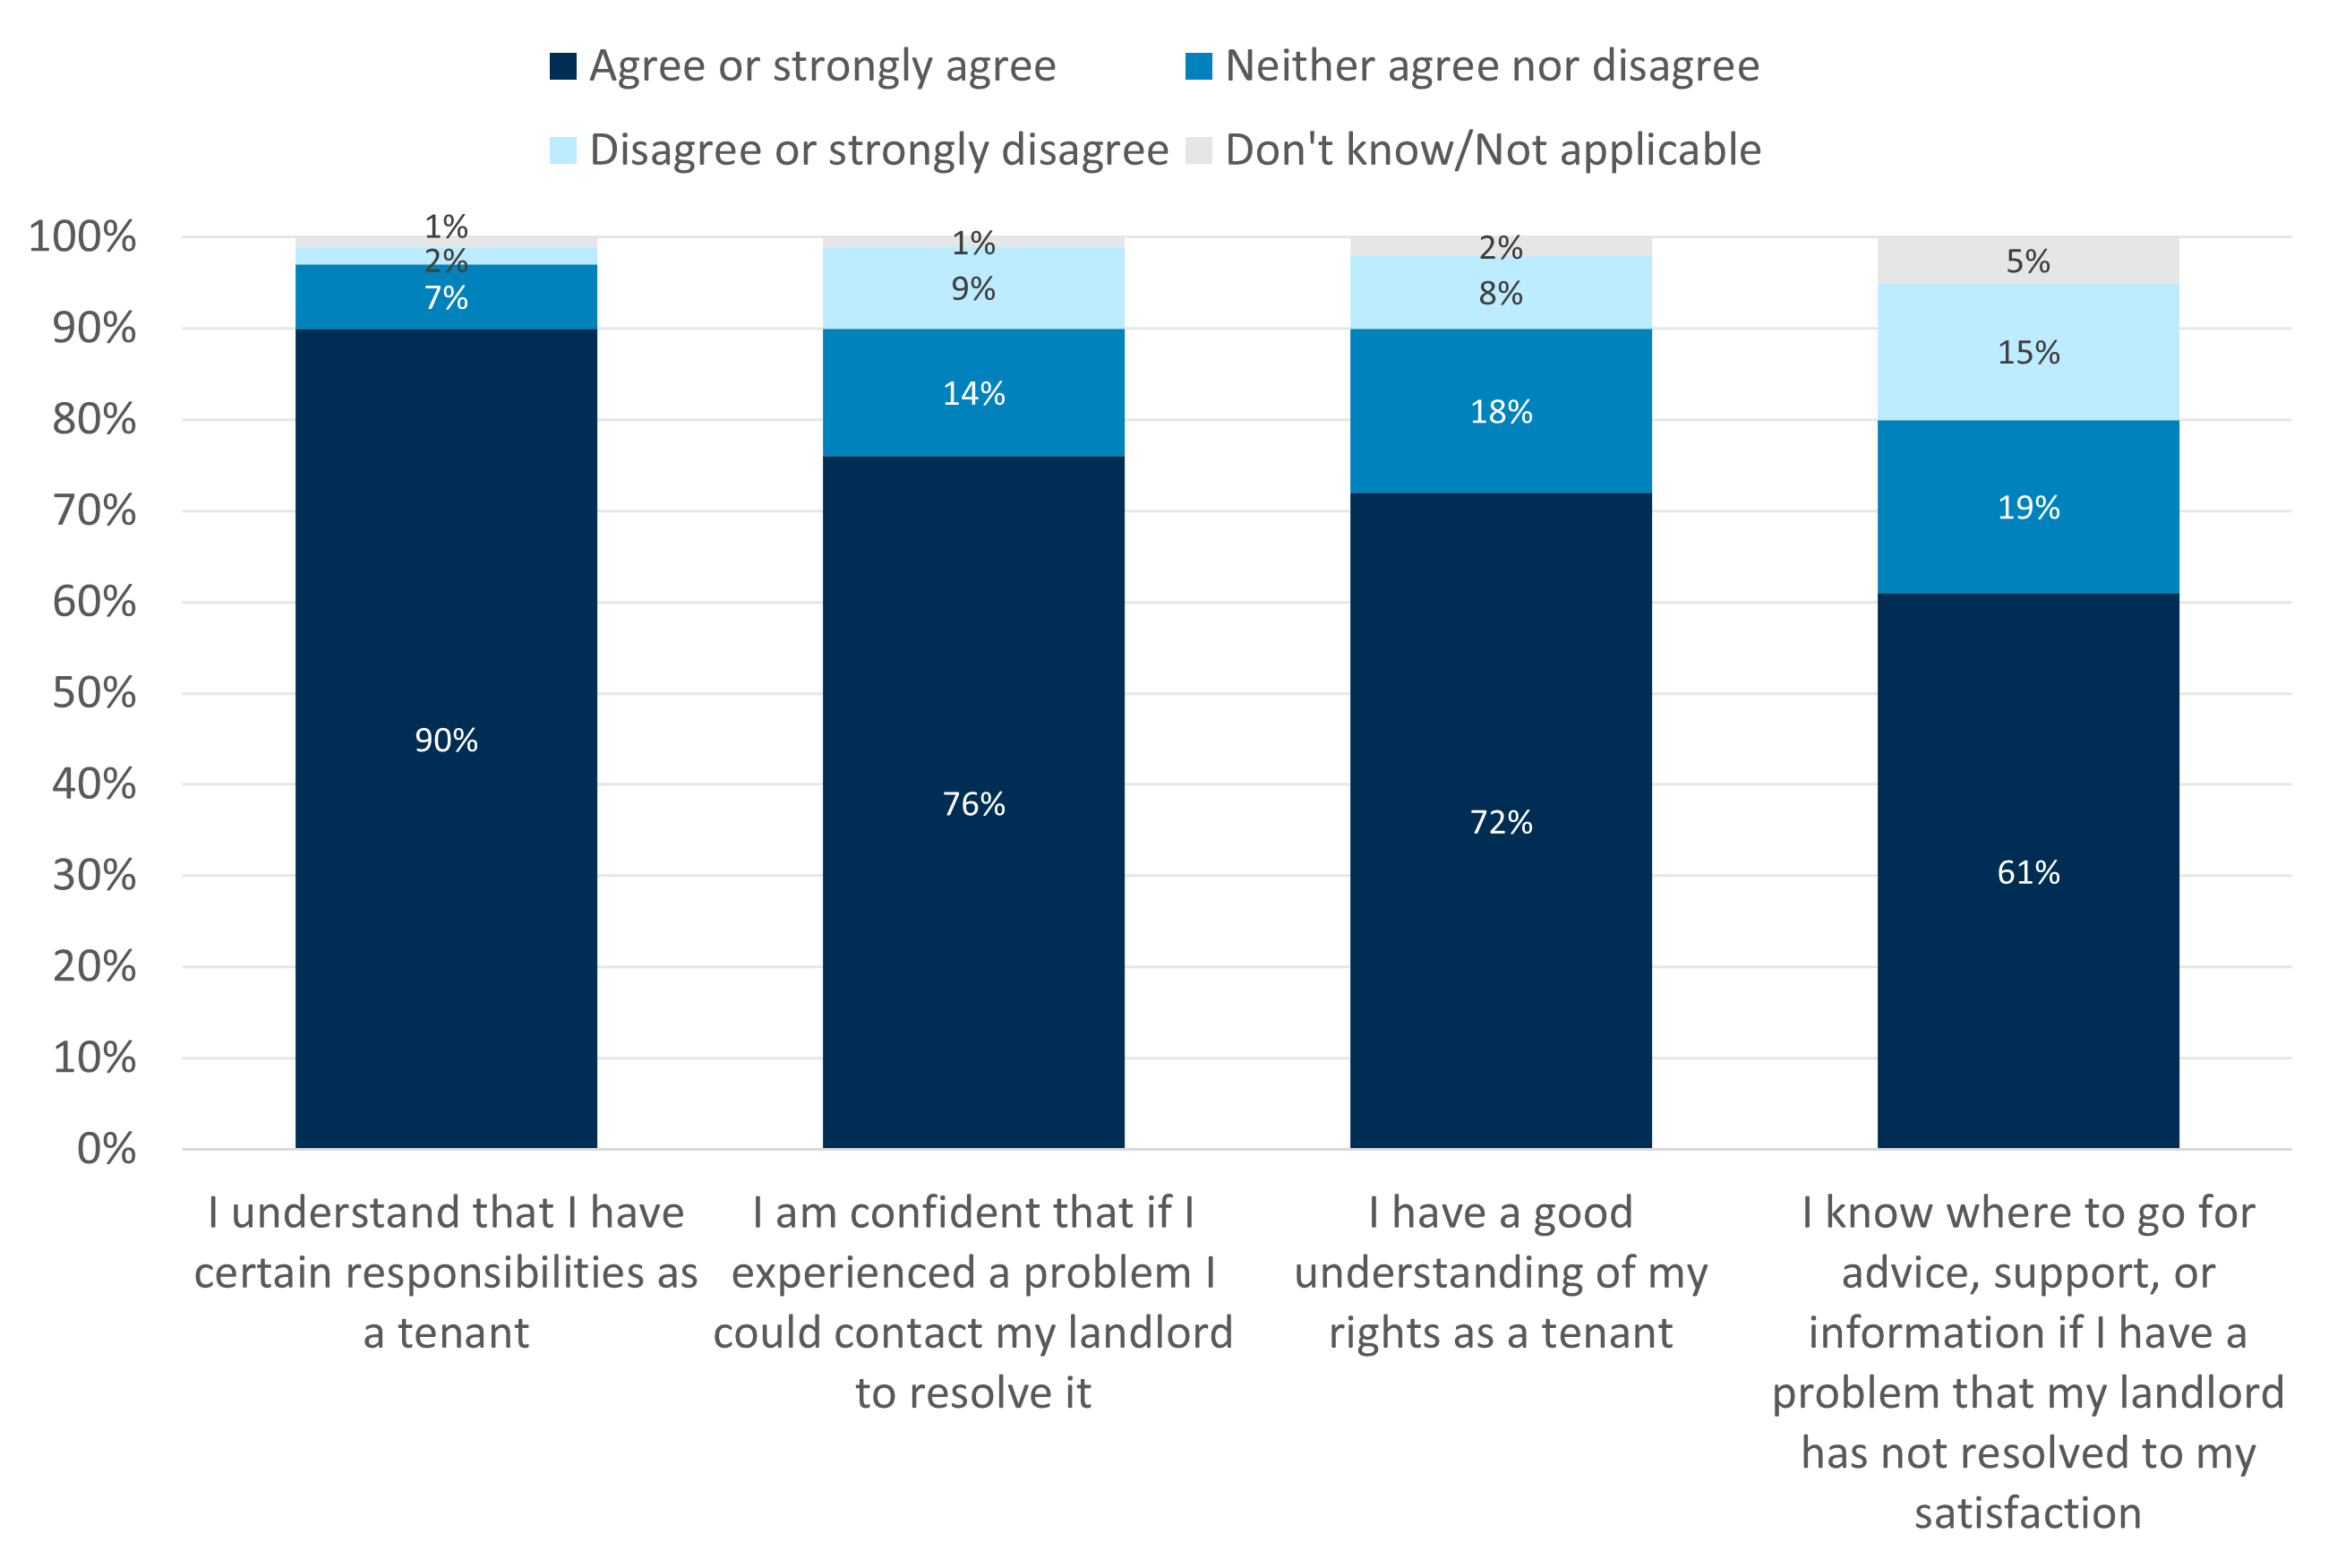
Source: Consumer Scotland’s Social rented sector survey, D11. To what extent do you agree or disagree with the following statements? N = 1,402.
Awareness of regulatory bodies, rights and standards
We asked renters whether they were aware of certain regulatory bodies, rights and standards. Most (69%) respondents are aware of at least one of these, but fewer than half of renters are aware of any individual standard or body (Chart 15).
Awareness is highest for the Right to Repair Scheme (49%), followed by the Scottish Public Services Ombudsman (44%). Around four in ten know about the Scottish Housing Quality Standard (41%), the Scottish Social Housing Charter (38%), and the Scottish Housing Regulator (37%). Awareness is lowest for the Tolerable Standard (32%).
Overall, these findings indicate that a substantial proportion of renters are unaware of the formal protections and standards designed to support them.
Chart 15: Less than half of renters are aware of any individual housing regulatory standard or body
Percentage of respondents aware of key housing regulatory bodies, rights and standards
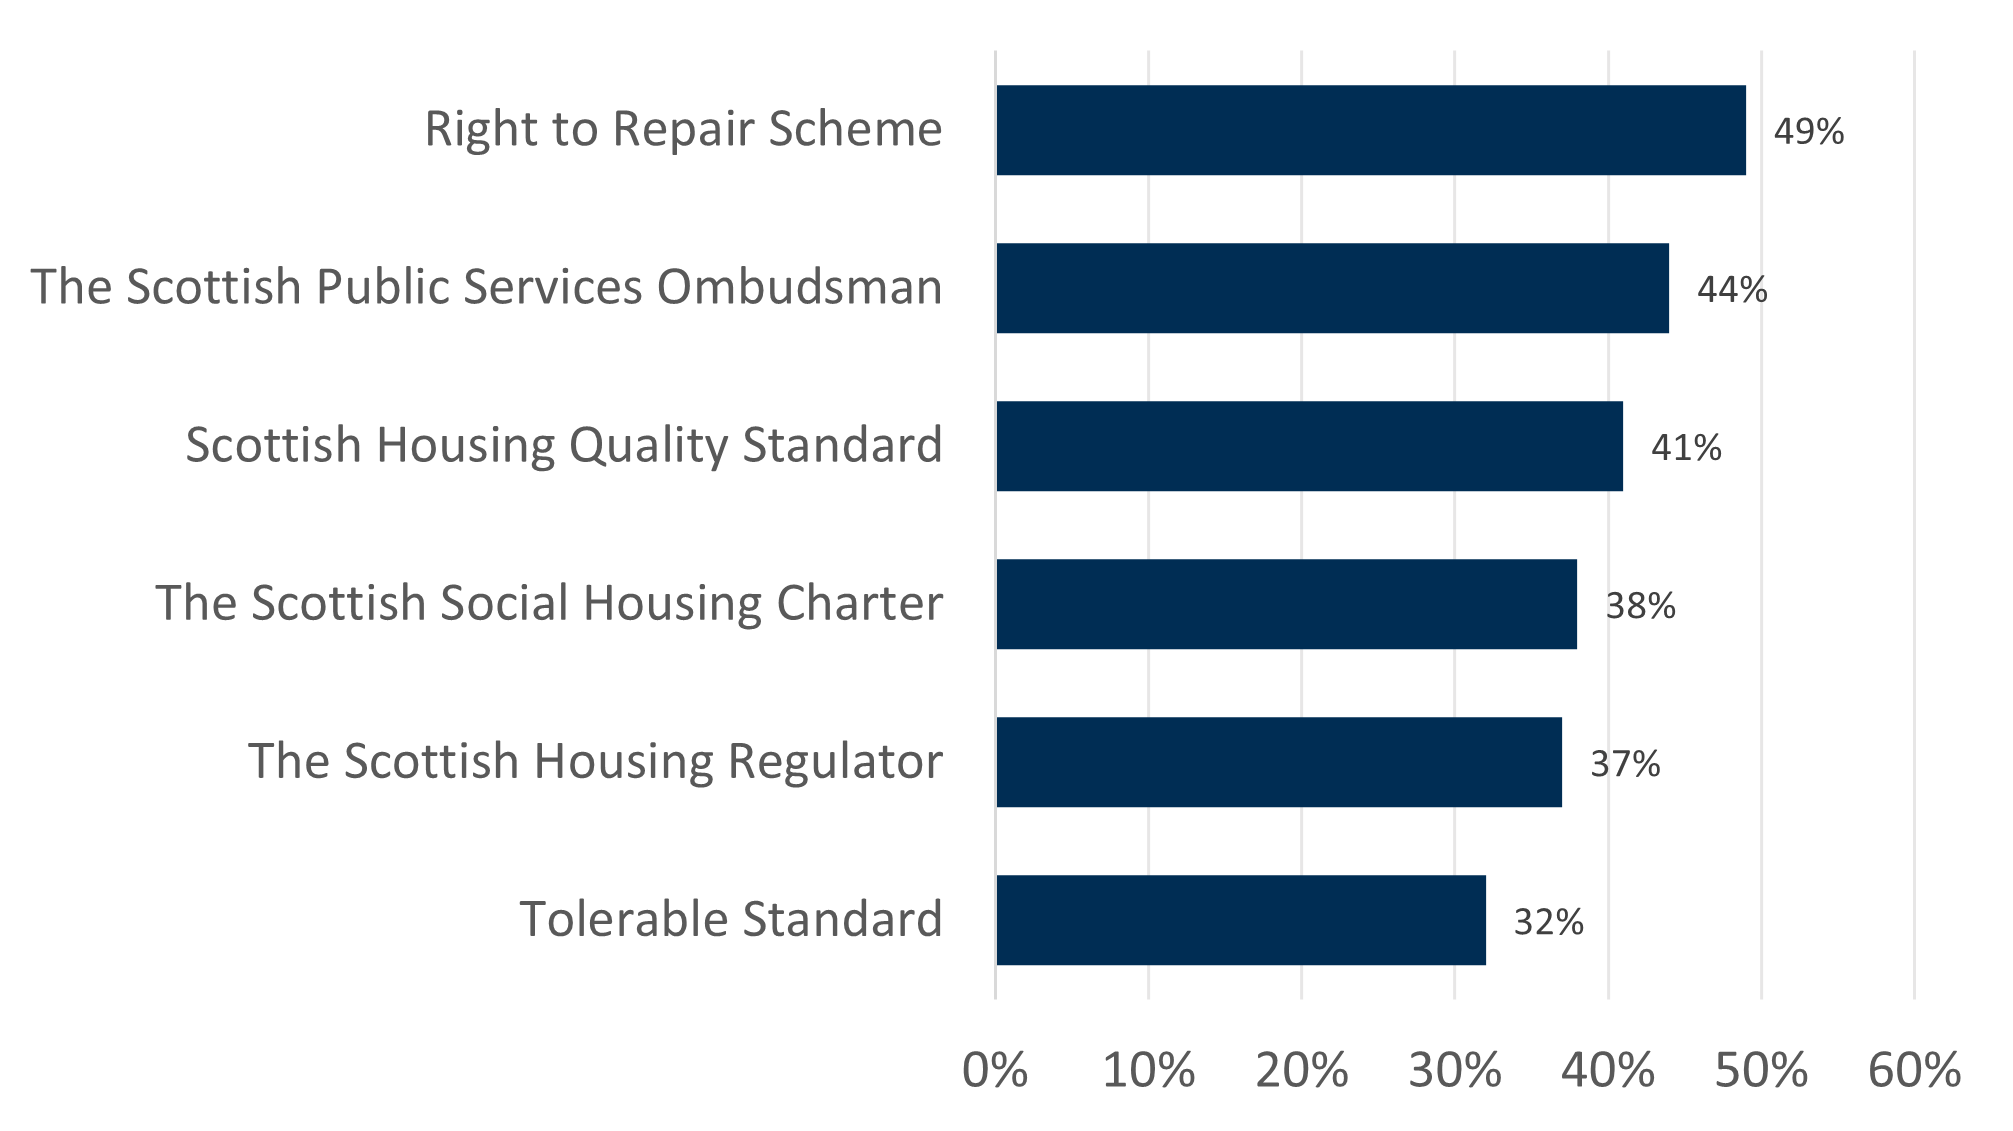
Source: Consumer Scotland’s Social rented sector survey, D12. Are you aware of any of the following? N = 1,402.
8. Landlord handling of repairs, complaints, anti-social behaviour and other issues
This chapter examines renters’ recent interactions with their landlord across four areas: repairs, complaints, anti-social behaviour (ASB) and other issues. Over half (54%) of renters reported that their landlord had carried out a repair to their home in the last 12 months. Most renters were satisfied with repairs, with positive ratings across most measures. By contrast, far fewer renters had made a complaint (18%), reported anti-social behaviour (16%), or raised another type of issue (17%) in the last 12 months. Among those who had, satisfaction with how their landlord handled these matters was significantly lower, with fewer than half of renters satisfied with any individual aspect of the process.
We asked renters about whether they had interacted with their landlord in any of the following ways in the last 12 months:
- Their landlord had carried out a repair to their home
- They had made a complaint to their landlord
- They had reported anti-social behaviour (ASB) in their neighbourhood to their landlord
- They had reported any other issue to their landlord
Just over half (54%) of renters said that their landlord had carried out a repair to their home in the last 12 months, while far fewer had made a complaint (18%), reported ASB (16%) or raised another type of issue (17%). Only 29% had not experienced any of these (Chart 16).
Chart 16: Most renters had had a repair, made a complaint, reported ASB or other issues to their landlord in the last 12 months
Percentage of renters who have had a landlord interaction in the last 12 months about repairs, complaints, ASB and other issues.
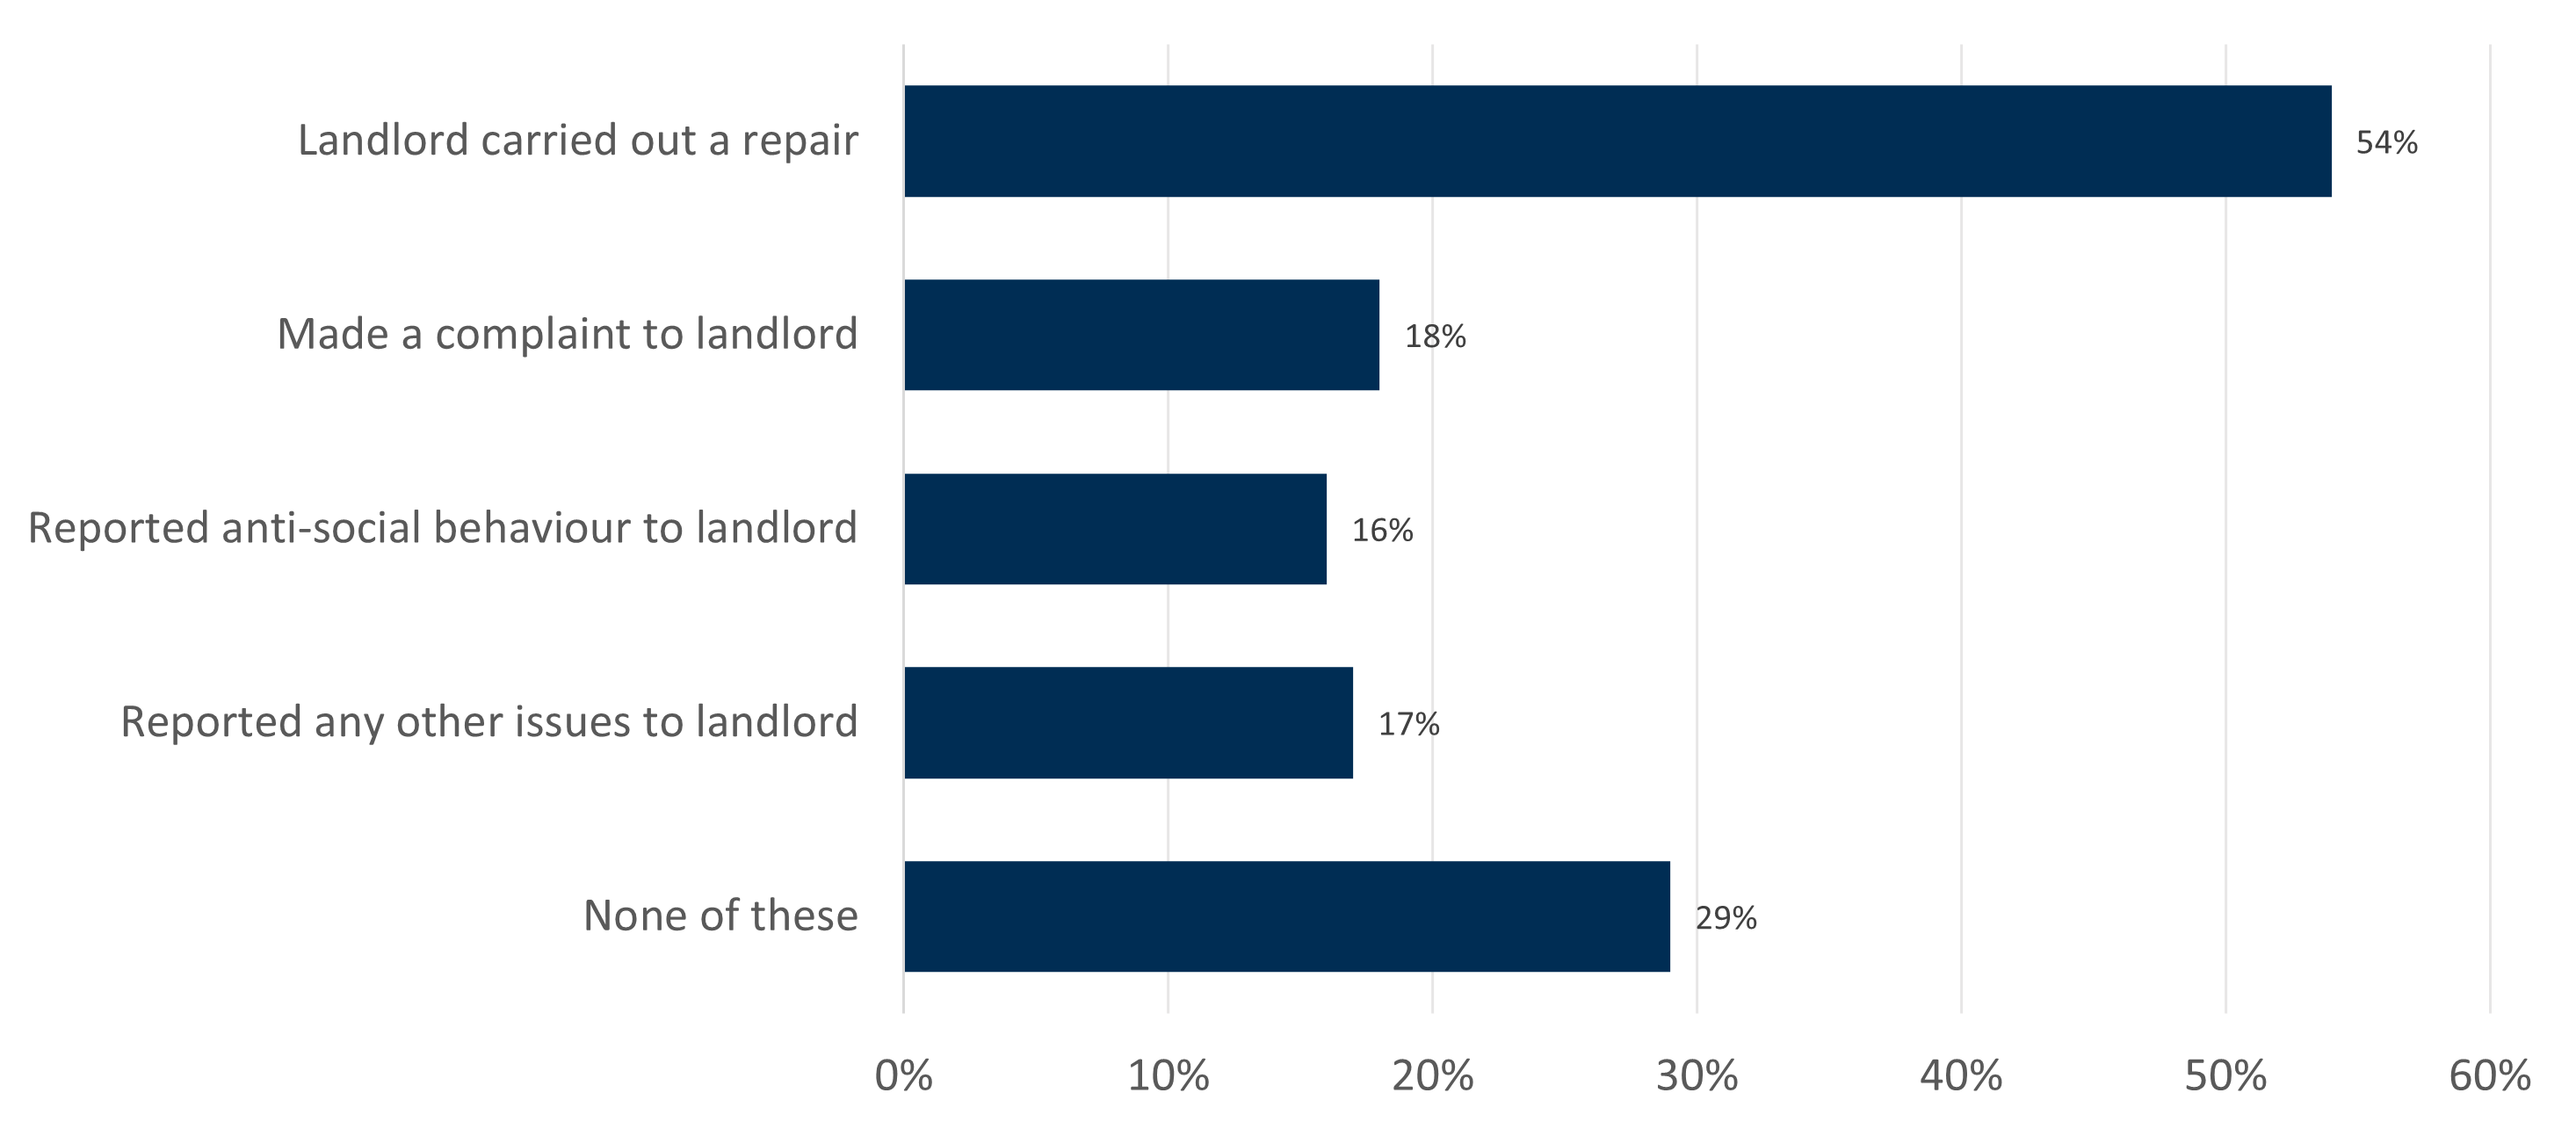
Source: Consumer Scotland’s Social rented sector survey, D13. Now thinking about your more general interactions with your landlord...? N = 1,402. Respondents could choose more than one response option, to totals may not sum to 100%.
Repairs
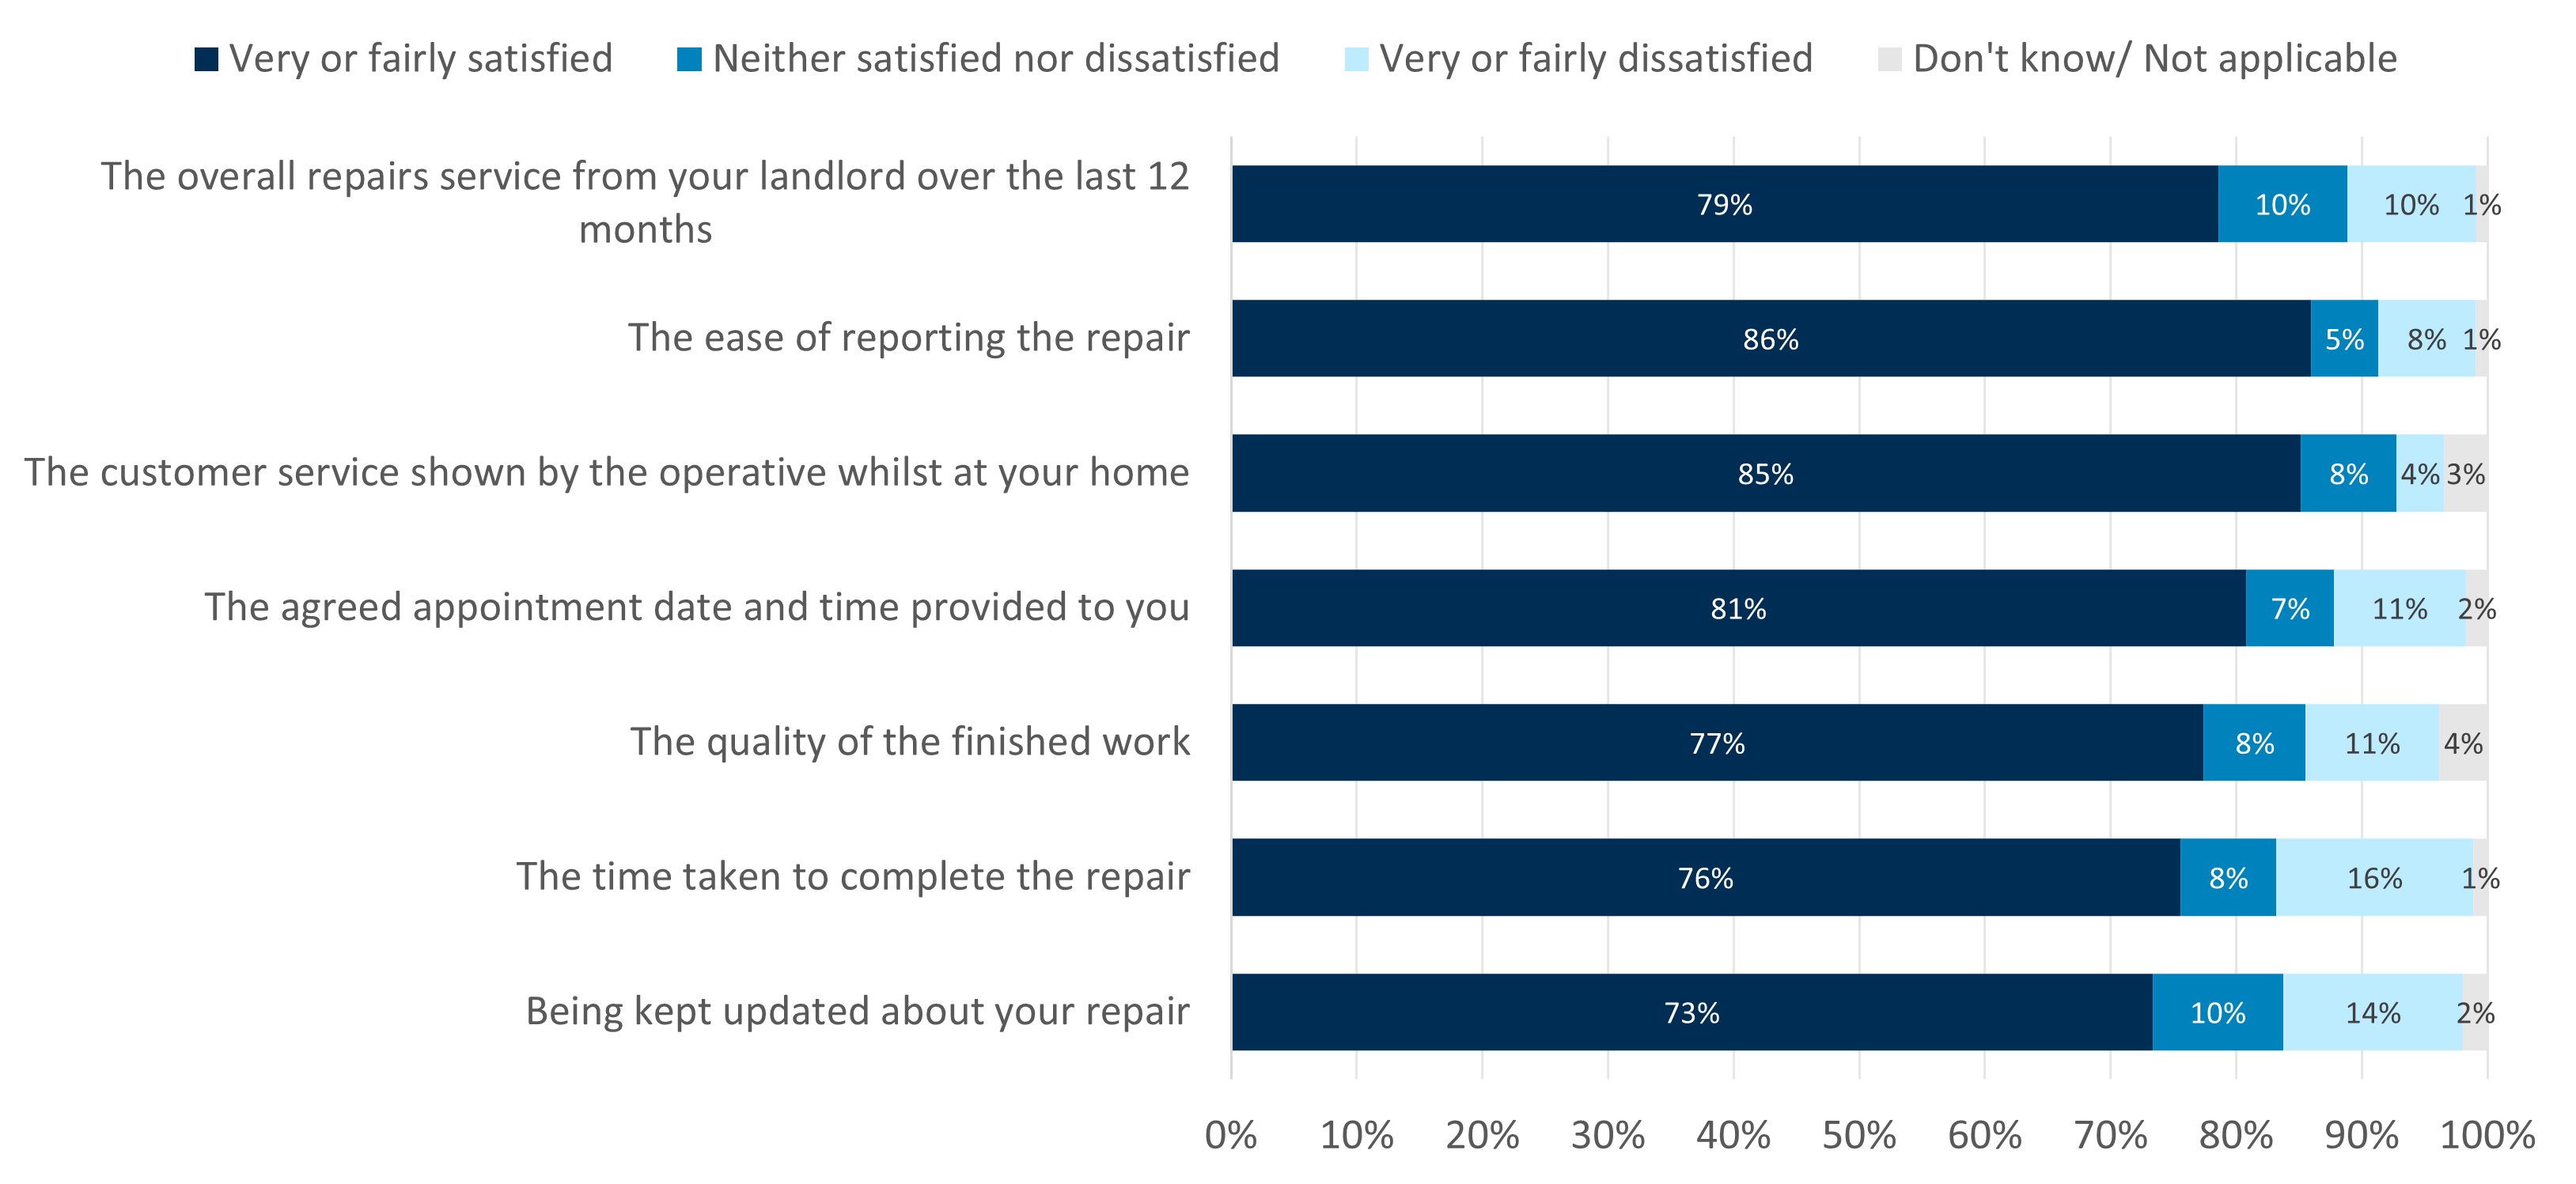
Overall, renters are satisfied with the way their landlord handles repairs; over 70% of respondents are satisfied with any individual aspect of the repairs process (Chart 17).
Ease of reporting repairs scores particularly well, with 86% of renters being satisfied with this. Similarly, 85% of renters are satisfied with the customer service from the operative whilst at their home. This suggests that renters find the initial contact process straightforward and effective.
Satisfaction was lower for aspects of timeliness and communication during repairs; 76% of renters are satisfied with the time taken to complete repairs, and 73% are satisfied with being kept updated about the repair, with dissatisfaction reaching 16% and 14% respectively. These findings indicate that, although the repair itself and the reporting process work well for most renters, landlords’ communication and speed of completion are weaker points.
Chart 17: Most renters are satisfied with the most recent repair carried out by their landlord, but are less satisfied with the time taken and being kept updated
Of those who have had a repair in the last 12 months, extent to which renters are satisfied with their most recent repair
Source: Consumer Scotland’s Social rented sector survey, D14. Thinking about your most recent repair how satisfied or dissatisfied are you with…? N = 757.
Variation by demographic characteristics
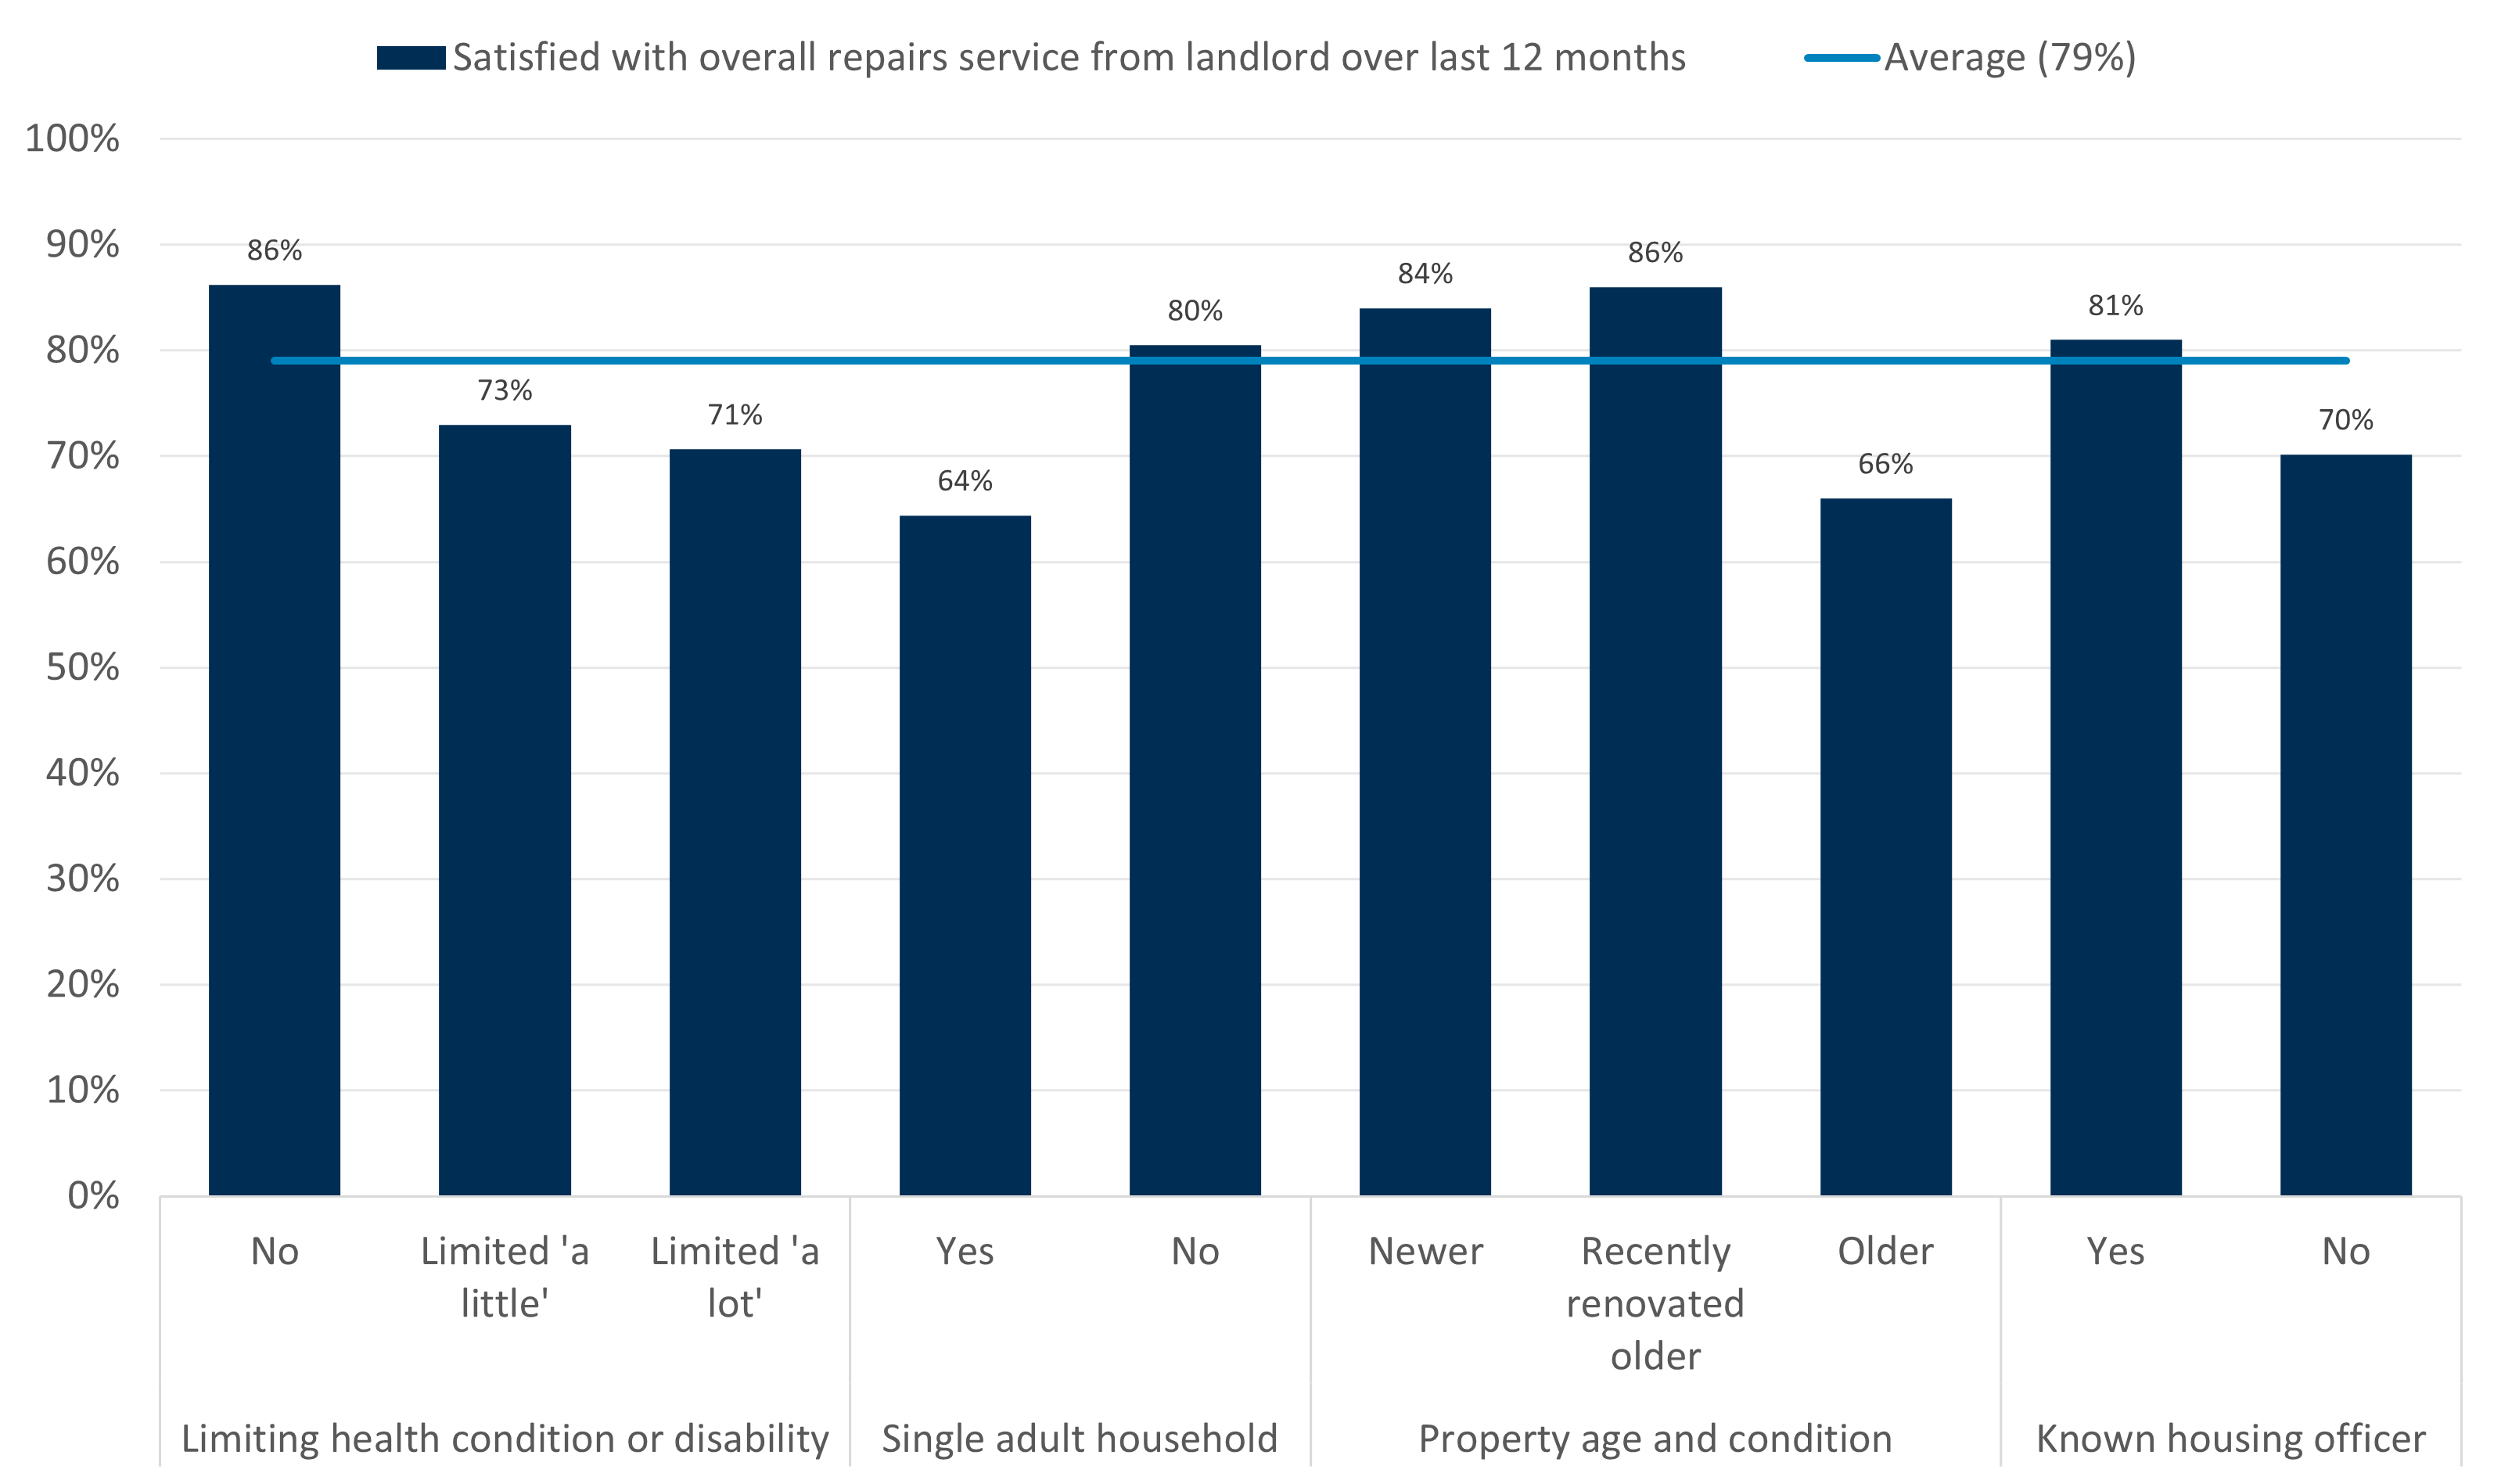
The characteristics associated with repair satisfaction differs depending on the aspect of repair that renters are asked about. This section and Chart 18 show demographics who differ on the ‘overall repairs service from landlord over last 12 months’ measure.
Satisfaction with the overall repairs service is lower among:
- Renters who have disabilities or health conditions that limit their day-to-day activities ‘a little’ (73%) or ‘a lot’ (71%) compared with those without (86%)
- Single adult households (64%) compared with other household types (80%)
- Renters living in older unrenovated properties (over 10 years old and not recently renovated, 66%) compared with newer (84%) properties
- Renters without a known housing officer (70%) compared with those with one (81%)
Chart 18: Satisfaction with the overall repairs service is particularly lower among single adult households
Of those who have had a repair in the last 12 months, percentage of respondents who are ‘very’ or ‘fairly’ satisfied with the overall repairs service, by demographics.
Source: Consumer Scotland’s Social rented sector survey, D14-7. Thinking about your most recent repair how satisfied or dissatisfied are you...with the overall repairs service from your landlord over the last 12 months? N = 757.
Complaints
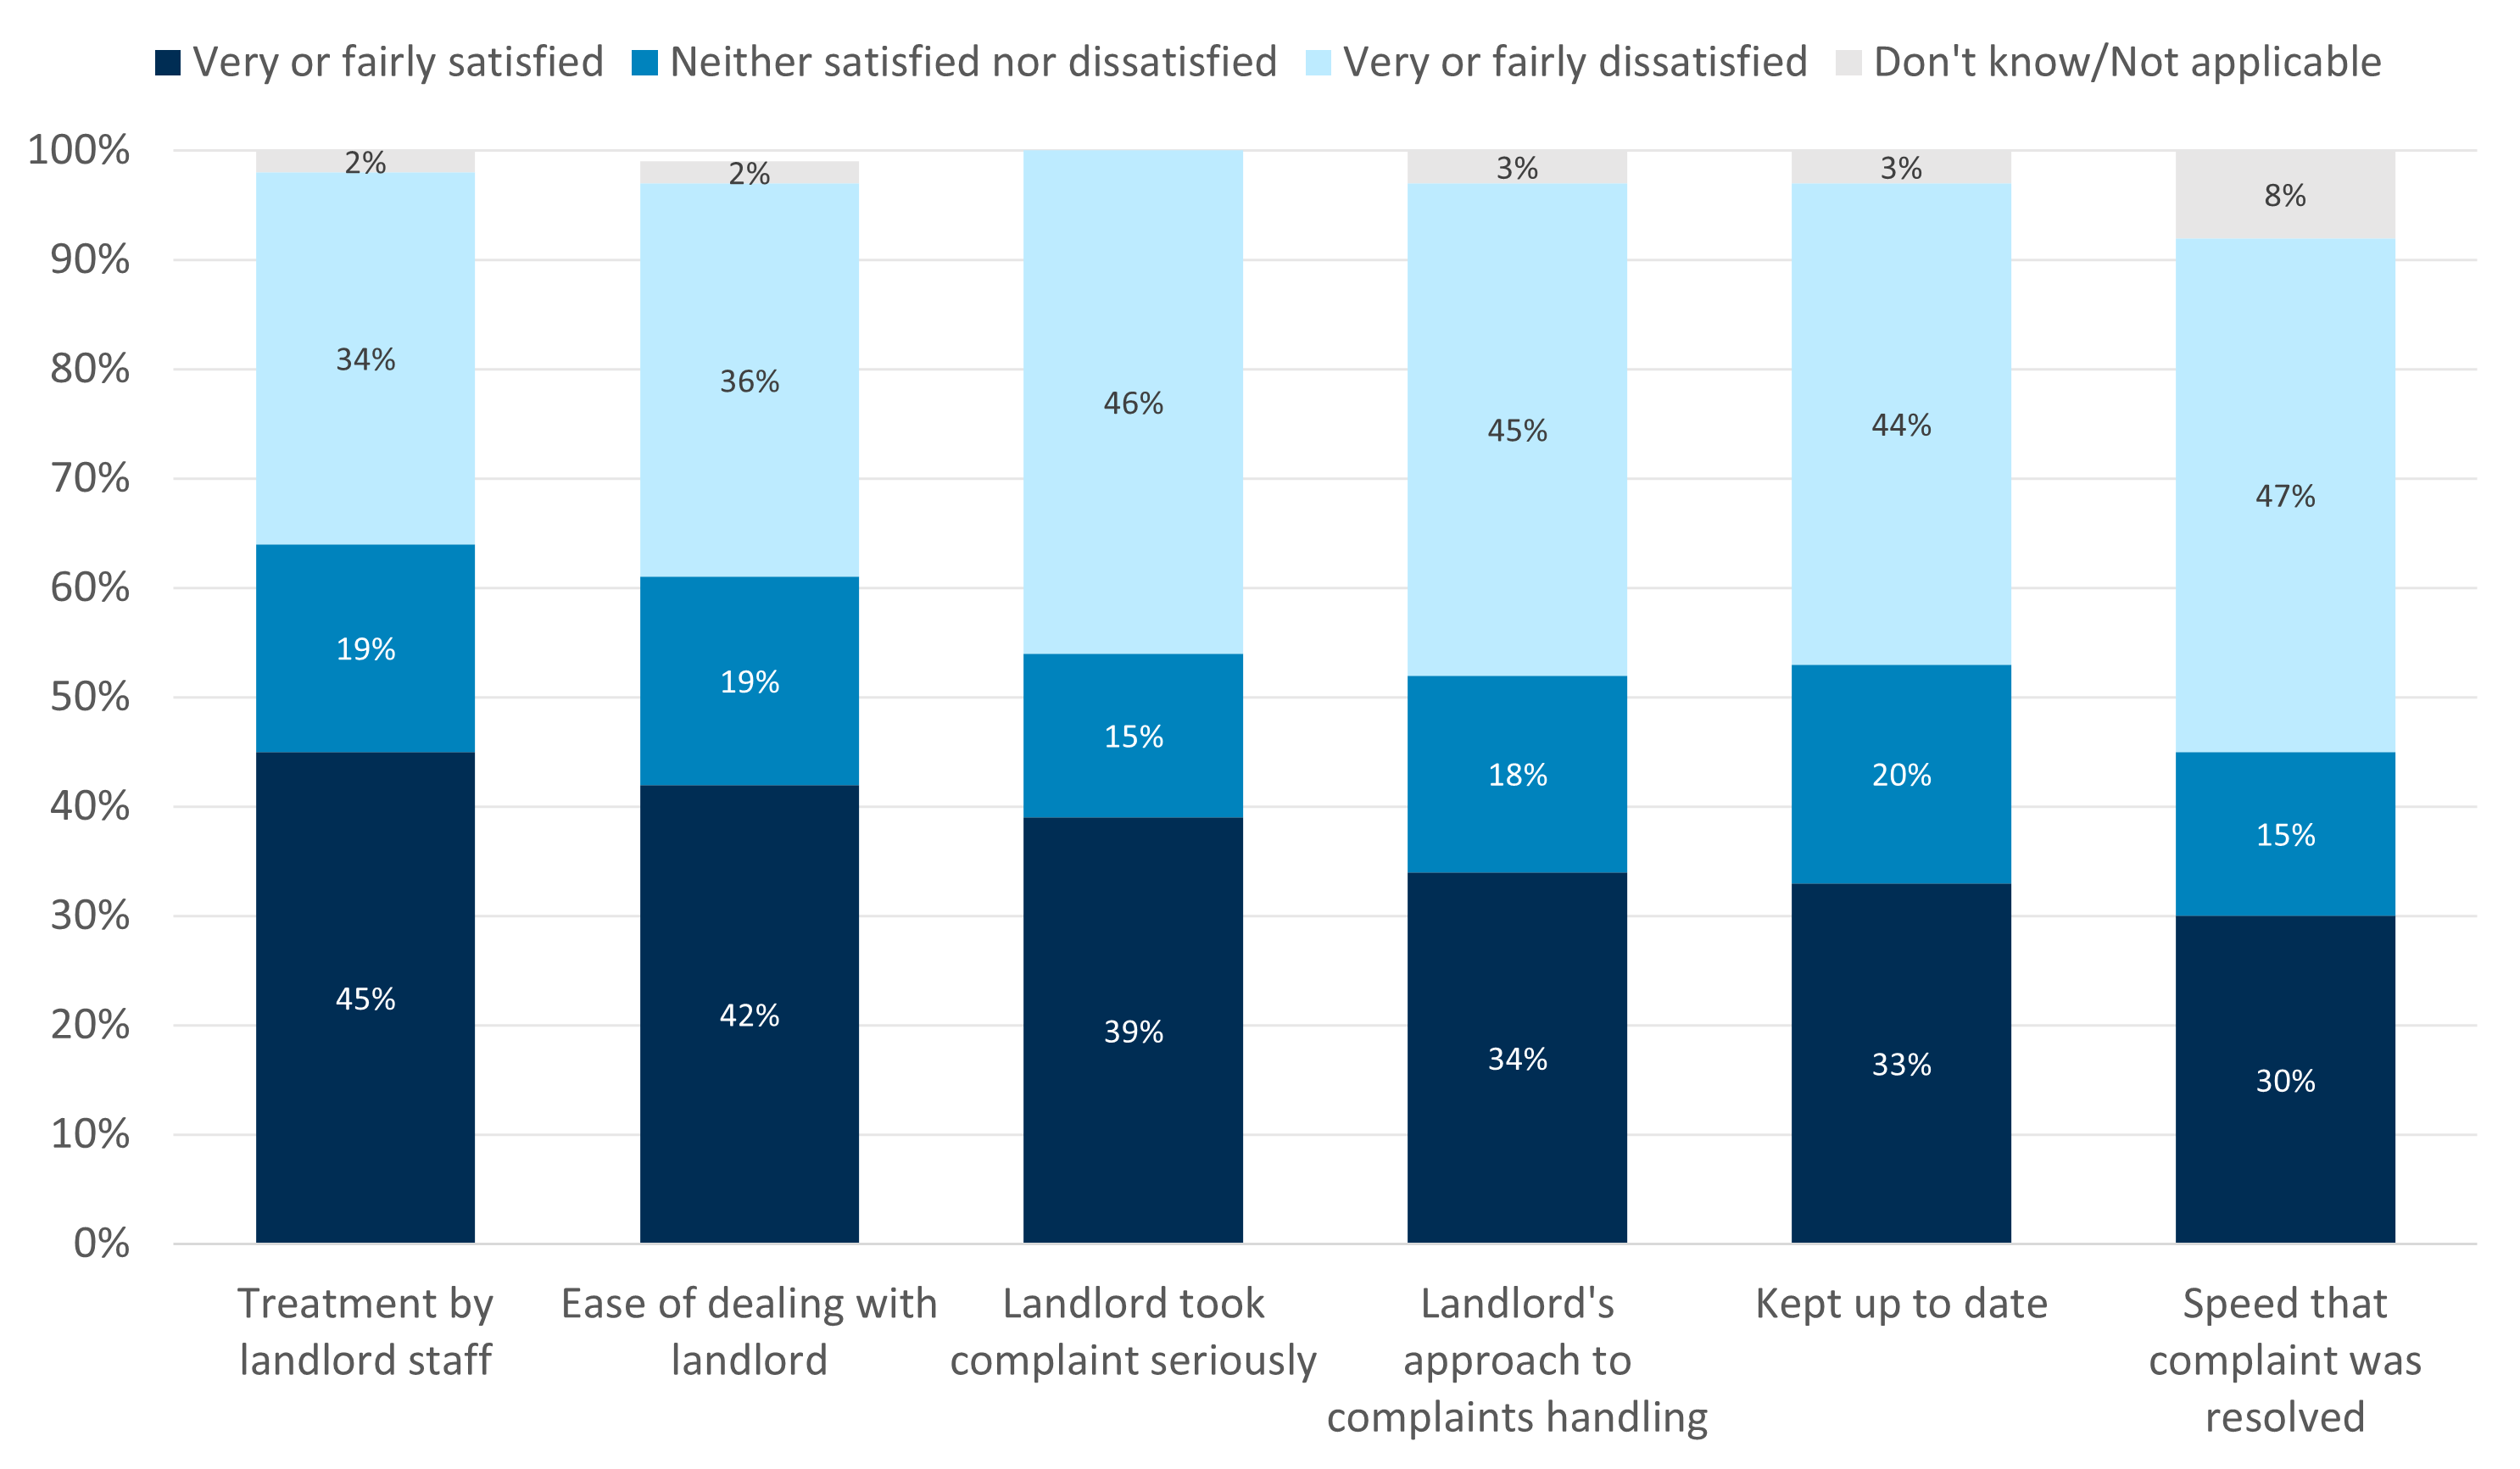
A relatively small proportion (18%) of renters made a complaint to their landlord in last 12 months. However, satisfaction with complaint handling was low – fewer than half of renters were satisfied with any individual aspect of the process (Chart 19).
Satisfaction was highest for treatment by landlord staff (45%) and ease of dealing with the landlord (42%). Only 39% of renters felt that their landlord took their complaint seriously. A third are satisfied with their landlord’s approach to complaints handling (34%) and with being kept up to date (33%).
Satisfaction is lowest for the speed that the complaint was resolved: just 30% of renters are satisfied with the speed, while almost half (47%) are dissatisfied.
Chart 19: Fewer than half of renters are satisfied with their landlord’s handling of complaints
Of those who have raised a complaint with their landlord in the last 12 months, satisfaction with landlord during process
Source: Consumer Scotland Social renters survey, D17. Thinking about your most recent complaint, how satisfied or dissatisfied are you…? N = 253.
Variation by demographic characteristics
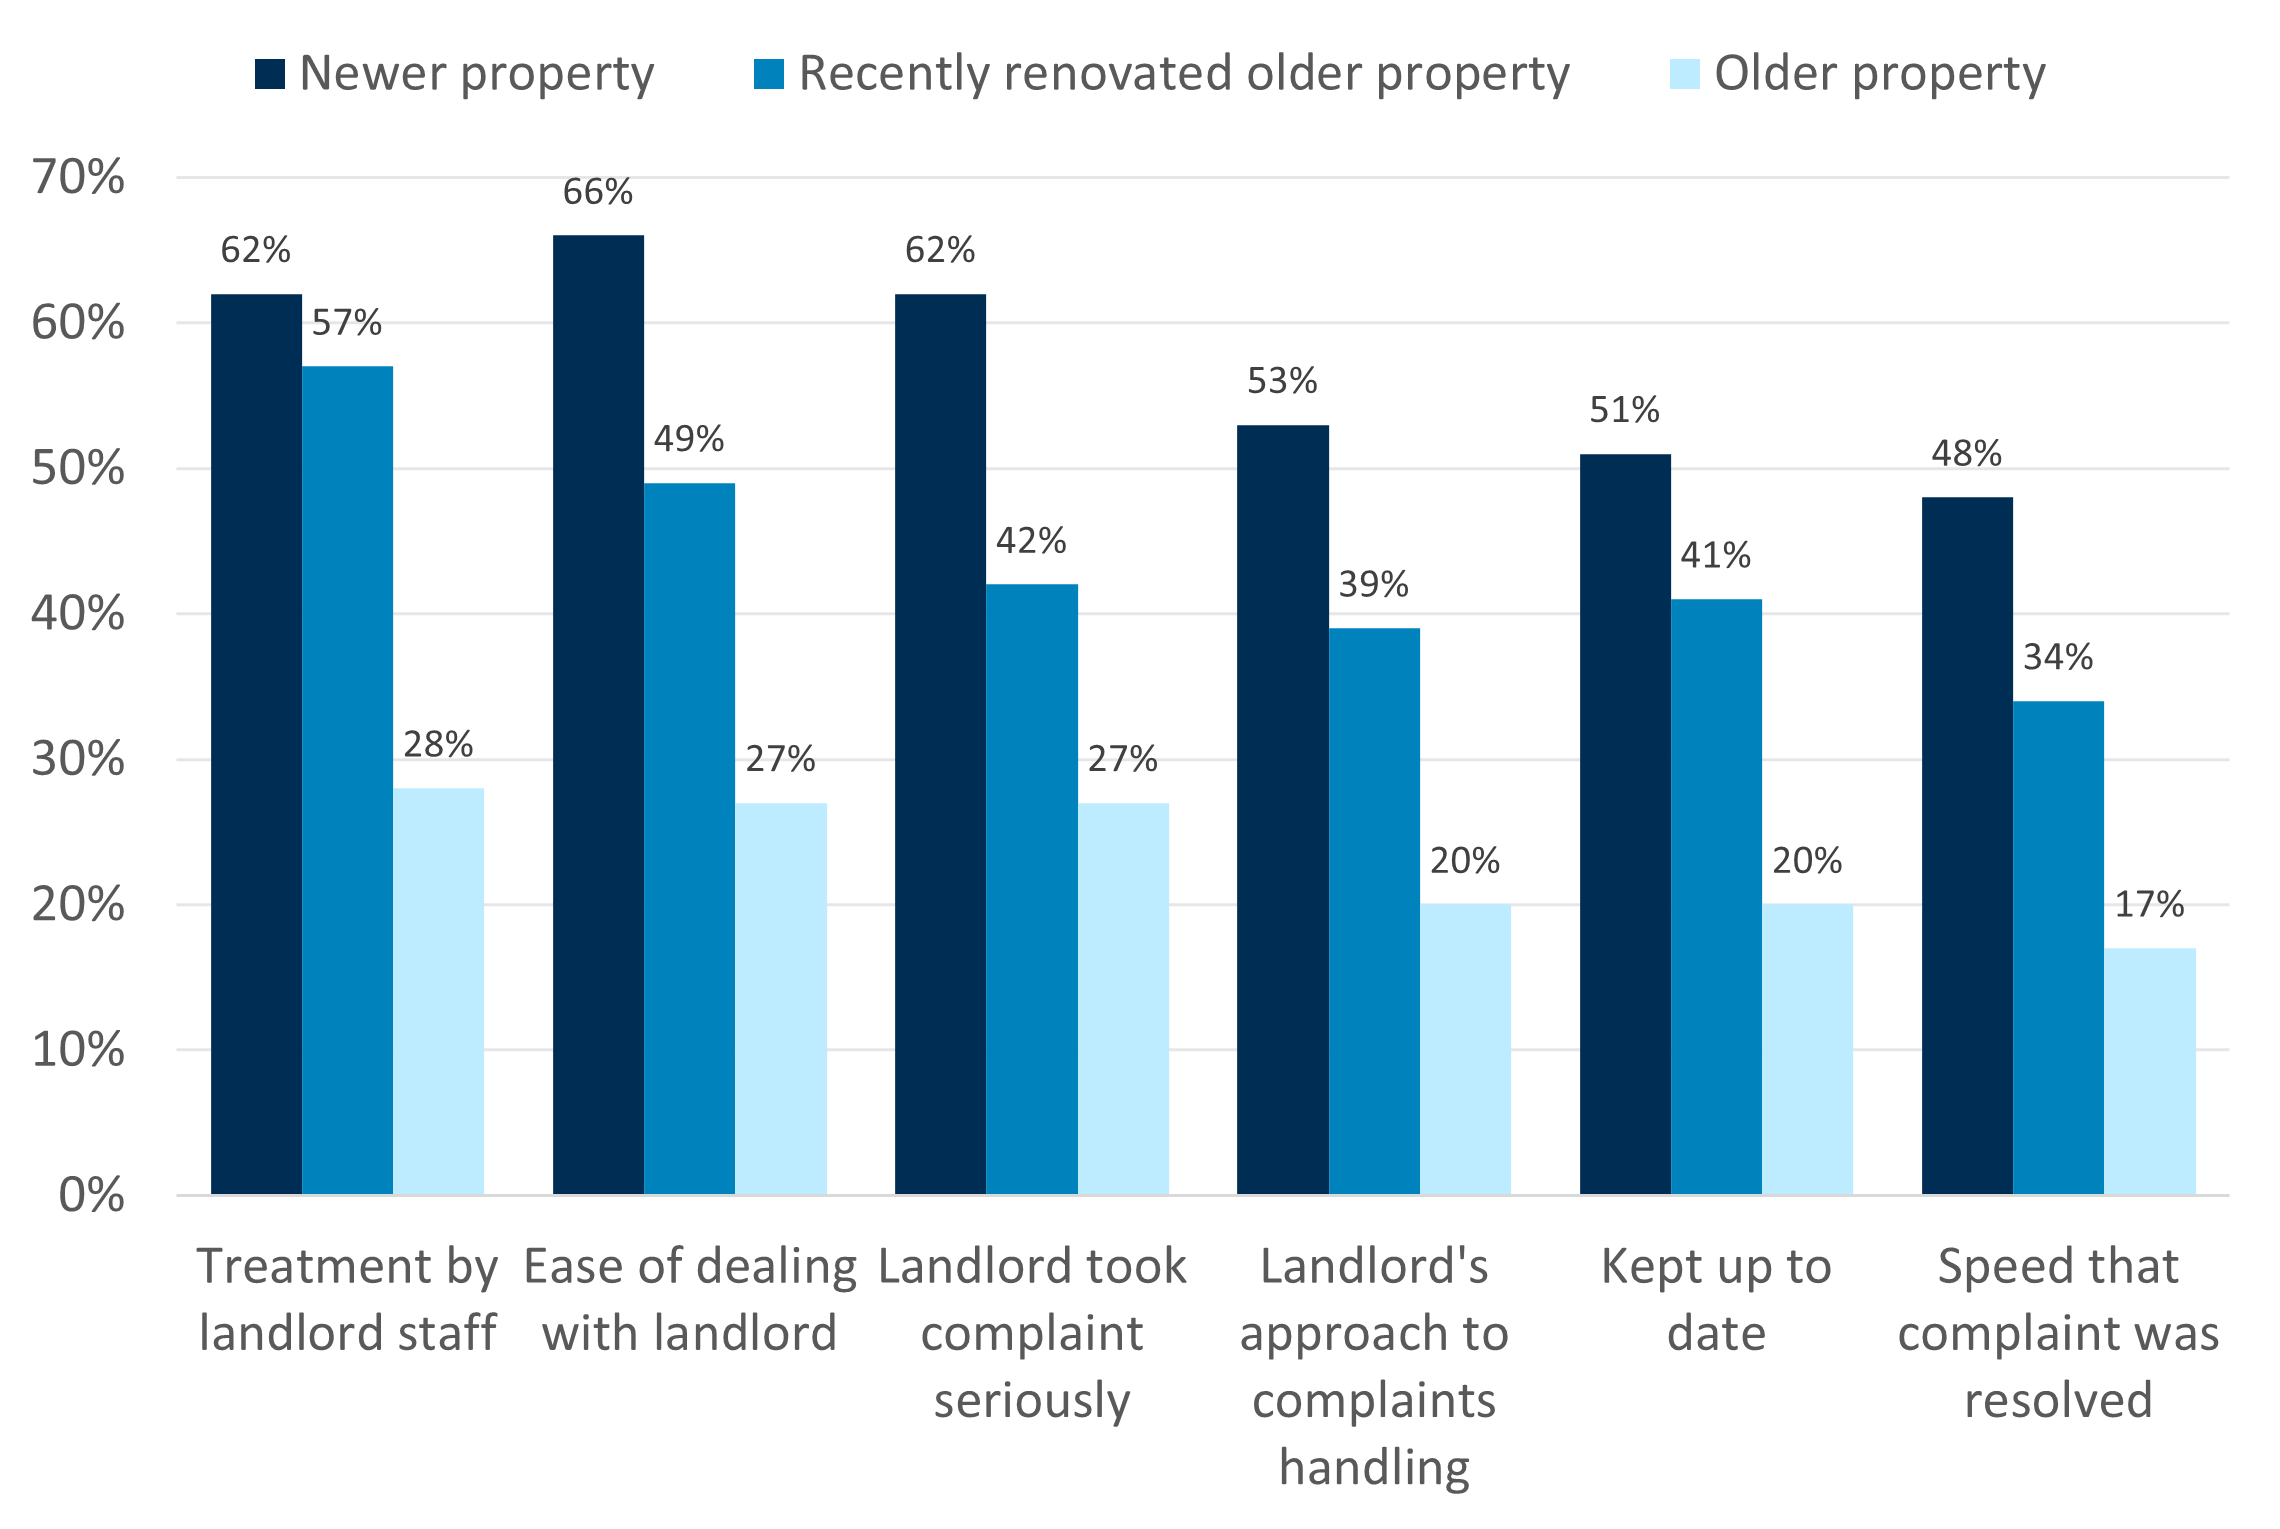
Because only a small proportion of renters reported raising a complaint in the last 12 months, the analysis in this section only considers individual characteristics in isolation and does not account for potential explanatory variables.
Satisfaction with complaint handling varied noticeably by property age and condition (Chart 20). Renters living in older unrenovated properties (over 10 years old and not recently renovated) consistently report low satisfaction across all aspects of the complaints process, with only 17-28% satisfied on each measure. By contrast, those in newer properties were much more satisfied, where over half of renters (48-62%) were satisfied. Those living in recently renovated older properties fell between these two groups. For example, only 17% of renters in older unrenovated properties were satisfied with the speed of complaint handling, compared with 34% in recently renovated older properties and 48% in newer properties.
Chart 20: Those living in newer properties were much more likely to be satisfied with their landlord’s complaints handling
Of those who have raised a complaint with their landlord in the last 12 months, satisfaction with landlord during process, by property age and condition
Source: Consumer Scotland Social renters survey, D17. Thinking about your most recent complaint, how satisfied or dissatisfied are you…? N = 253.
Satisfaction with complaint handling also differed by landlord type (Chart 21). Renters in housing association homes were significantly more likely to be satisfied with how their landlord handled complaints than those renting from councils. For example, 55% of housing association renters were satisfied with how they were treated by landlord staff, compared with 35% of council renters. A similar pattern appears across all measures, including ease of dealing with the landlord (53% vs 31%) and the speed of complaint resolution (39% vs 20%).
Chart 21: Those renting from housing associations were almost twice as likely to be satisfied with their landlord’s complaints handling
Of those who have raised a complaint with their landlord in the last 12 months, satisfaction with landlord during process, by landlord type
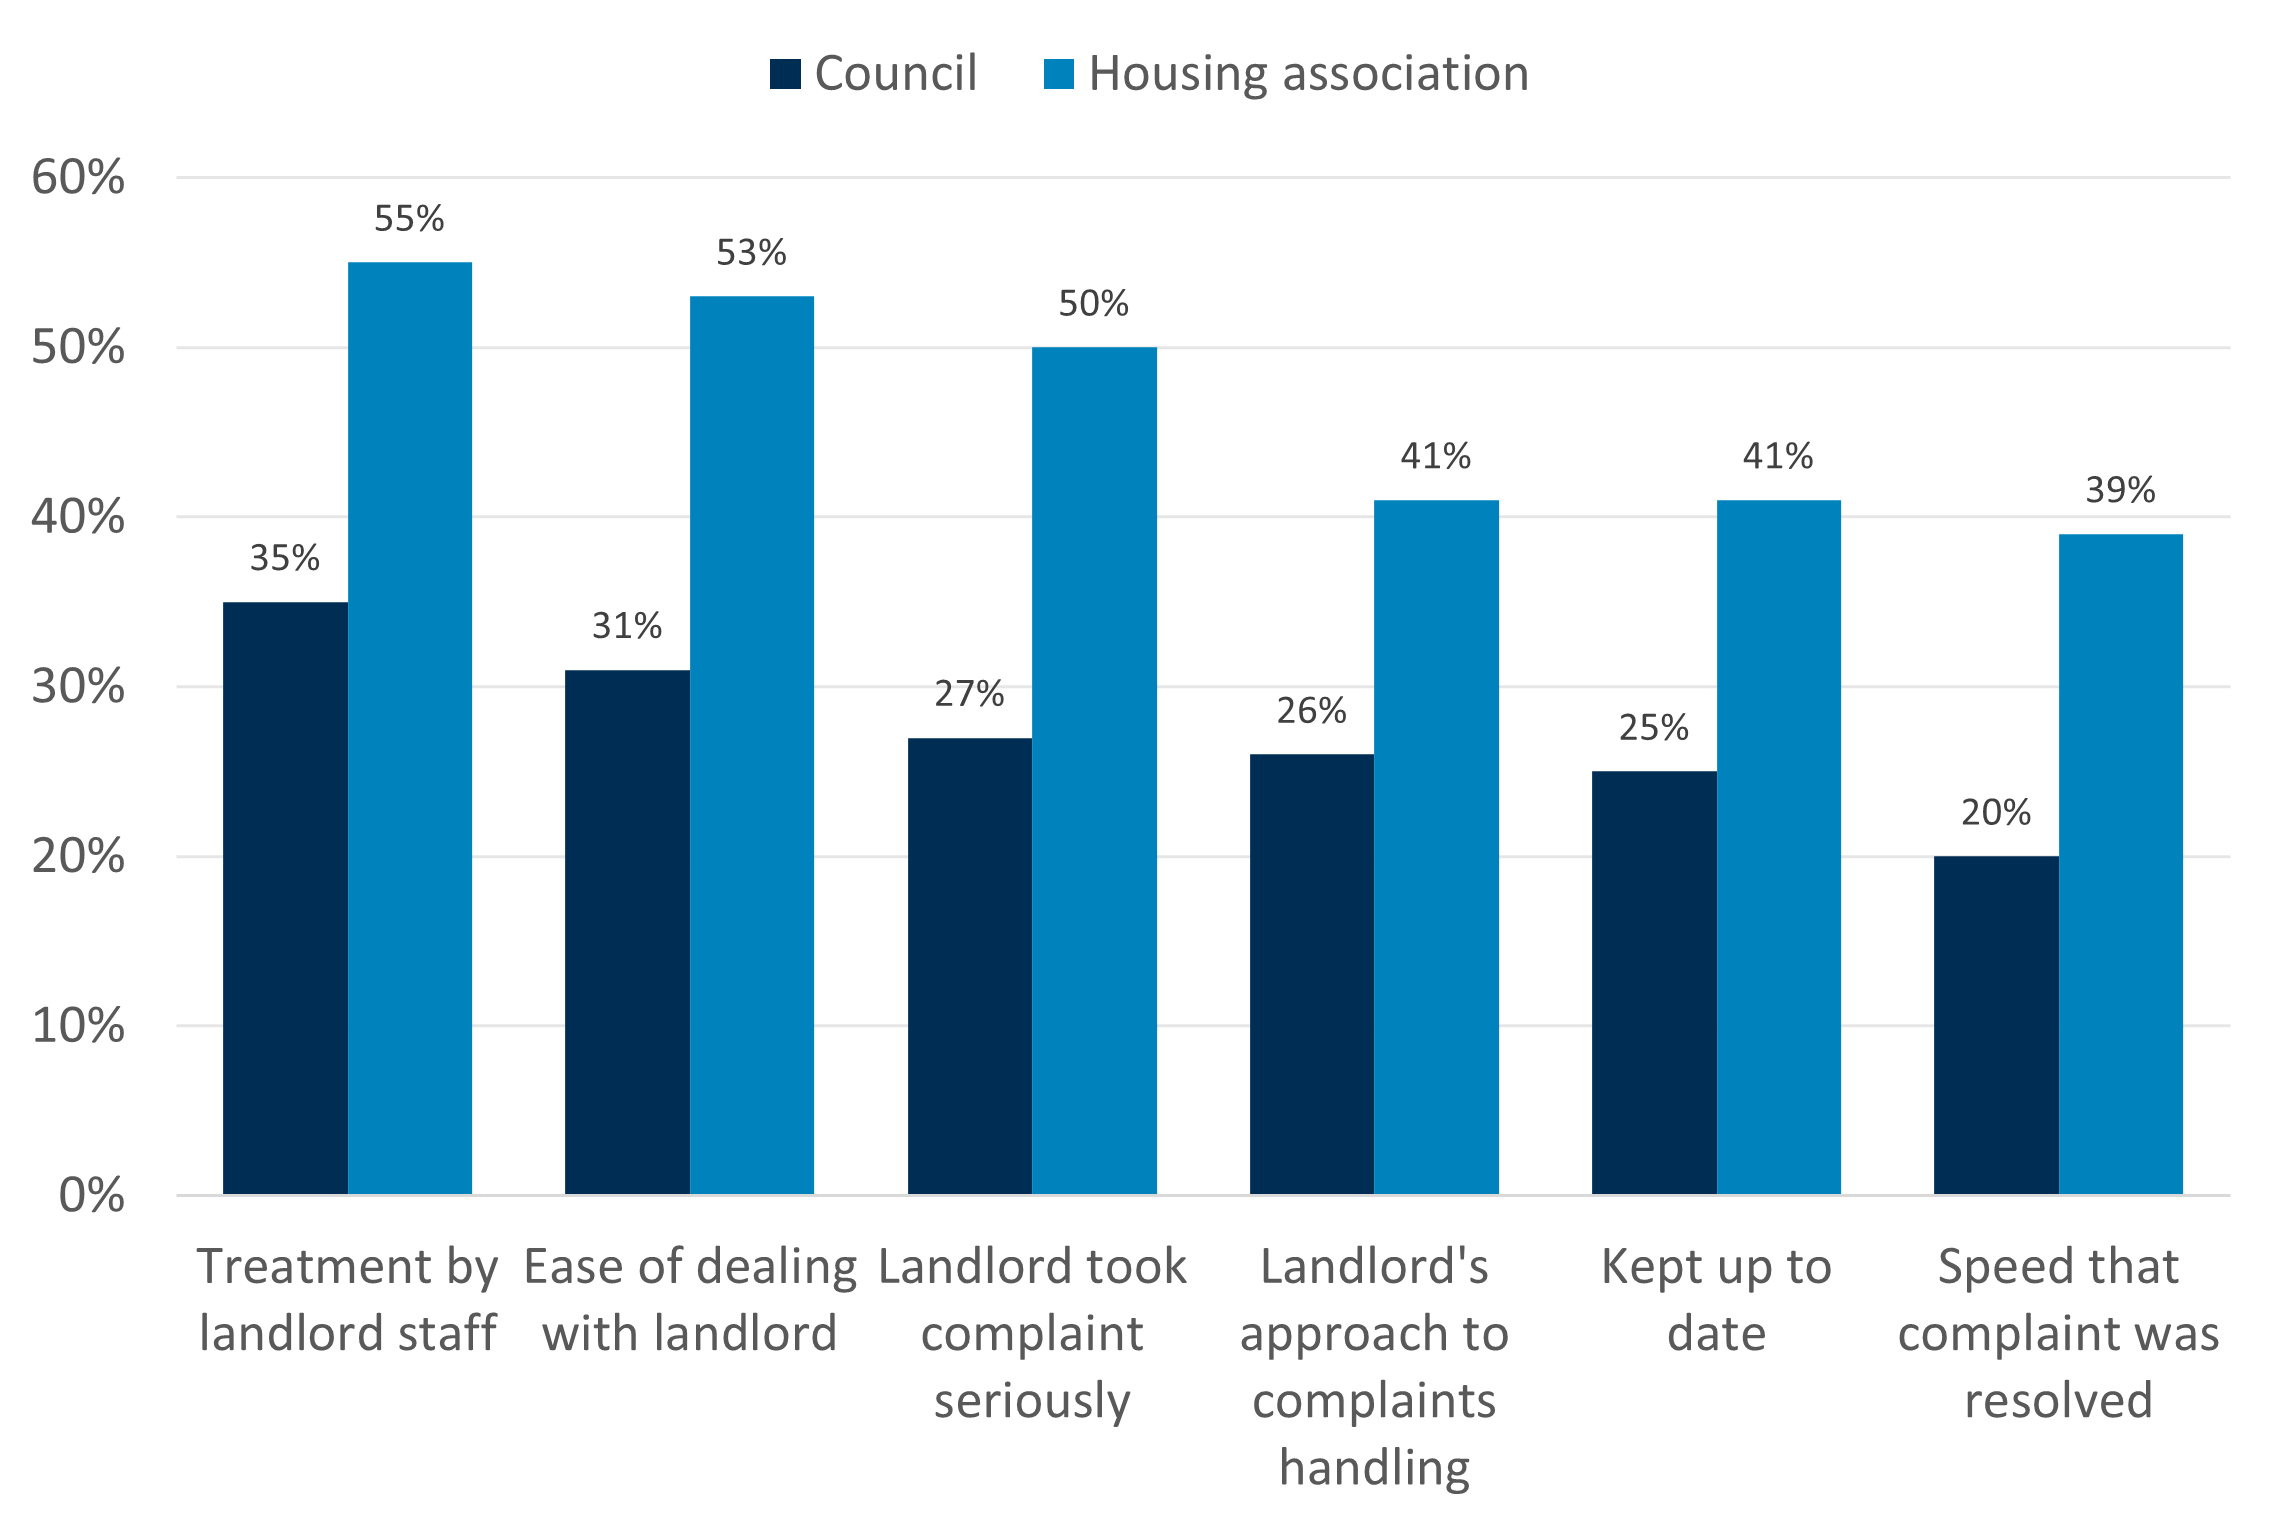
Source: Consumer Scotland Social renters survey, D17. Thinking about your most recent complaint, how satisfied or dissatisfied are you…? N = 253.
Anti-social behaviour
A minority (16%) of respondents have experienced anti-social behaviour in their neighbourhood in the last 12 months and reported it to their landlord.
Similar to complaints, renters feel that anti-social behaviour reports are handled poorly, with under half being satisfied by any individual aspect (Chart 22). And a considerable proportion (24-30%) are ‘very dissatisfied’ with a given measure.
Respondents are generally more satisfied with the way they are treated by landlord staff during anti-social behaviour cases, but this number was still less than half (47%). Satisfaction was lowest for the speed at which the case was resolved, at 32%.
Chart 22: Less than half of renters are satisfied with their landlord’s handling of anti-social behaviour issues
Of those who had reported ASB to their landlord, satisfaction with how the issue was handled
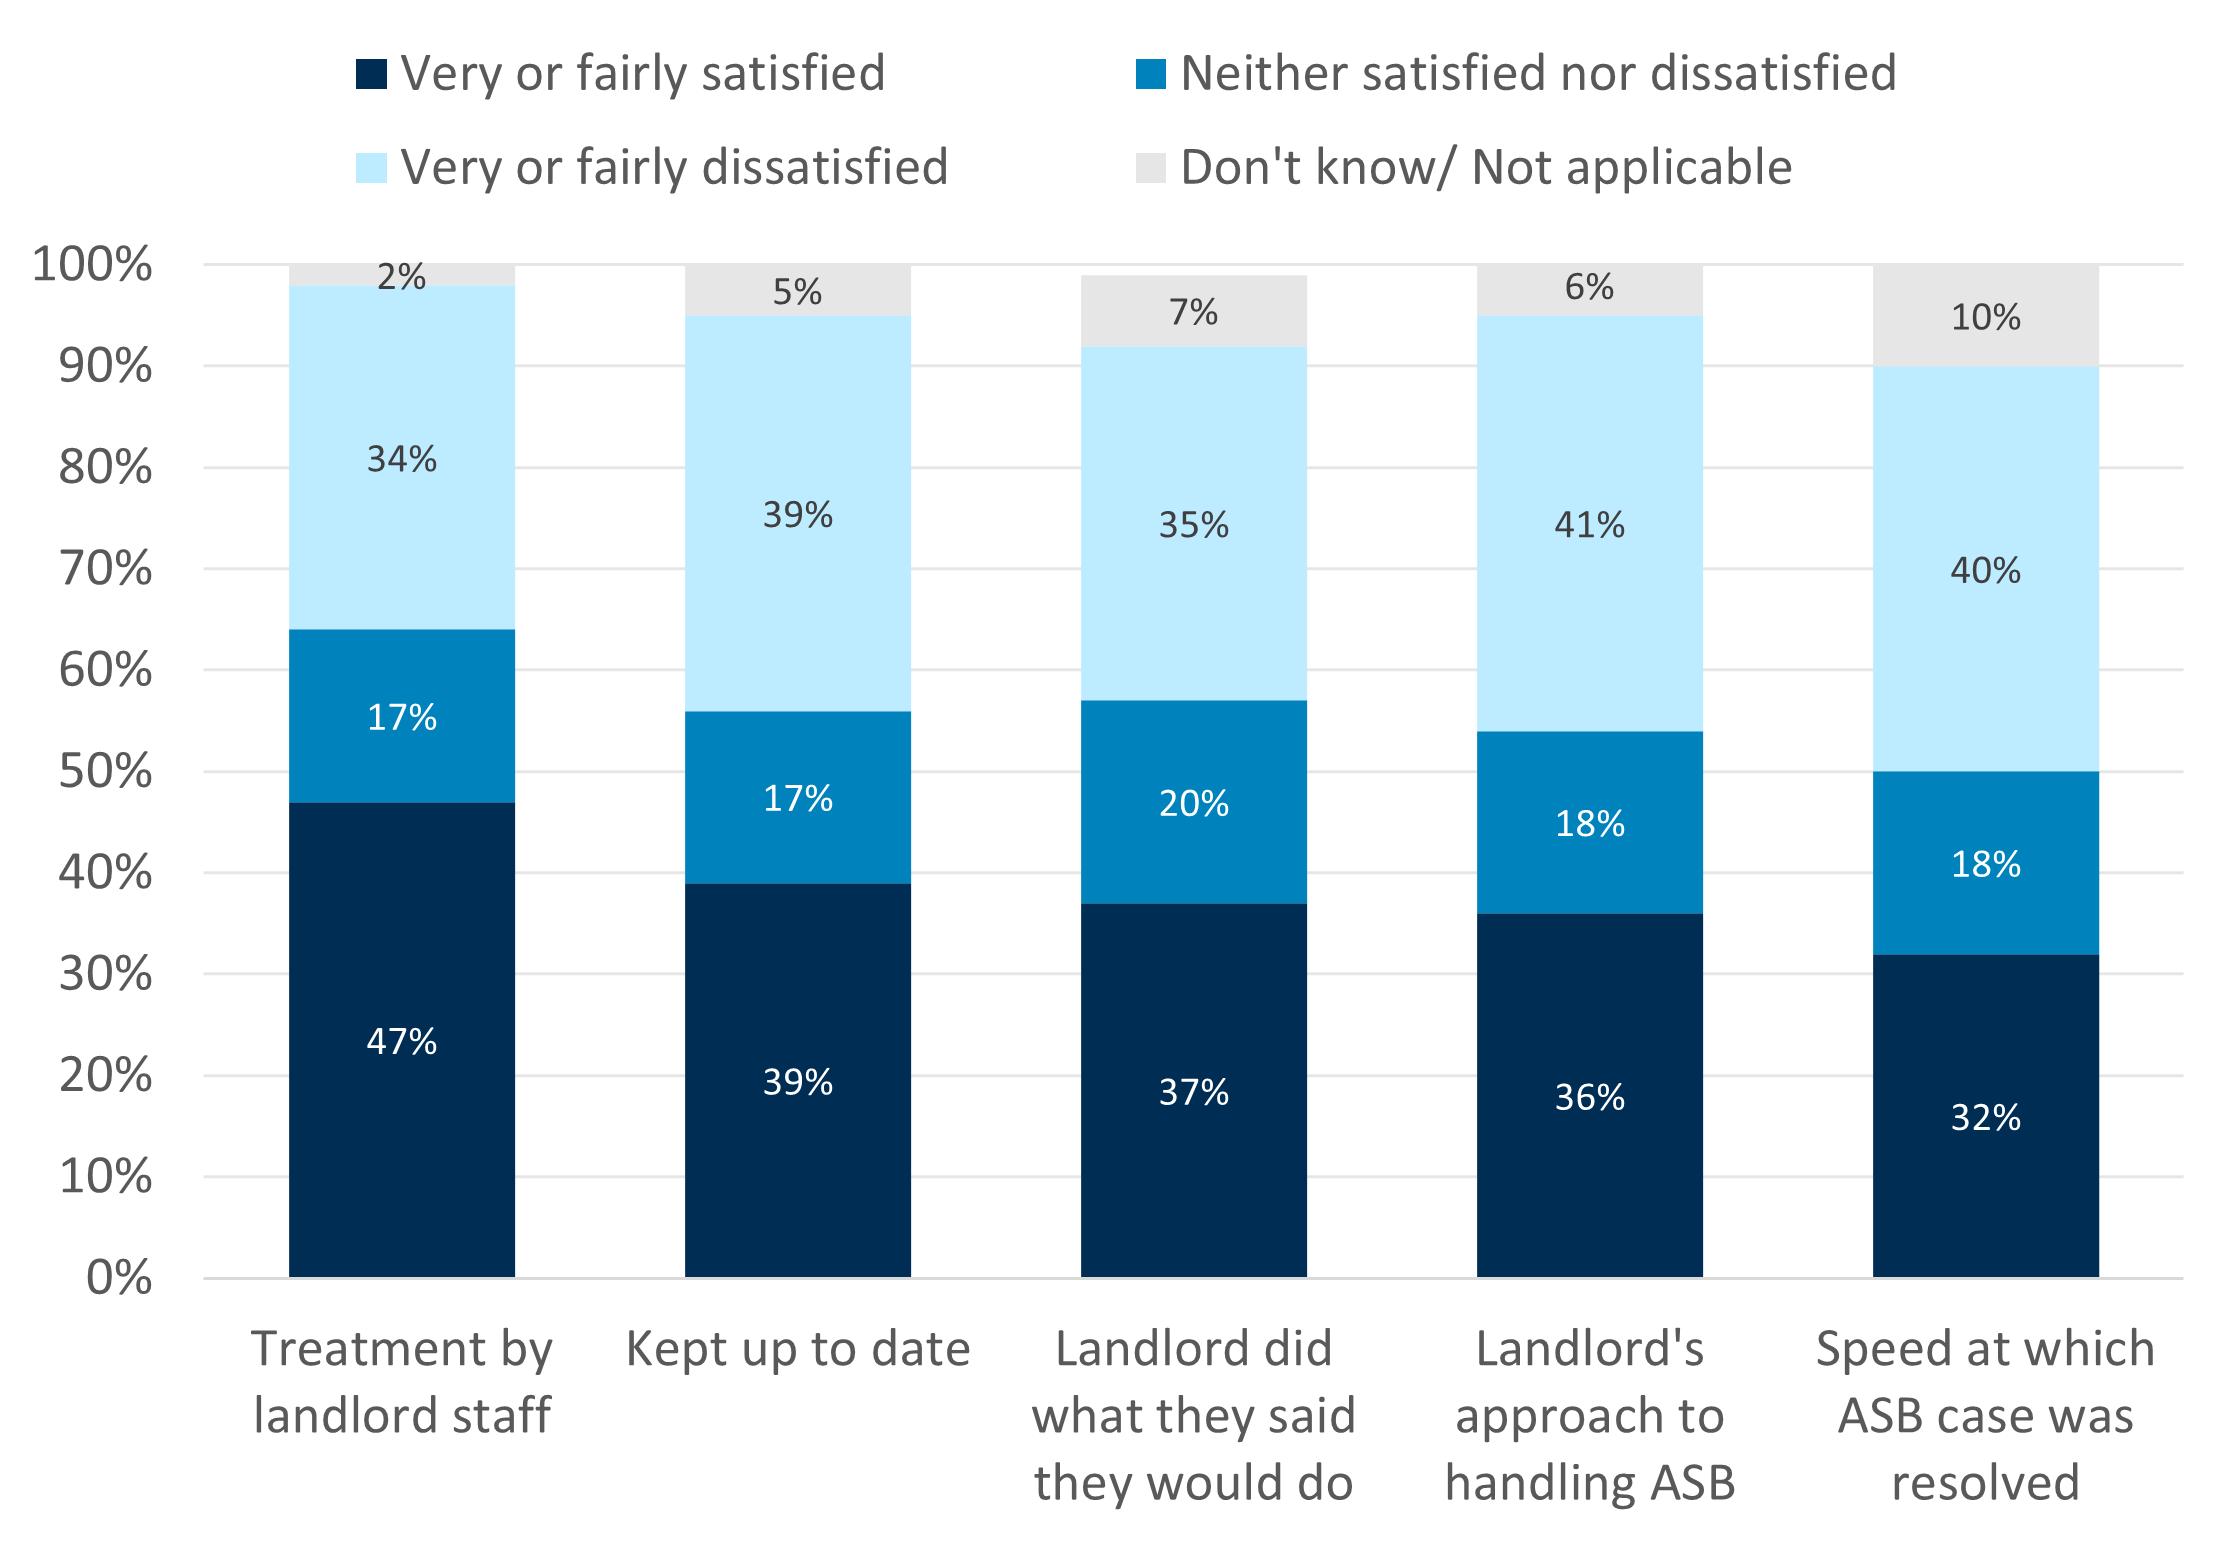
Source: Consumer Scotland Social renters survey, D15. Thinking about the most recent antisocial behaviour (ASB) you reported, how satisfied or dissatisfied are you...? N = 223.
Other issues
Similarly, 17% of respondents have raised any other type of issue (other than repairs, complaints or anti-social behaviour) with their landlord in the last 12 months.
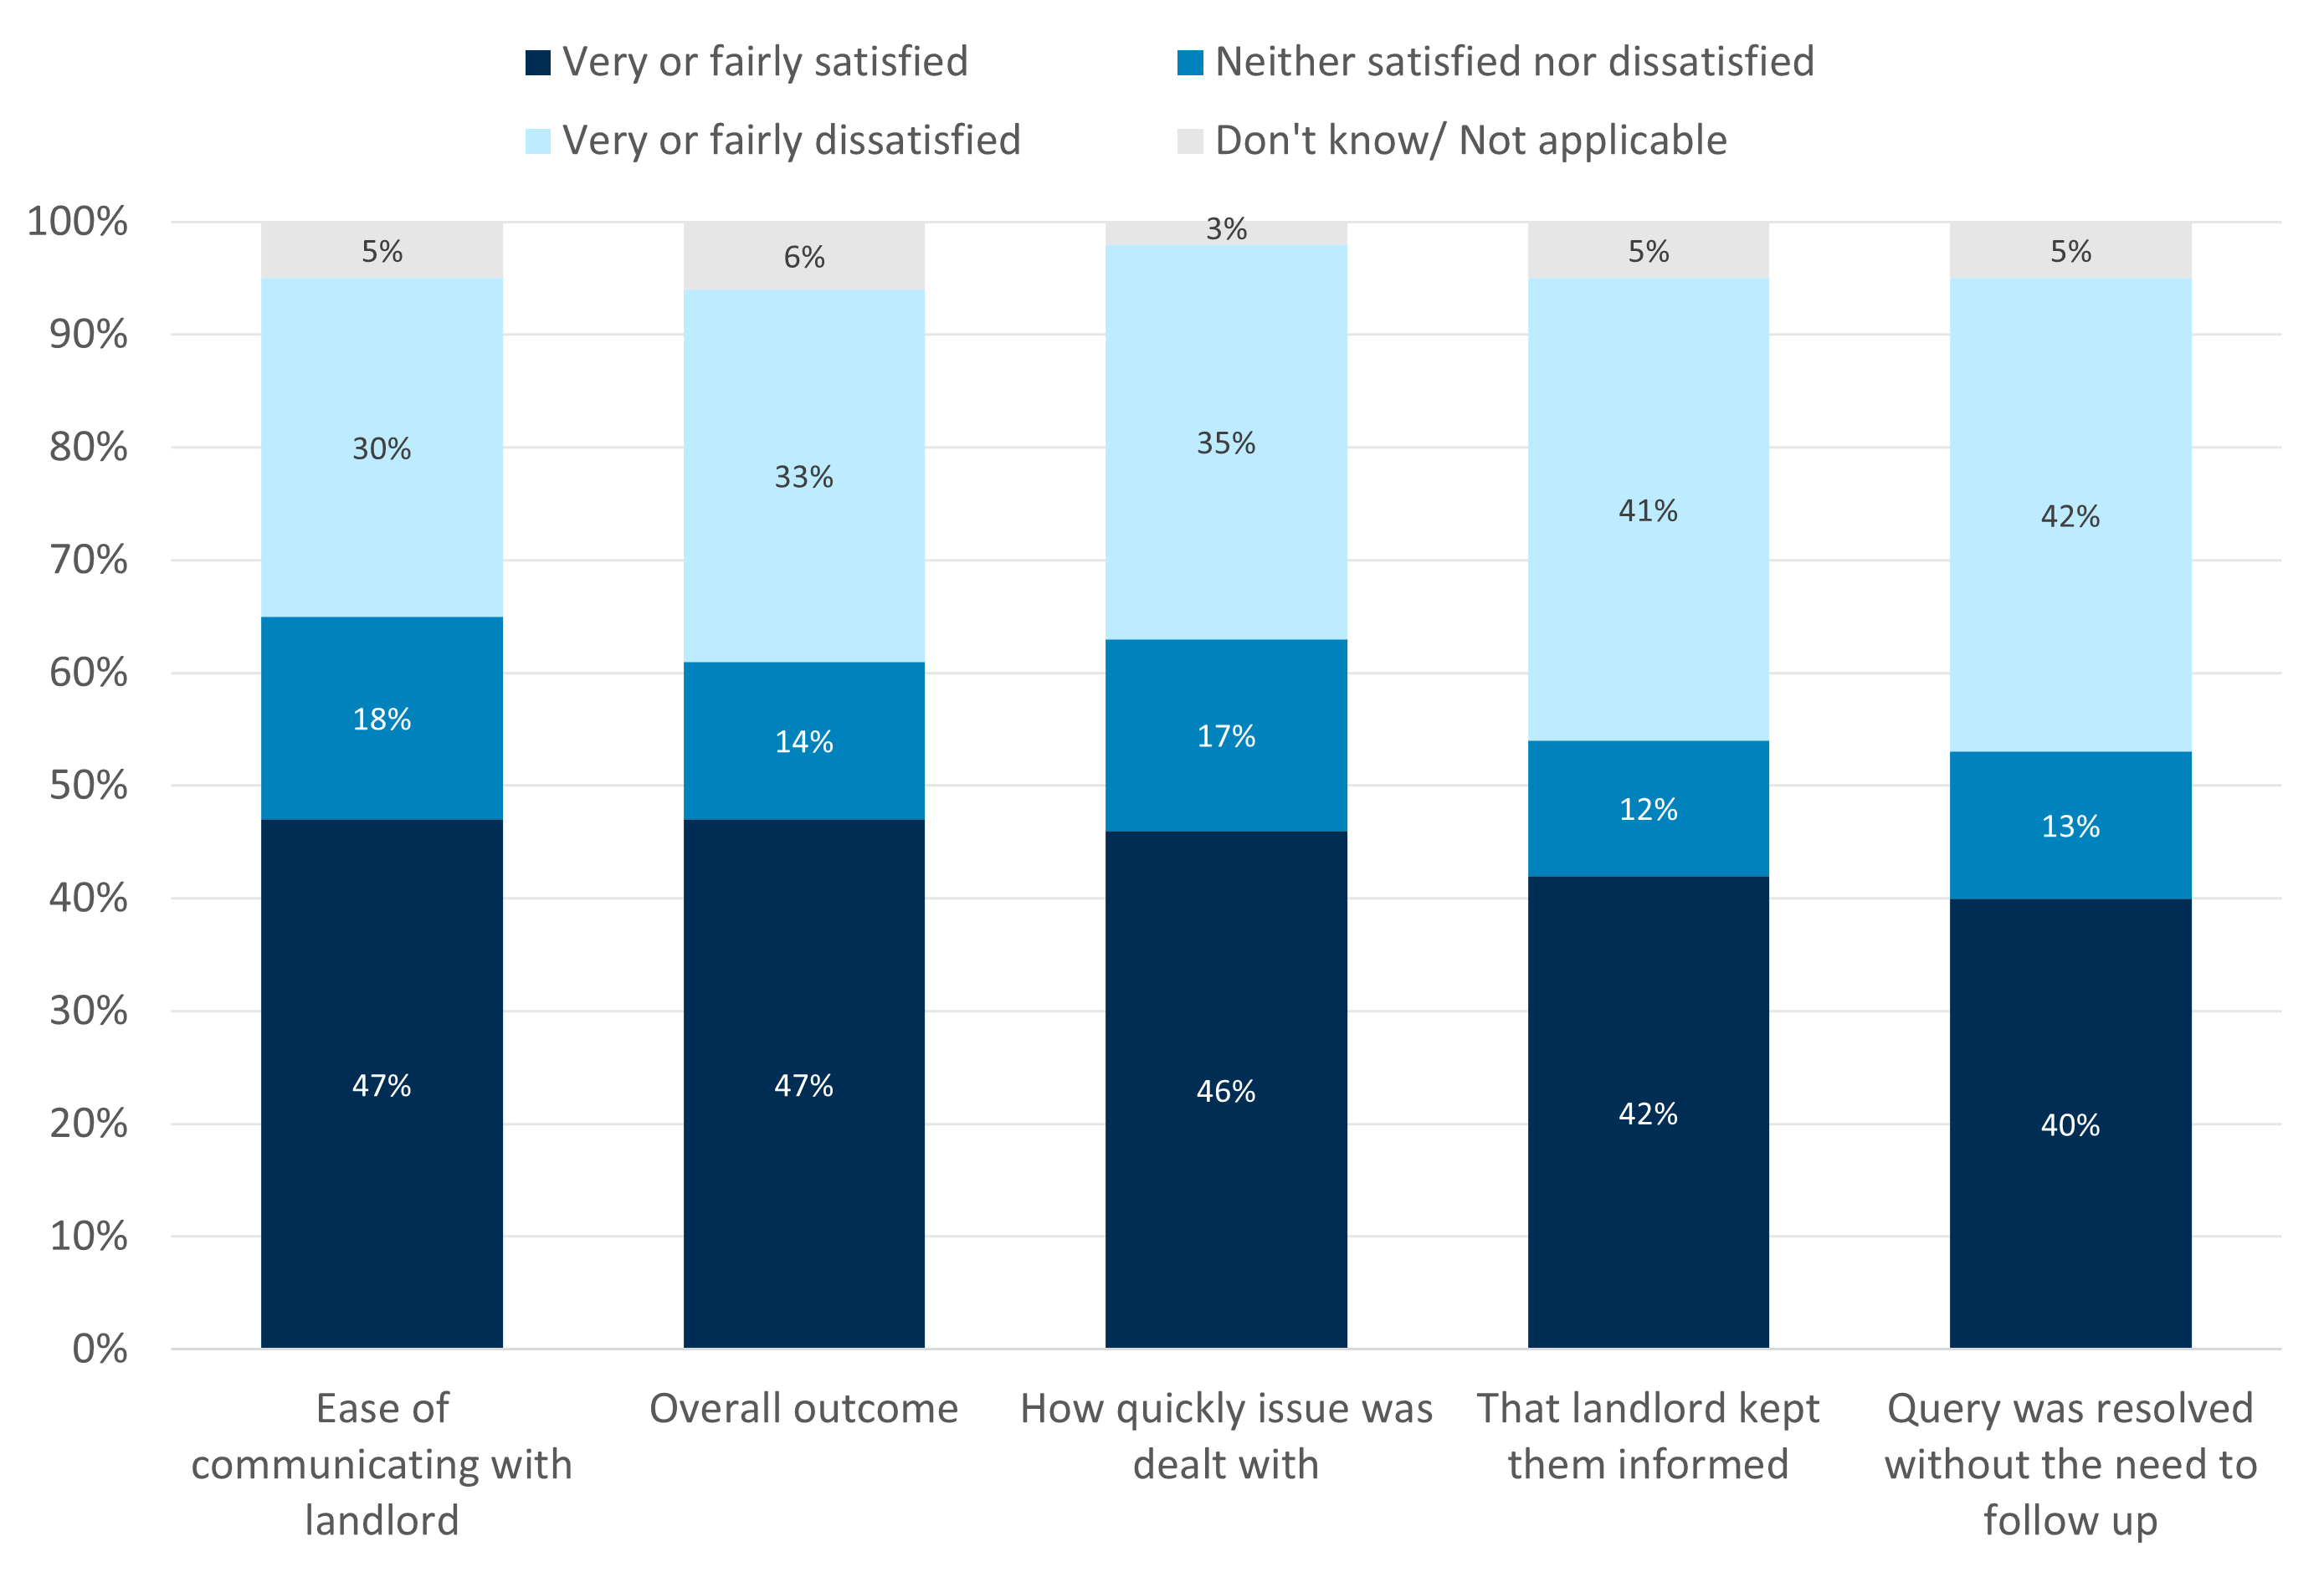
Again, respondents rated this experience negatively – with under half (40-47%) being satisfied by any individual aspect (Chart 23). The most positively rated aspect was ease of communicating with landlord (47%), and the poorest was that the query was resolved without the need to follow up (40%).
Chart 23: Less than half of renters are satisfied with their landlord’s handling of other issues
Of those who had reported any other issue to their landlord, satisfaction with their most recent interaction with their landlord
Source: Consumer Scotland Social renters survey, D16. Thinking about your most recent interaction with your landlord, how satisfied or dissatisfied are you...? N = 240.
Taken together, these findings suggest that while satisfaction with repairs is generally high, satisfaction with how complaints and other issues are handled is much lower. In particular, renters are least satisfied with the speed of resolution and the extent to which they are kept informed throughout the process.
9. Landlord relationship
This chapter examines renters’ relationship with their landlord, including whether they feel listened to and treated fairly and with respect. Most renters feel that they have a good relationship with their landlord, and that they are easy to deal with. However, this was lower among some renters, particularly those aged 35-44 and those living in older properties (over 10 years old) that have not been recently renovated.
Satisfaction with landlord
We asked renters about their experience with their landlord (Chart 24). Most (70%) are satisfied that their landlord is easy to deal with, and only 15% are dissatisfied. Fewer (59%) renters are satisfied that their landlord listens to their views and acts upon them (and 18% are dissatisfied).
Chart 24: Renters are generally satisfied that their landlord is easy to deal with and listens to their views and acts upon them
Percentage of respondents rating their satisfaction with their landlord
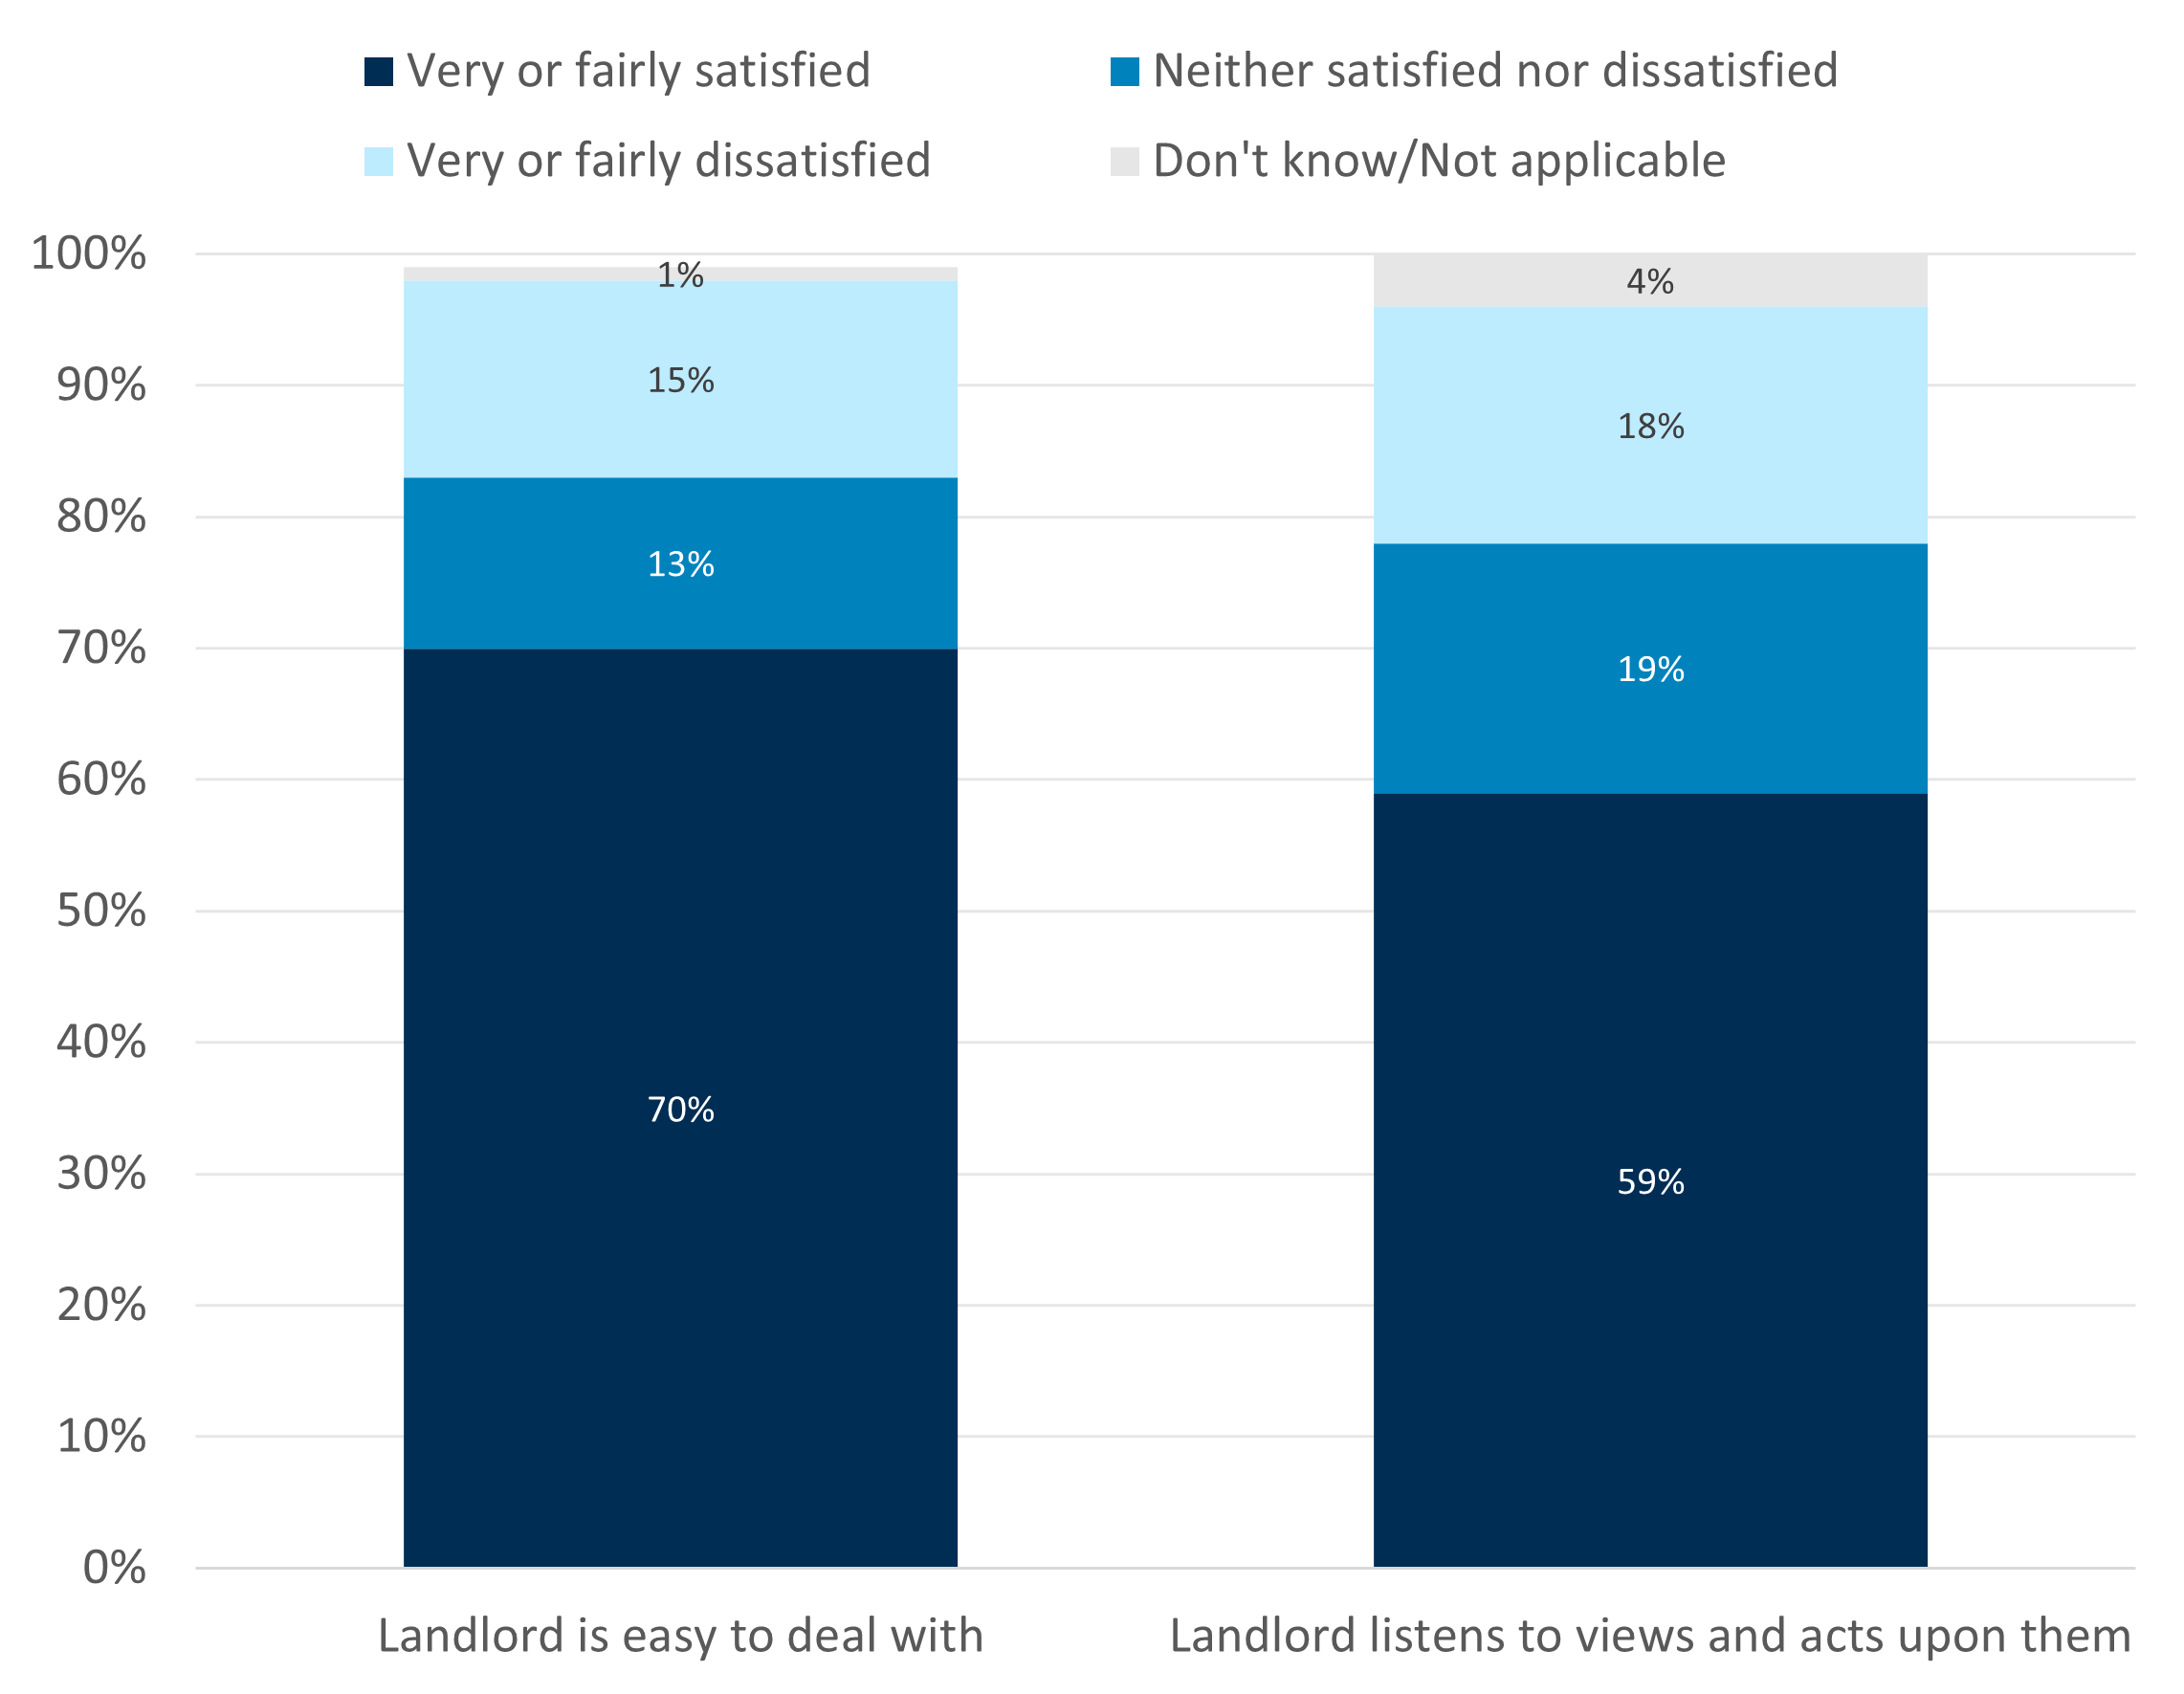
Source: Consumer Scotland Social renters survey, A3. How satisfied or dissatisfied are you that your landlord...? N = 1,402.
Variation by demographic characteristics
Across both measures, there were statistically significant differences between groups of renters depending on disability, or health condition, renter age, landlord type, and property age (Chart 25).
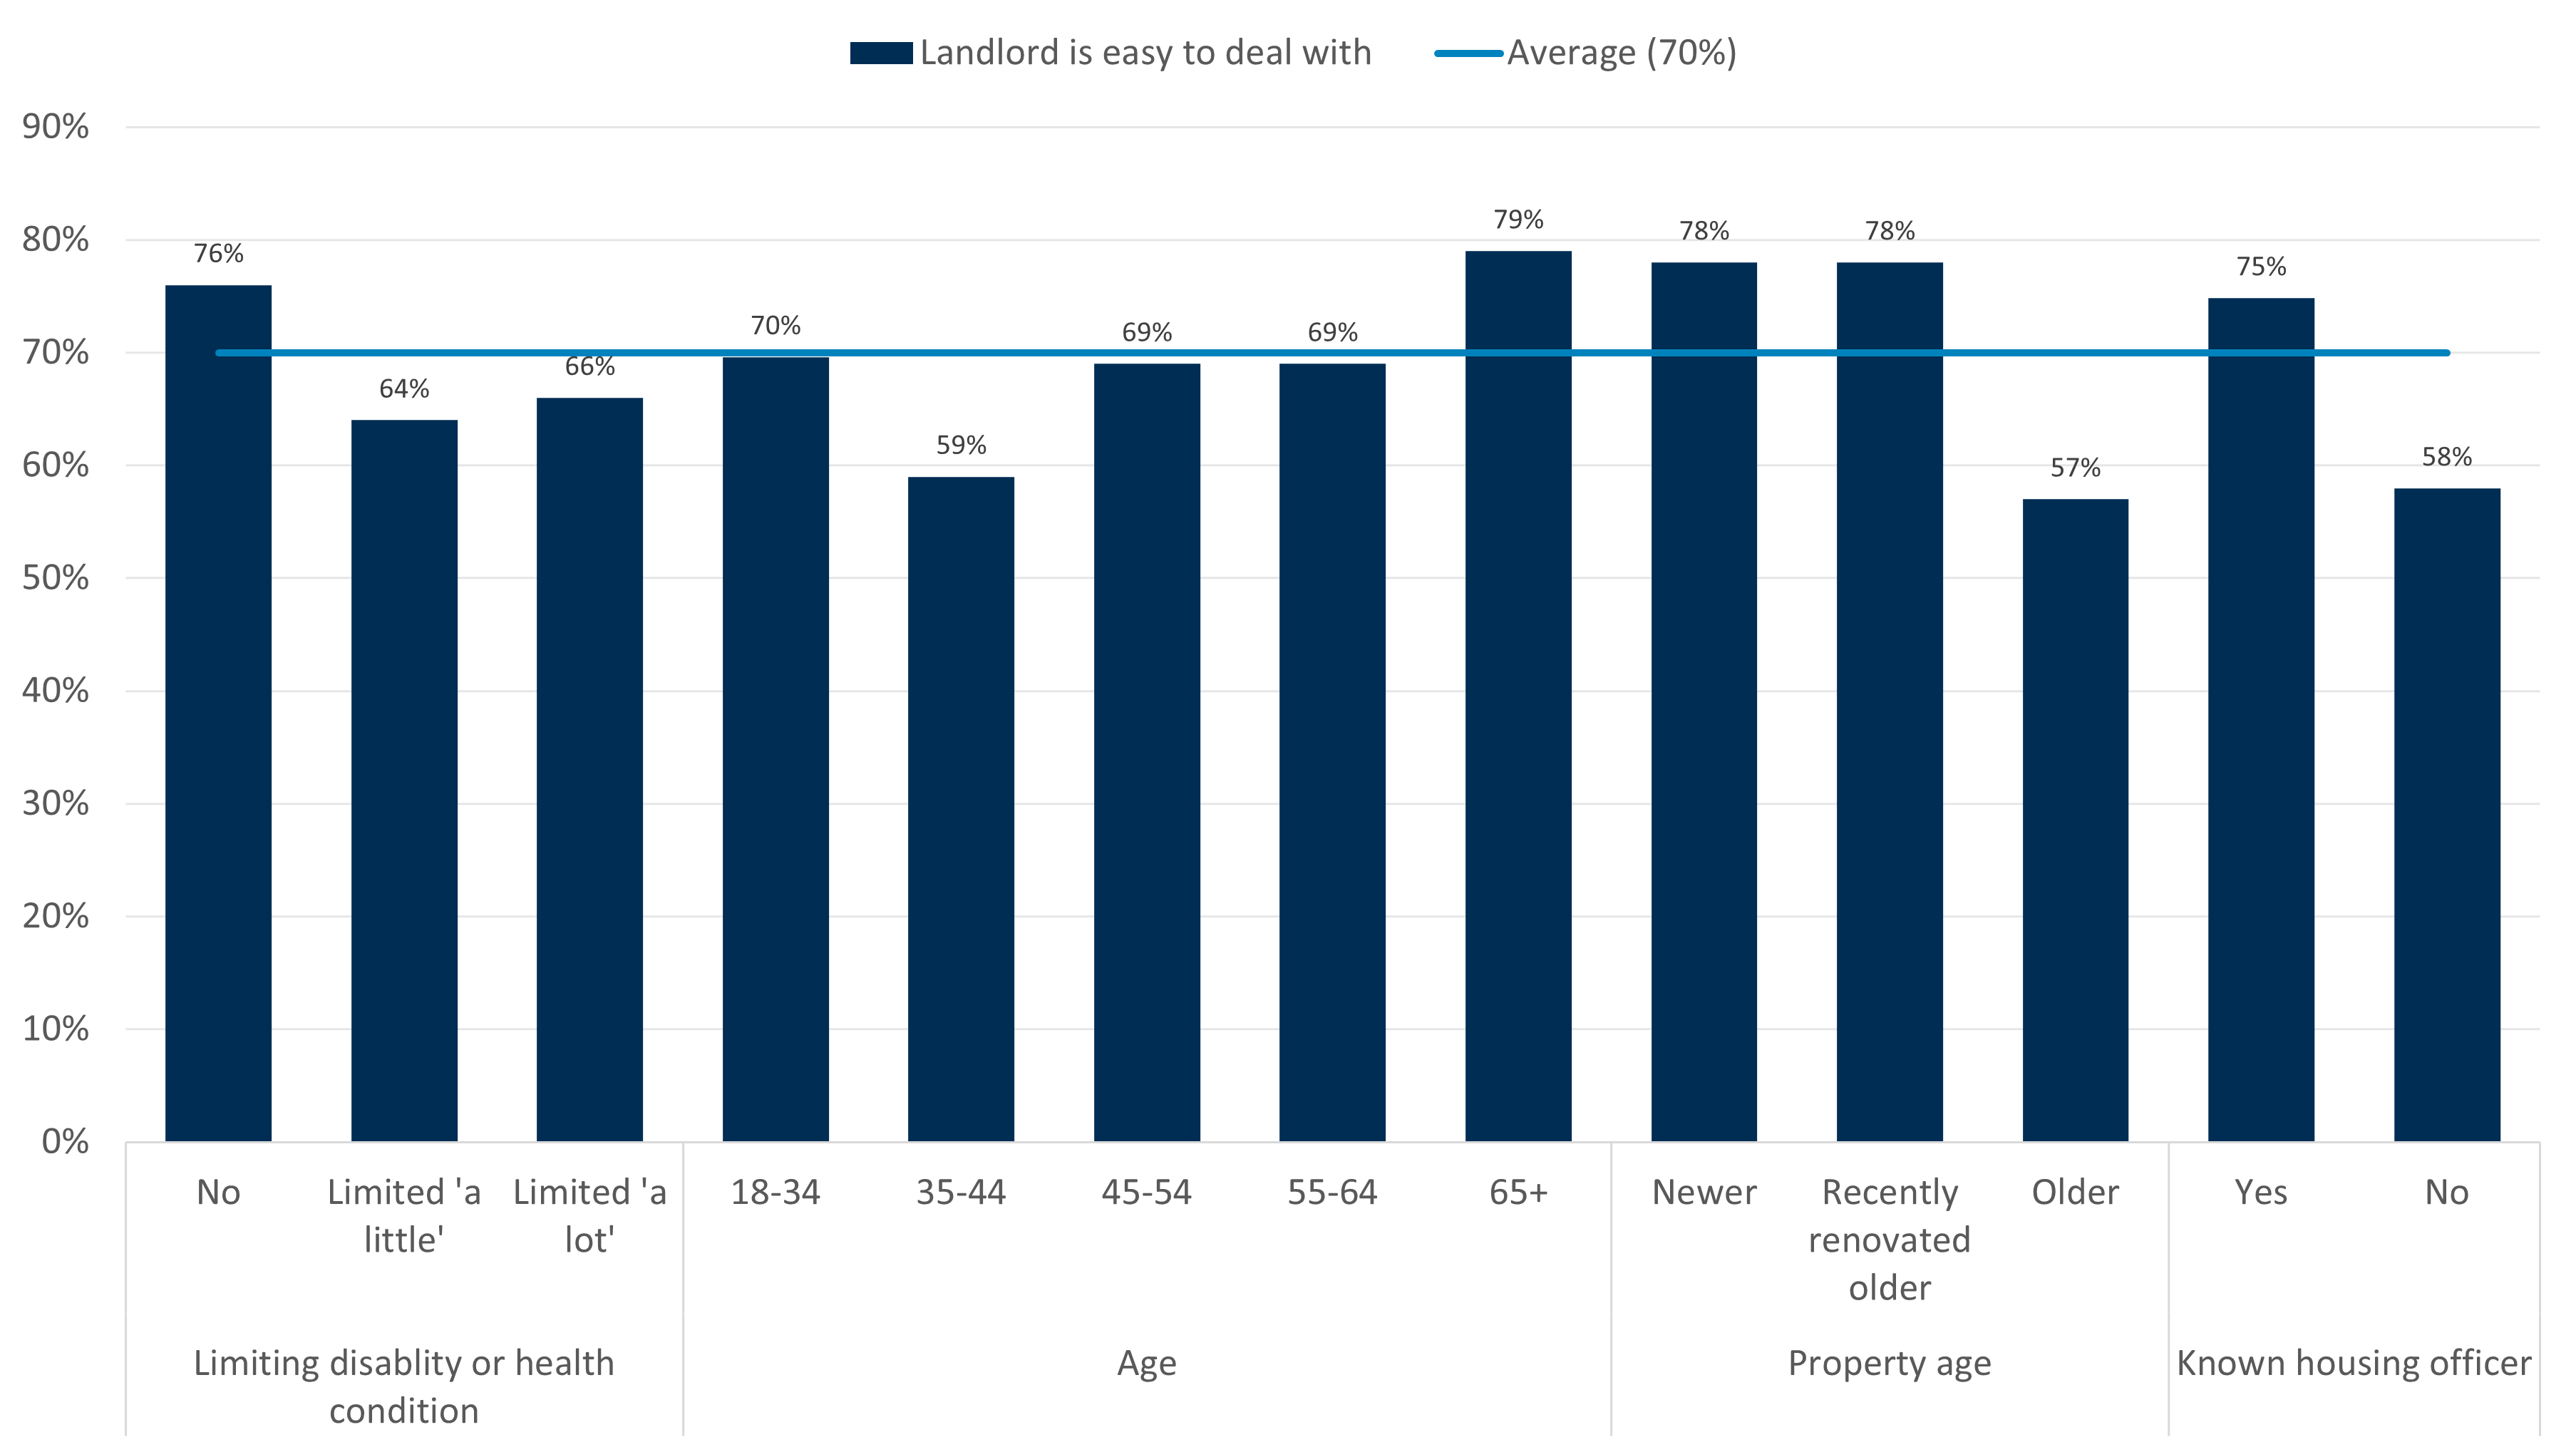
Feeling that their landlord is easy to deal with is lower among:
- Renters who have disabilities or health conditions that limit their day-to-day activities ‘a little’ (64%) or ‘a lot’ (66%) compared with those without (76%)
- Renters aged 35-44 (59%) compared with those aged 65+ (79%)
- Renters living in older unrenovated properties (over 10 years old and not recently renovated, 57%) compared with newer (78%) or recently renovated older (78%) properties
- Renters without a known housing officer (58%) compared with those with one (75%)
Chart 25: Feeling that their landlord is easy to deal with is lowest among renters living in older properties (over 10 years old) that have not been recently renovated, at 57%
Percentage of respondents who are ‘fairly satisfied’ or ‘very satisfied’ that their landlord is easy to deal with, by demographics
Source: Consumer Scotland Social renters survey, A3-2. How satisfied or dissatisfied are you that your landlord...is easy to deal with? N = 1,402.
A similar pattern emerges when looking at whether renters feel their landlord listens to their views and acts upon them. The groups who are less likely to feel this are: renters aged 35-44; those with disabilities or health conditions that limit their day-to-day activities; those living in older unrenovated properties; and those without a known housing officer (Chart 26).
However, there are additional effects of landlord type and household type:
- Only 54% of those renting from councils feel that their landlord listens to their views and acts upon them, compared with 65% among housing association renters.
- Less than half (48%) of single adult households feel that their landlord listens to their views and acts upon them, compared with 61% of other household types.
Chart 26: Less than half of renters aged 35-44, those living in older properties (over 10 years old) that have not been recently renovated, and those without a known housing officer feel that their landlord listens to their views and acts upon them
Percentage of respondents who are ‘fairly satisfied’ or ‘very satisfied’ that their landlord listens to their views and acts upon them, by demographics
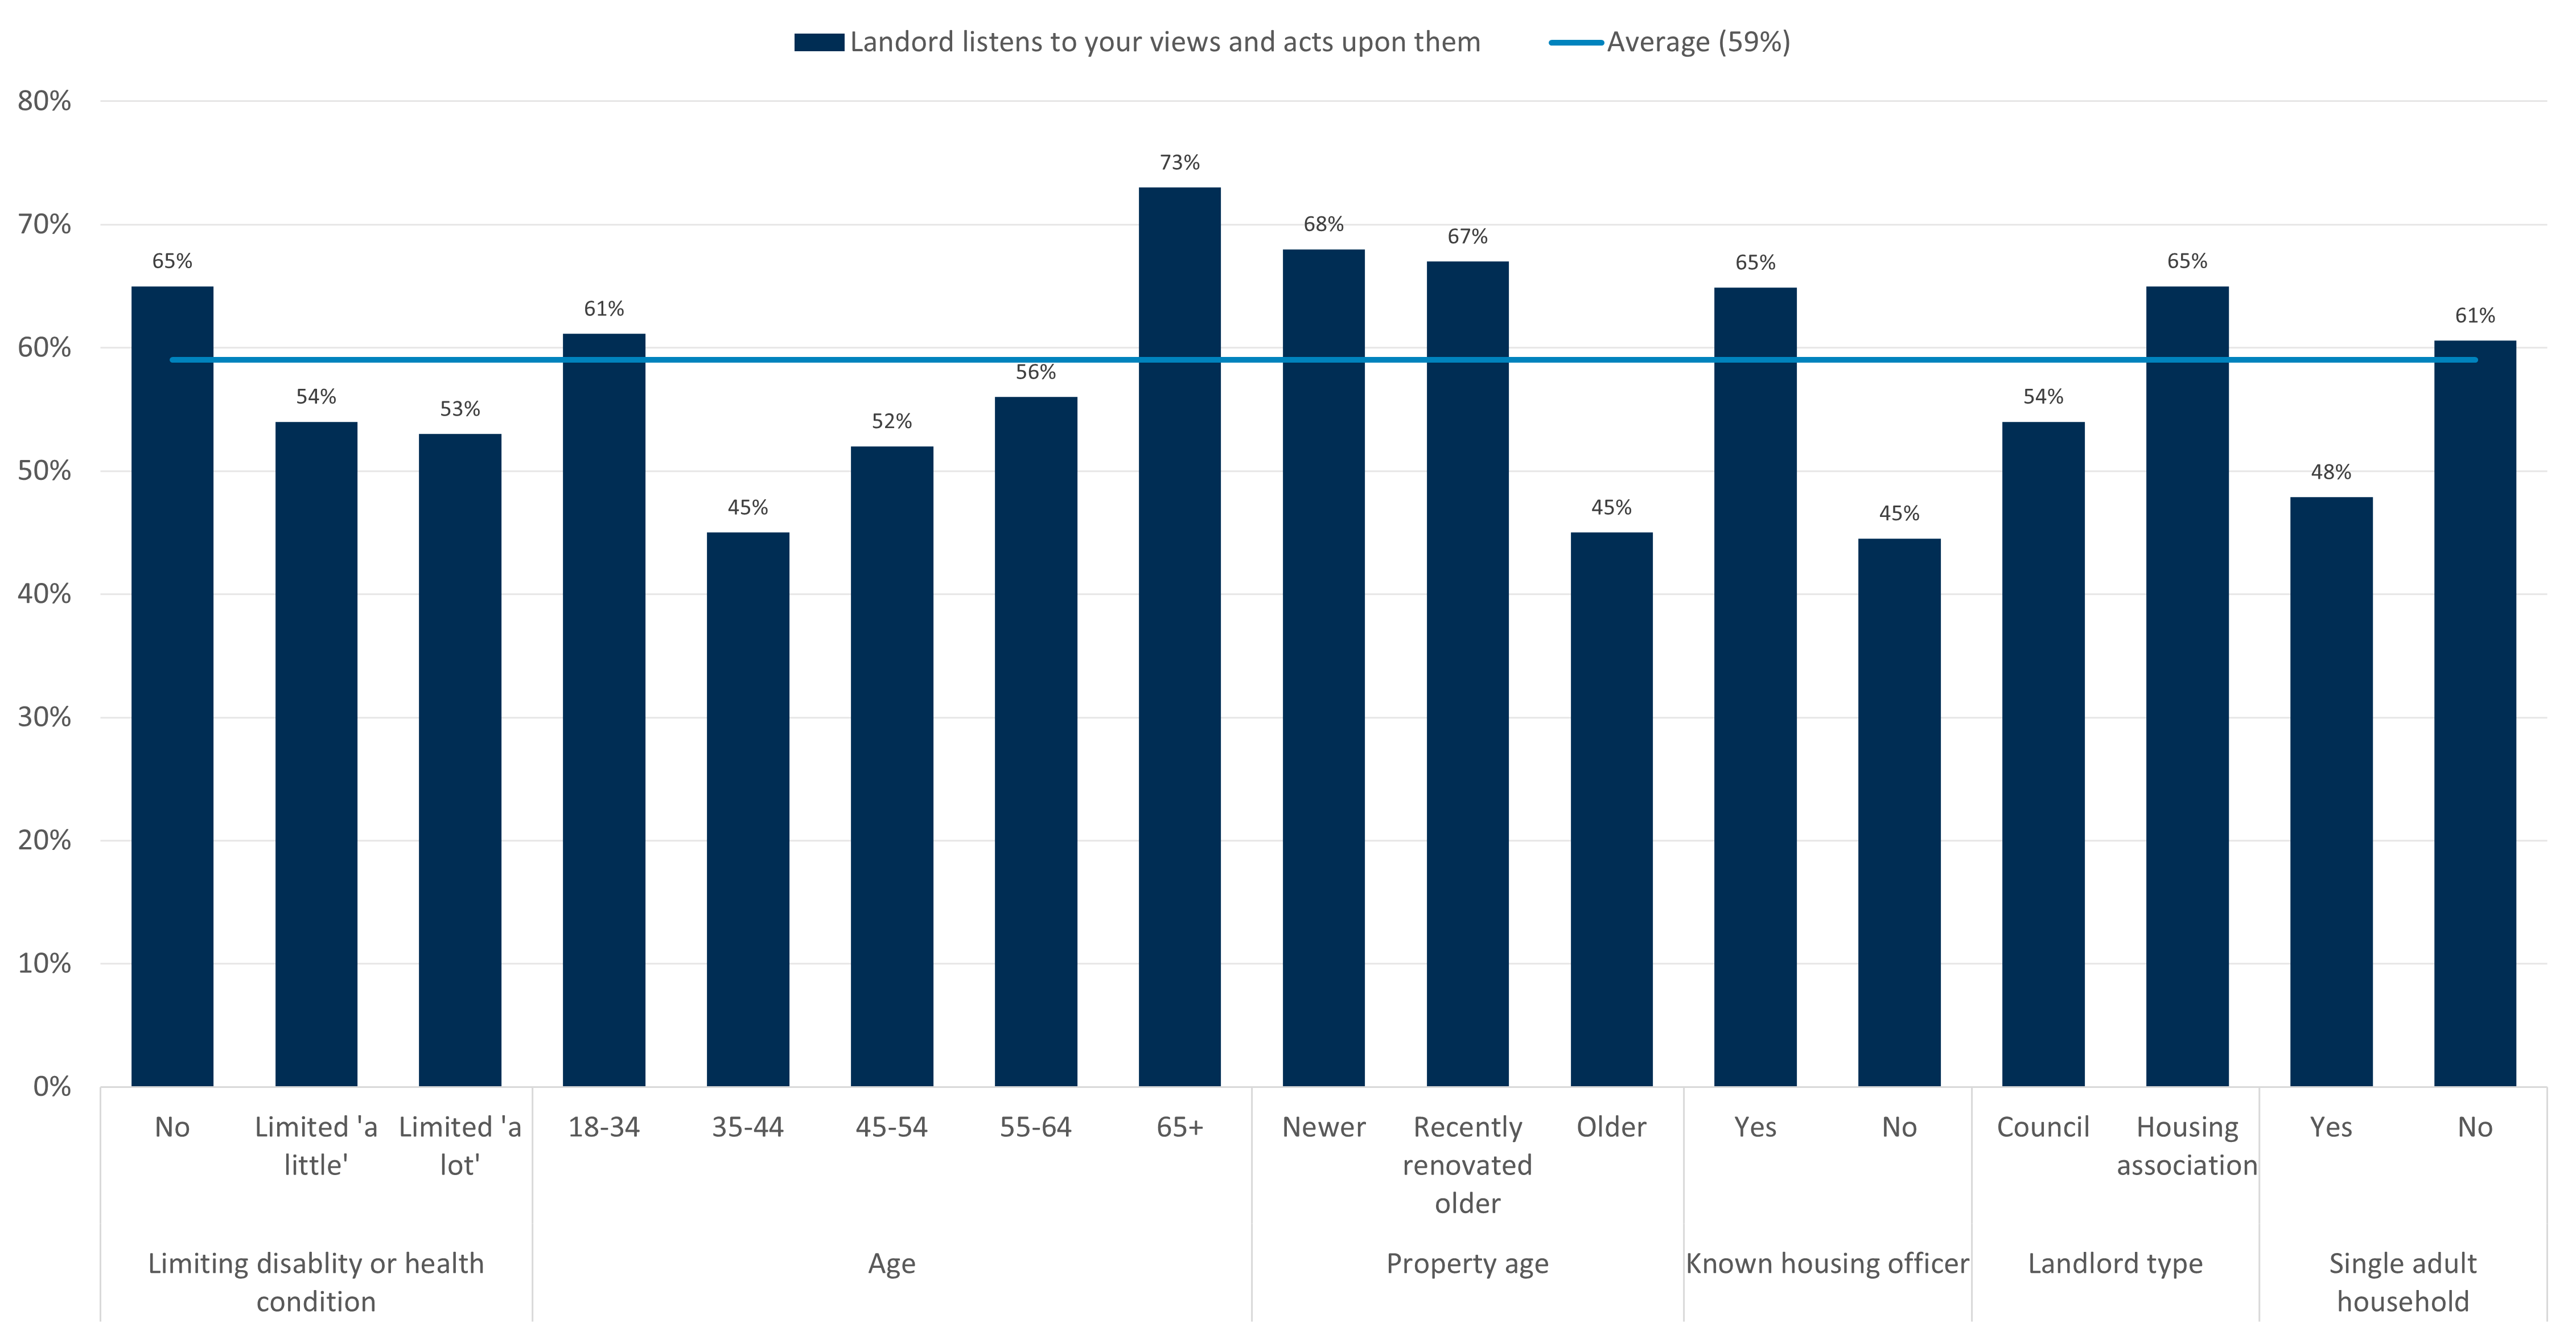
Source: Consumer Scotland Social renters survey, A3. How satisfied or dissatisfied are you that your landlord...listens to your views and acts upon them? N = 1,402.
Fairness, respect and relationship quality
Most (69%) renters agree that their landlord treats them fairly and with respect, while 10% disagree. Slightly fewer (59%) agree that they have a good relationship with their landlord, while 11% disagree (Chart 27).
Chart 27: Most renters feel that their landlord treats them fairly and with respect
Extent to which renters agree with statements about their landlord
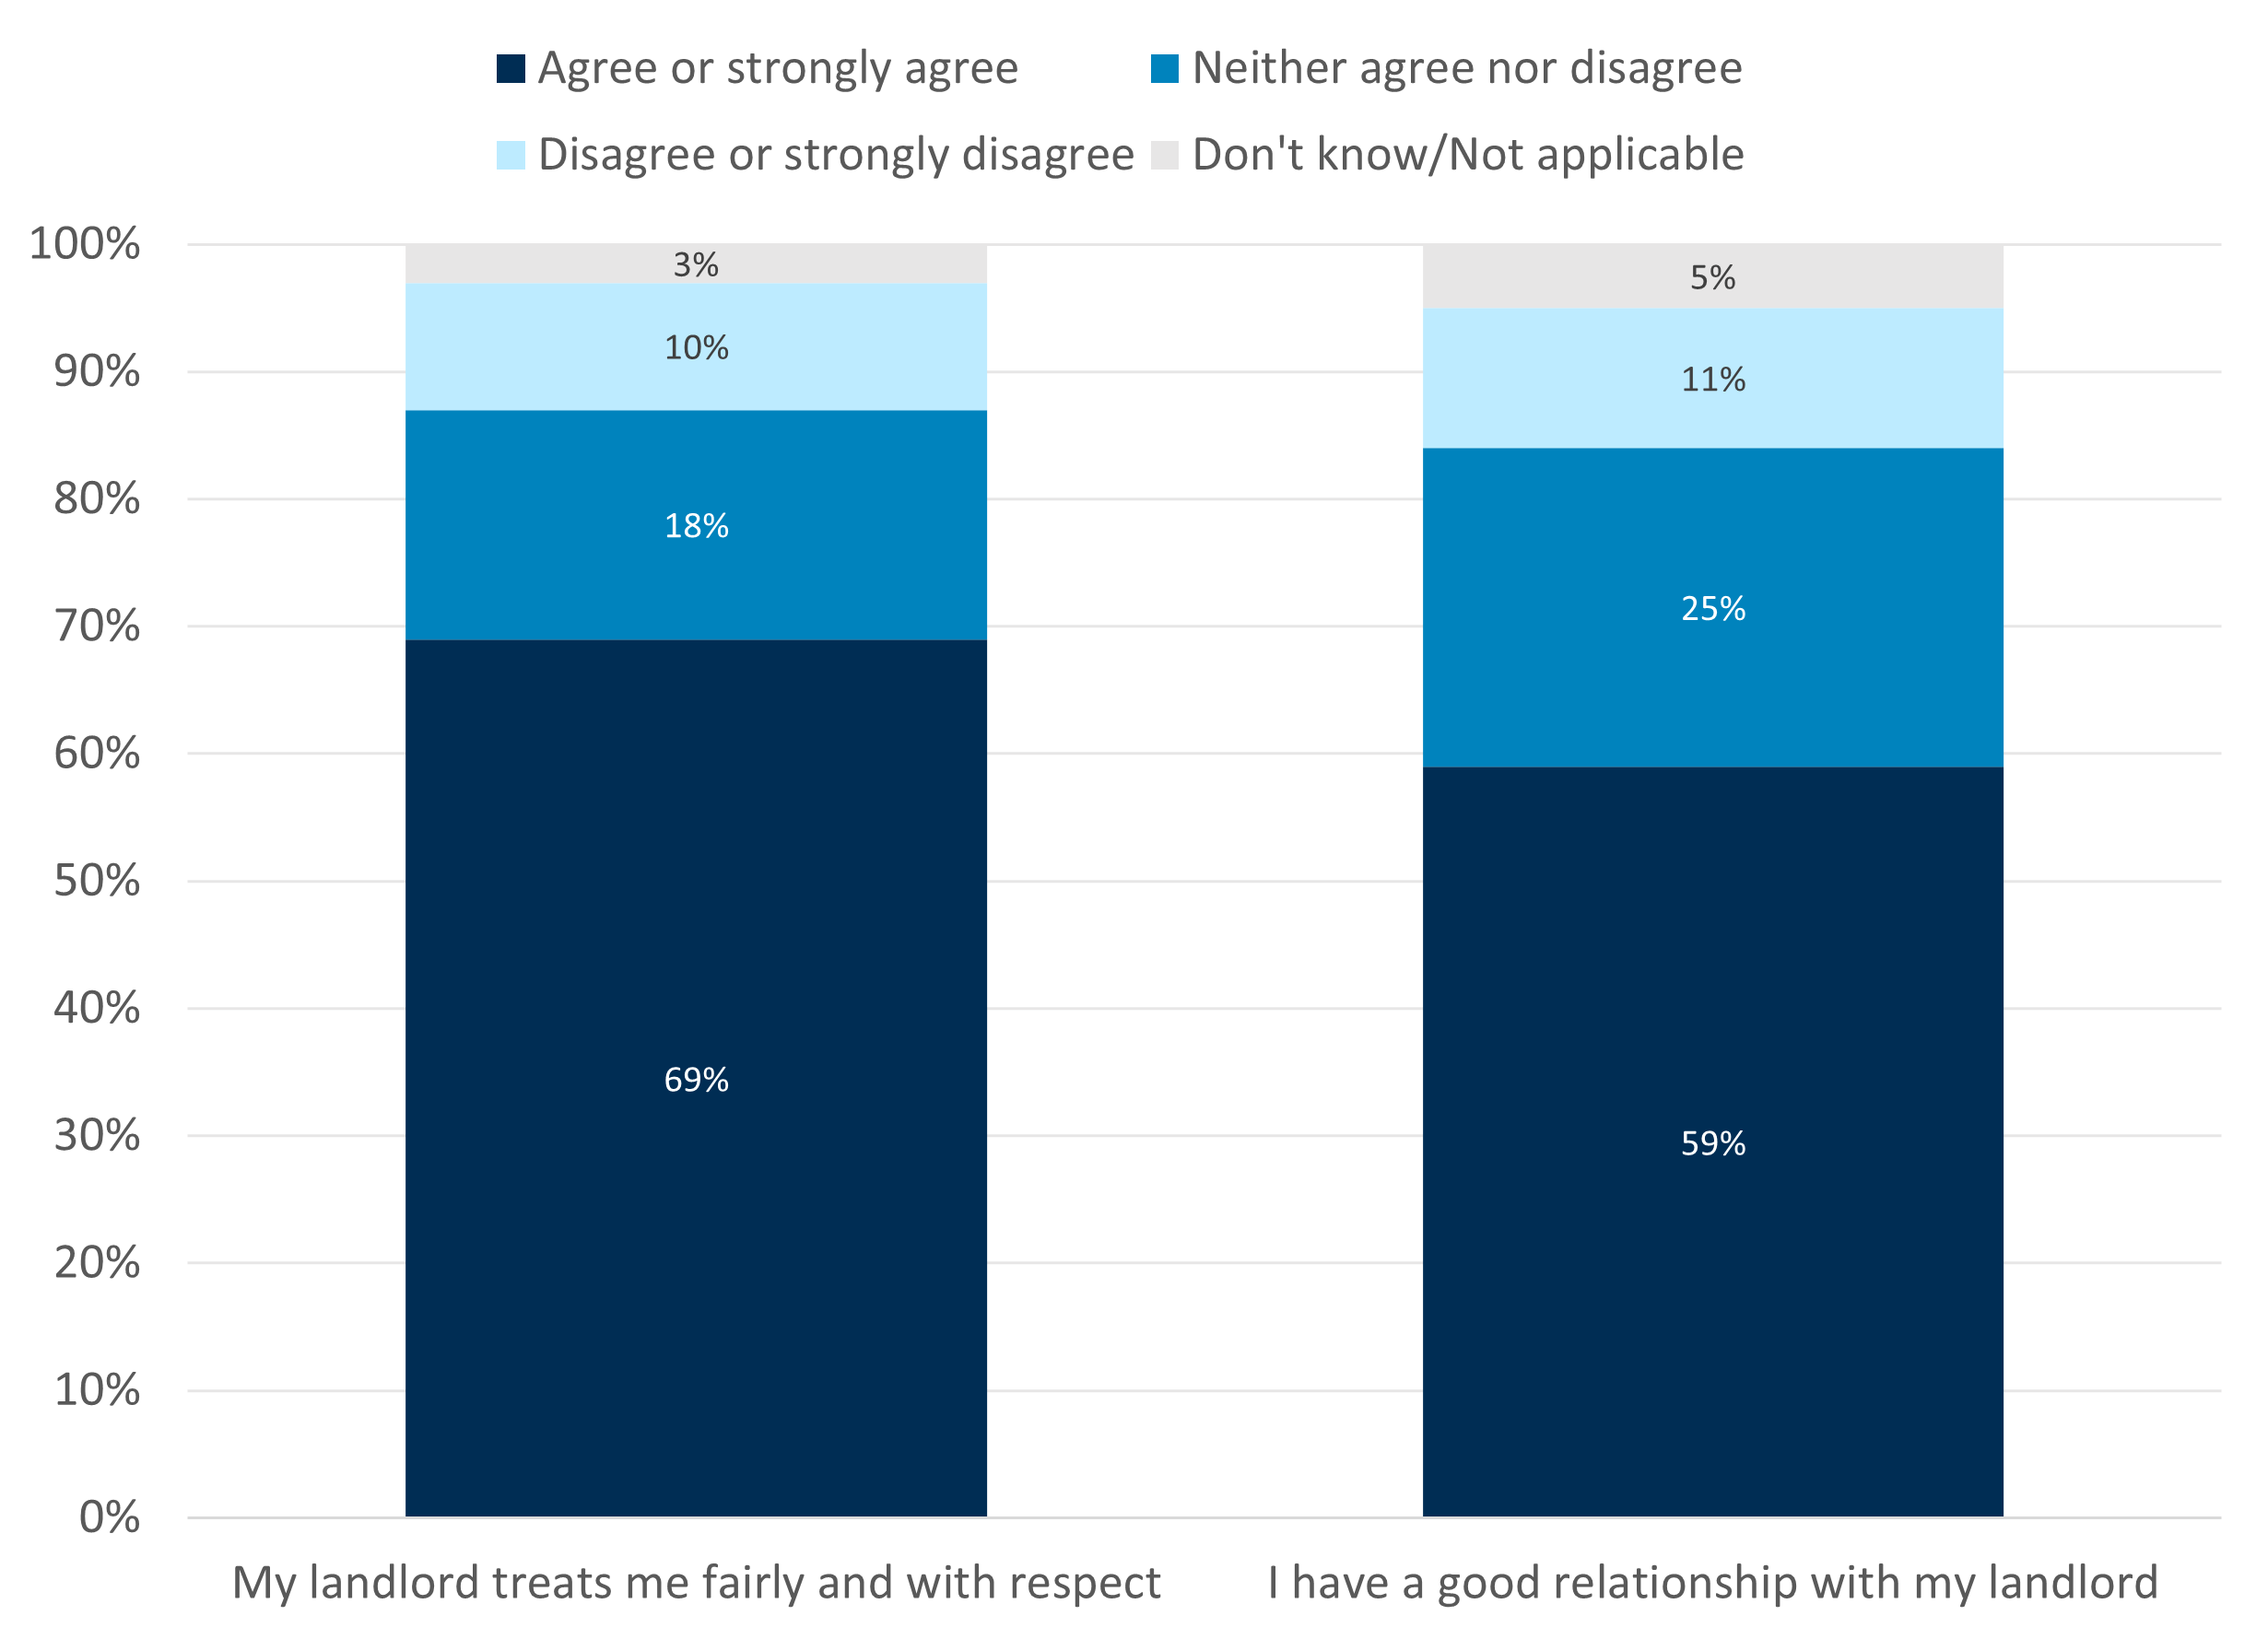
Source: Consumer Scotland Social renters survey, A4. To what extent do you agree or disagree with the following statements? N = 1,402.
Variation by demographic characteristics
Again, similar groups of renters are less likely to report that their landlord treats them fairly and with respect (Chart 28):
- Renters who have disabilities or health conditions that limit their day-to-day activities ‘a lot’ (65%) compared with those without (75%)
- Renters aged 35-44 (60%) compared with 65+ (78%)
- Lower-income households (up to £19,999, 66%) compared with higher income (£40,000 and over, 81%)
- Renters living in older unrenovated properties (over 10 years old and not recently renovated, 56%) compared with newer or recently renovated older (78%) properties
- Renters without a known housing officer (56%) compared with those with one (75%)
Chart 28: Feeling that their landlord treats them fairly and with respect is lower among renters living in older properties (over 10 years old) that have not been recently renovated and those without a known housing officer
Percentage of respondents who ‘agree’ or ‘strongly agree’ that their landlord treats them fairly and with respect, by demographics
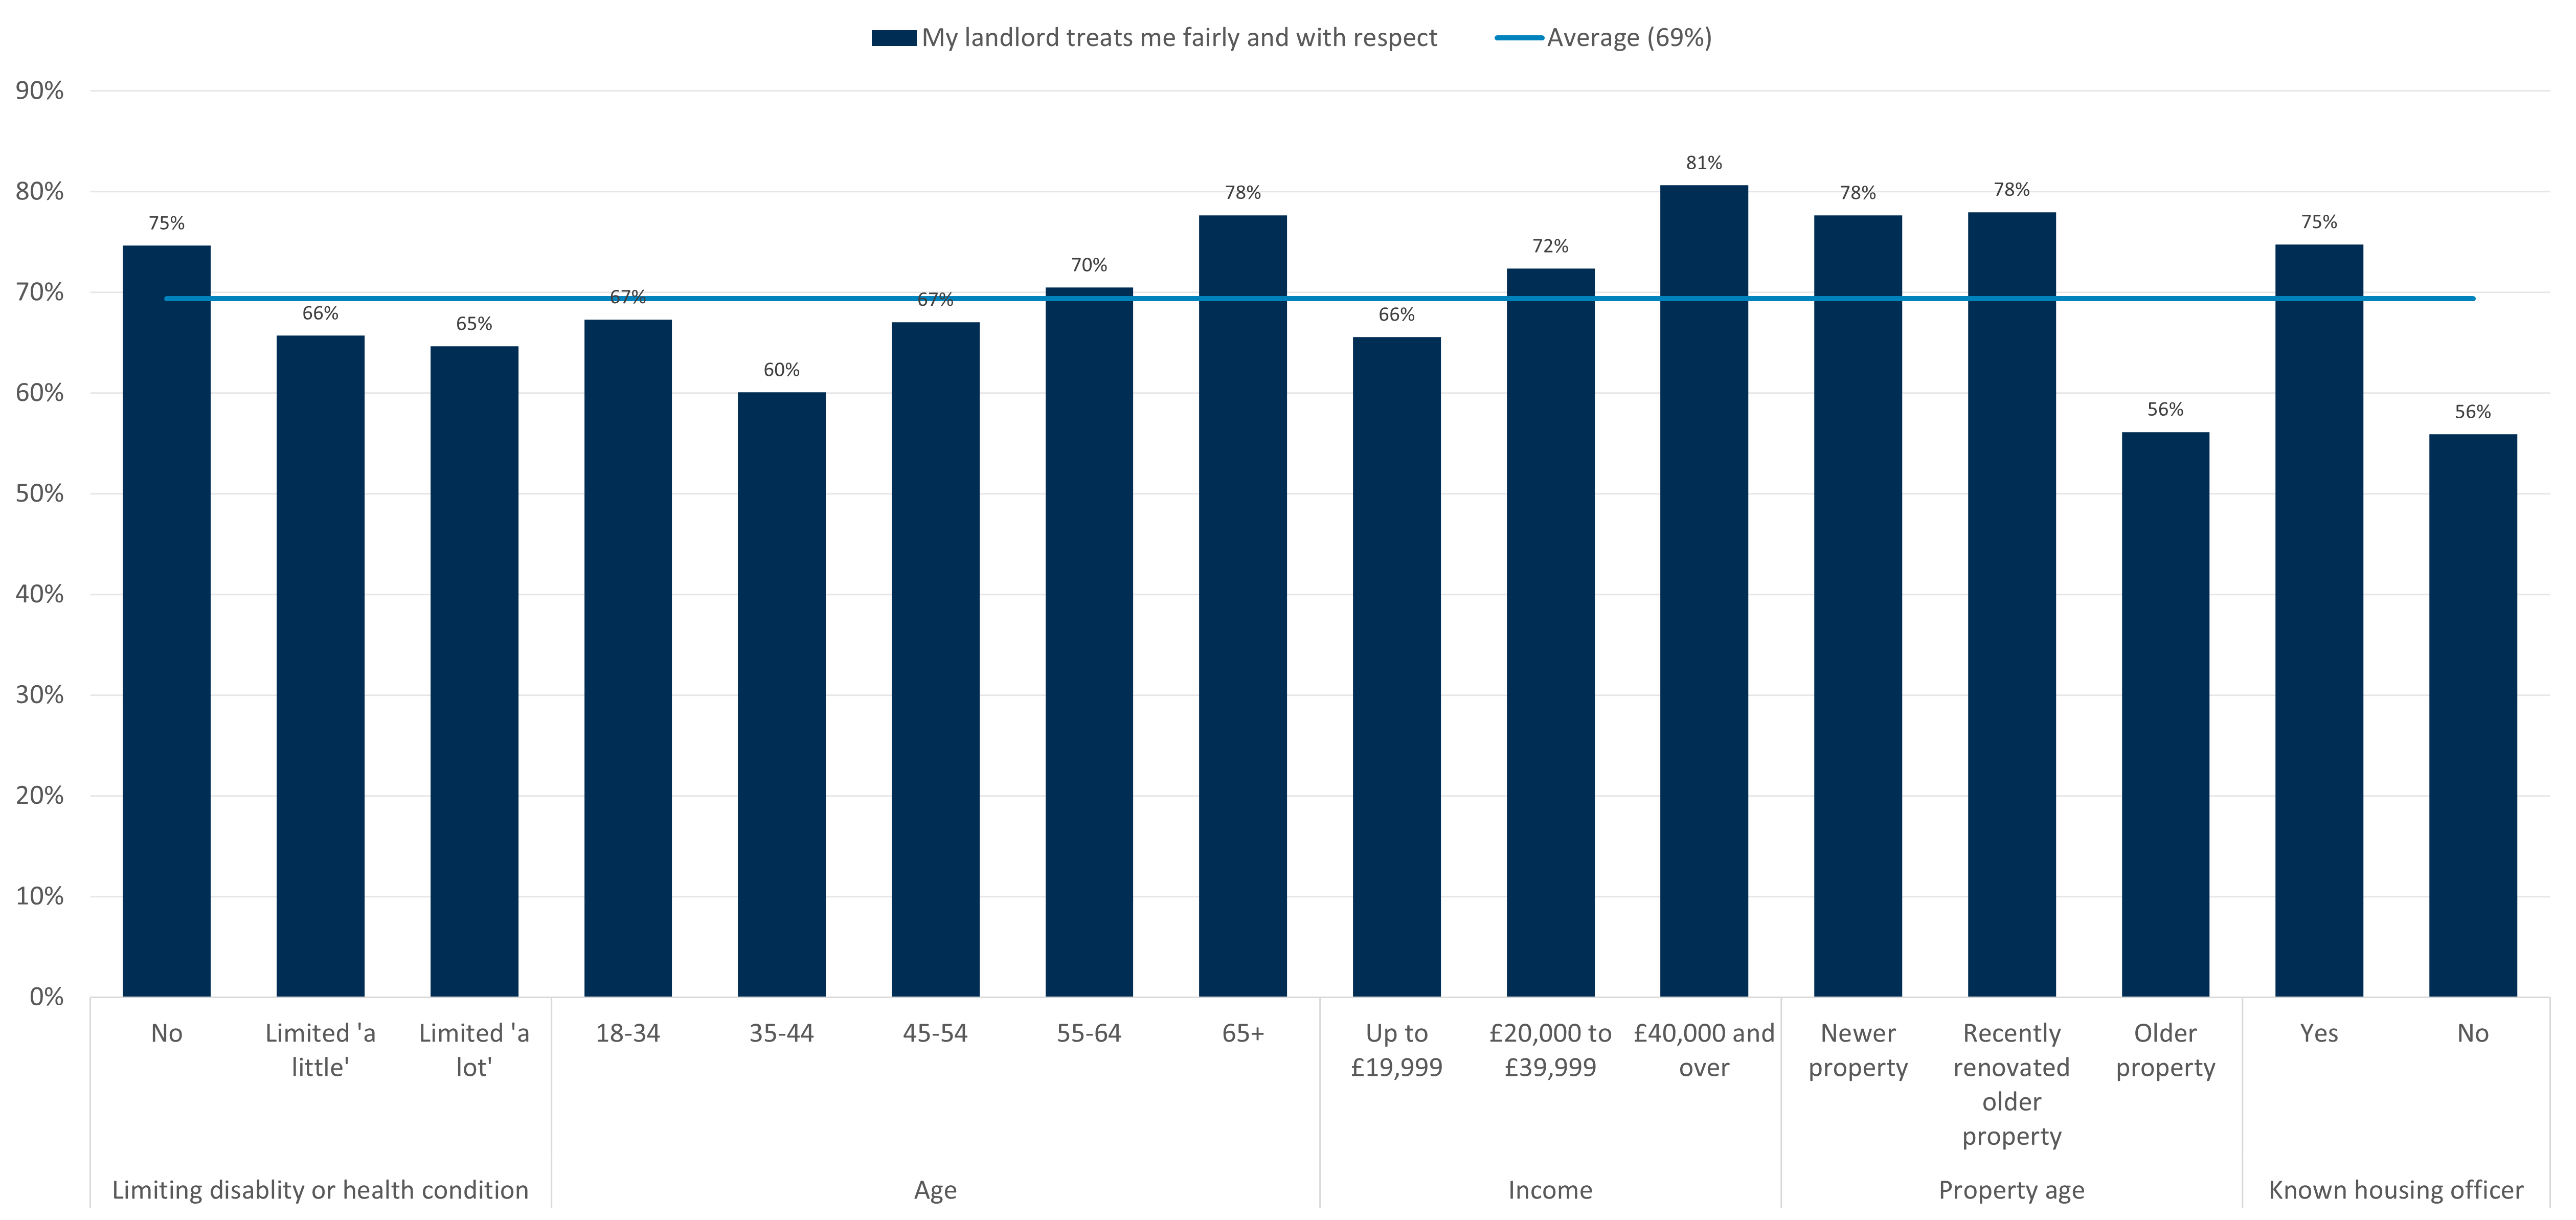
Source: Consumer Scotland Social renters survey, A4. To what extent do you agree or disagree with the following statements: my landlord treats me fairly and with respect. N = 1,402.
These same demographics are also less likely to feel that they have a good relationship with their landlord (Chart 29). But again, there are additional effects of landlord type and household type:
- Only 54% of those renting from councils feel that they have a good relationship with their landlord, compared with 65% among housing association renters
- Less than half (45%) of single adult households feel that they have a good relationship with their landlord, compared with 61% of other household types
Although the quality of landlord relationships and communication varies across multiple demographics depending on the exact measure, renters who have a housing officer or named point of contact – and know how to contact them – consistently report better outcomes. While it is not possible to determine whether the presence of a housing officer directly drive these higher ratings, this strong association suggests that this role is are working as intended by strengthening communication between renters and landlords. Notably, this pattern holds even when accounting for other potentially influential renter and property characteristics. This indicates that expanding access to housing officers or improving renters’ awareness and visibility of existing staff members, may help improve renter experiences.
Chart 29: Most renters feel that they have a good relationship with their landlord, but this is lower for some groups of renters
Percentage of respondents who ‘agree’ or ‘strongly agree’ that they have a good relationship with their landlord, by demographics
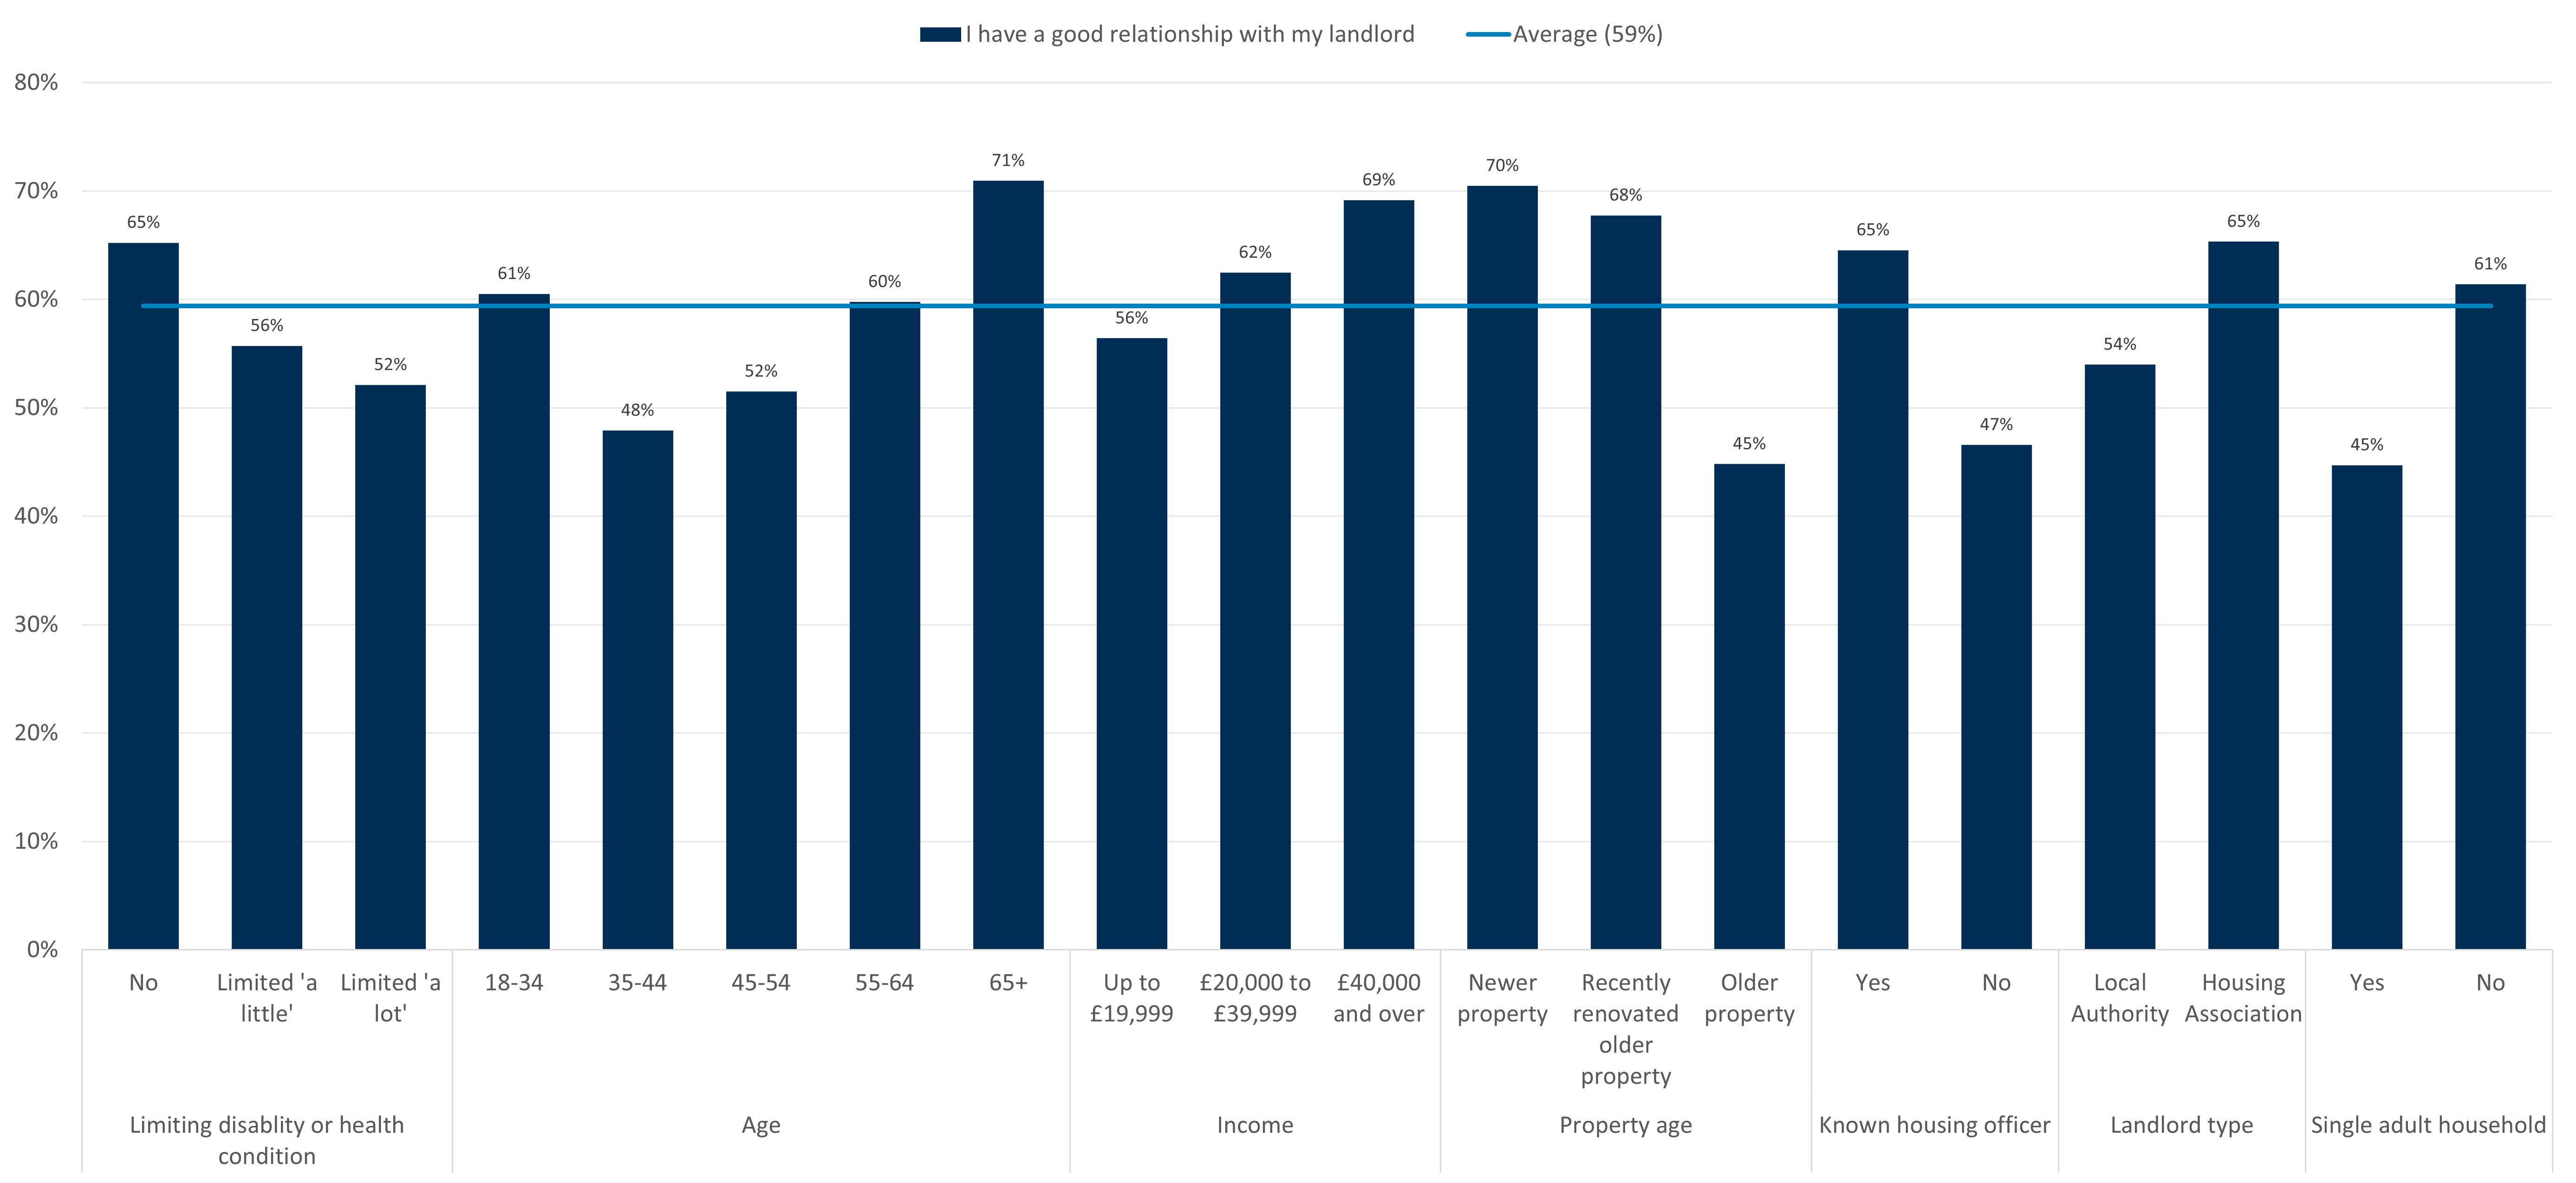
Source: Consumer Scotland Social renters survey, A4. To what extent do you agree or disagree with the following statements: I have a good relationship with my landlord. N = 1,402.
Landlord communication
Most renters find the information provided by their landlord to be accessible. Over three‑quarters (76%) agree that landlord communications are accessible to them, including 31% who strongly agree.
Fewer renters find the information provided to be relevant. Still, two-thirds (66%) agree that landlord communications are relevant to them, including 23% who strongly agree (Chart 30).
Chart 30: Most renters feel that landlord communication is accessible, but fewer find it relevant
Of those who receive communications from landlord, agreement with statements on accessibility and relevance of information
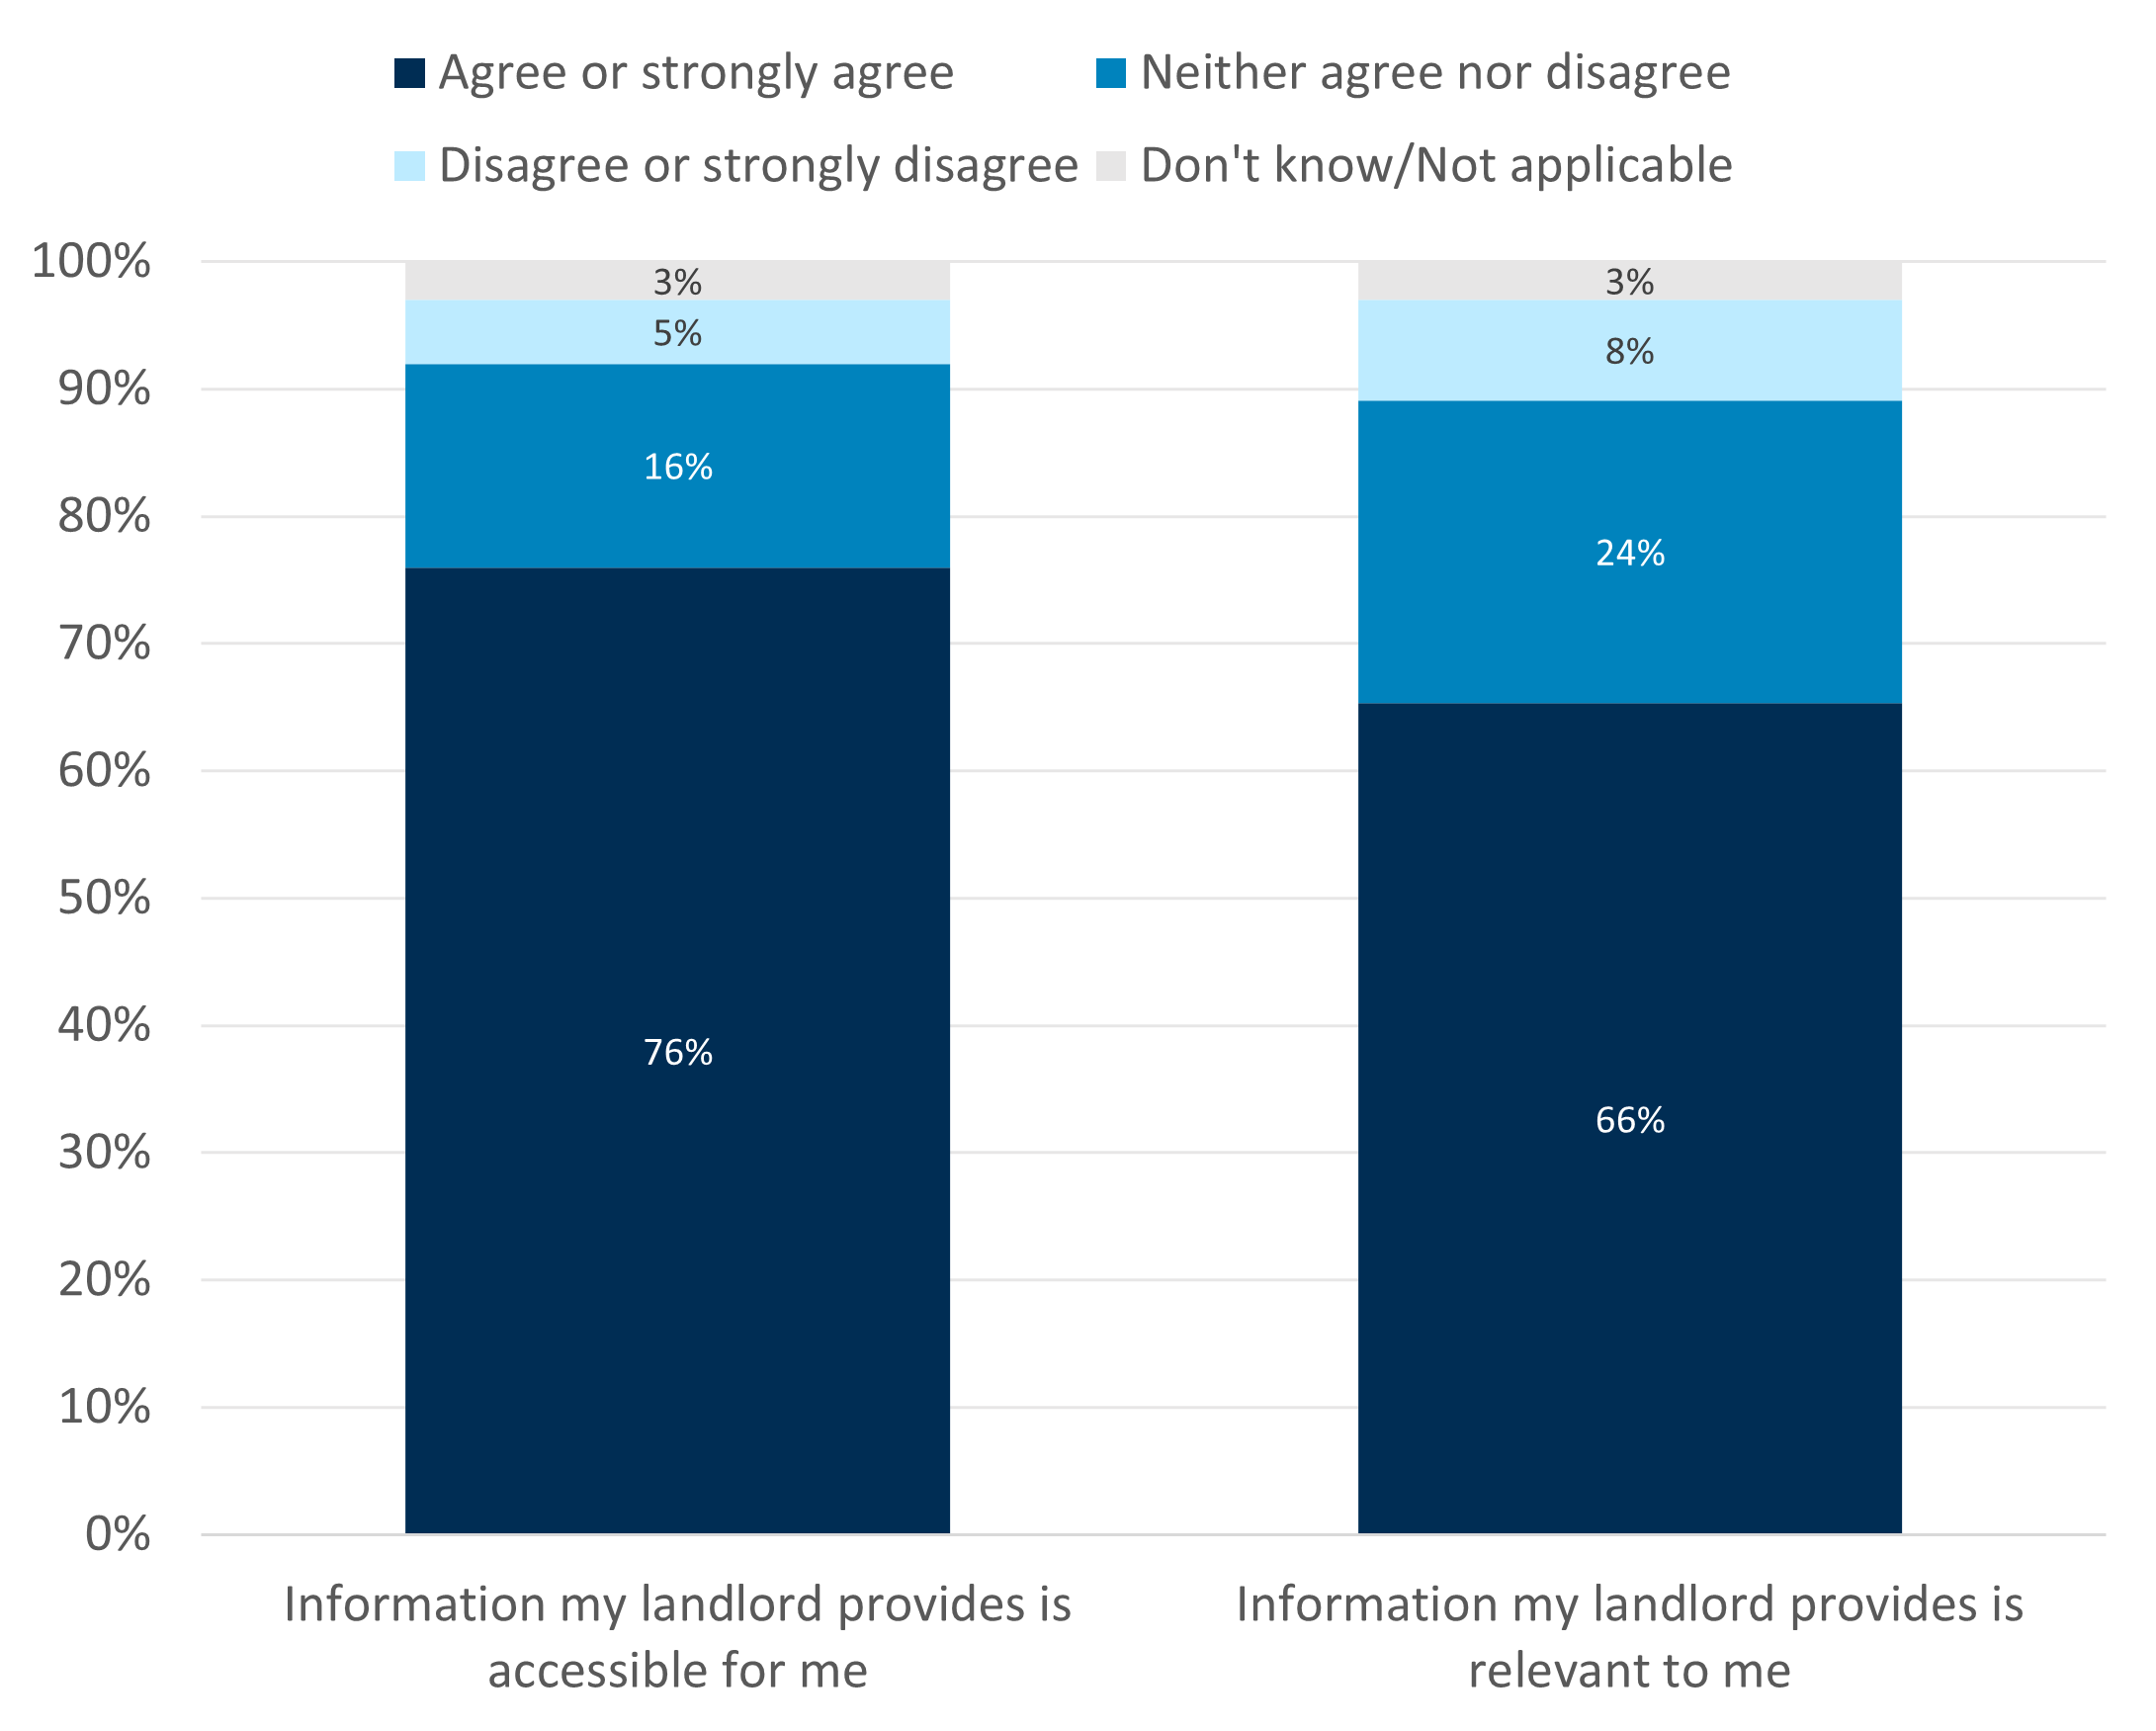
Source: Consumer Scotland Social renters survey, B3. To what extent do you agree or disagree with the following statements? N = 1,402.
Most (65%) renters are satisfied that their landlord keeps them informed about things that matter to them (including 30% who are very satisfied). Fewer (54%) agree that their landlord gives them opportunities to participate in decision-making, including 25% who are very satisfied (Chart 31).
Chart 31: Just over half of renters are satisfied that their landlord gives them opportunities to participate in decision-making
Satisfaction that landlord keeps renter informed and gives opportunities to participate in decision-making
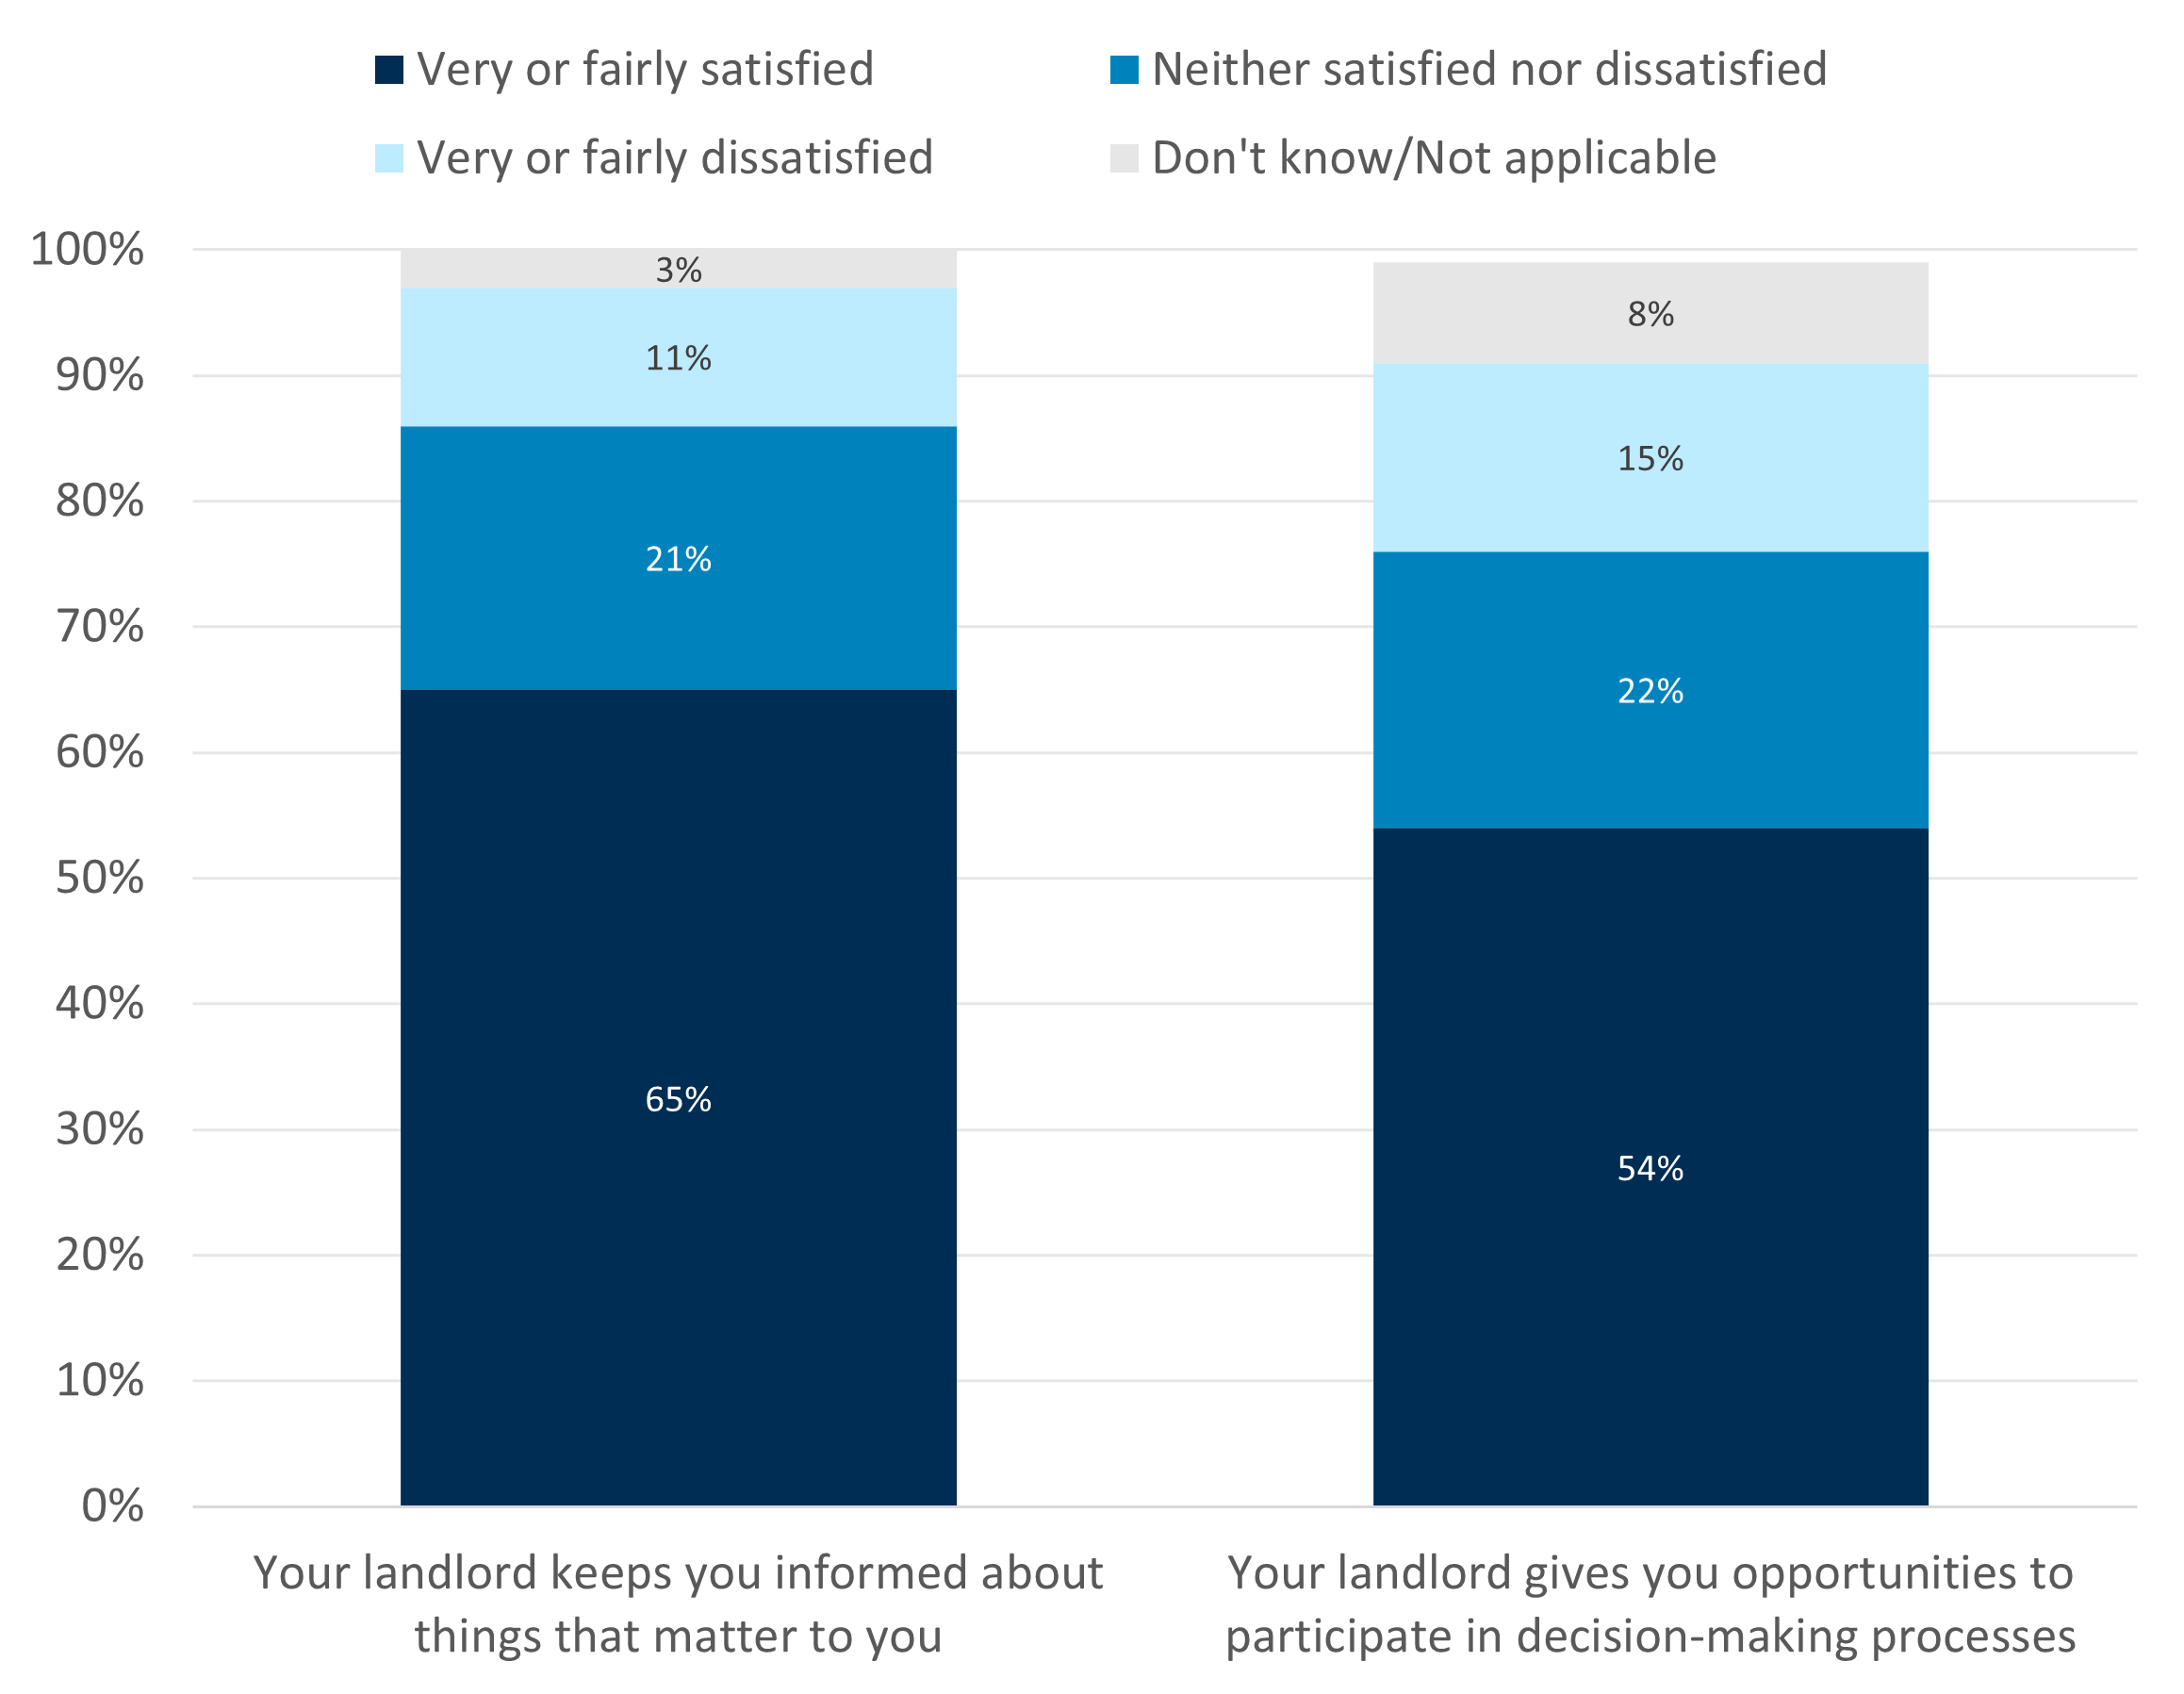
Source: Consumer Scotland Social renters survey, B6. How satisfied or dissatisfied are you that…? N = 1,402.
10. Landlord responsiveness
This chapter examines how well landlords respond or help renters with various things like general communication, repairs, and complaints. Most renters rate their landlord well, particularly around general contact, day-to-day repairs and ongoing maintenance and upkeep. Renters without a known housing officer and those living in older properties (over 10 years old) that have not been recently renovated were less positive about their landlord’s responsiveness.
We asked renters how well their landlord responds or helps them with various things like general communication, repairs, and complaints. This question was taken from RentBetter, to allow us to compare with the private rented sector.
Most renters rate their landlord’s responsiveness well, but there are differences across measures (Chart 32).
Renters generally feel that their landlord responds well to:
- General contact (72%)
- Day-to-day repairs (64%)
- Ongoing maintenance and upkeep (59%)
Other aspects were rated slightly lower, largely because many respondents responded “Don't know / not applicable” to these questions – such as difficulties paying rent, advice about social issues, and response to adaptions. For example, while only 40% of renters feel their landlord responds well to property adaptions, 38% of renters responded “Don't know/not applicable” to this question. When excluding these responses, this rises to 65% of renters rate this well and 16% rate it poorly.
However, even when taking these into account, smaller proportions of renters feel that their landlord responds well to dealing with complaints and disputes, and advice about social issues, such as neighbourhood or community problems. This is unsurprising, as landlords are unlikely to have much control over social issues.
Chart 32: Renters generally rate their landlord’s responsiveness well, but less so for dealing with complaints and disputes, and advice about social issues
Extent to which renters feel their landlord responds well
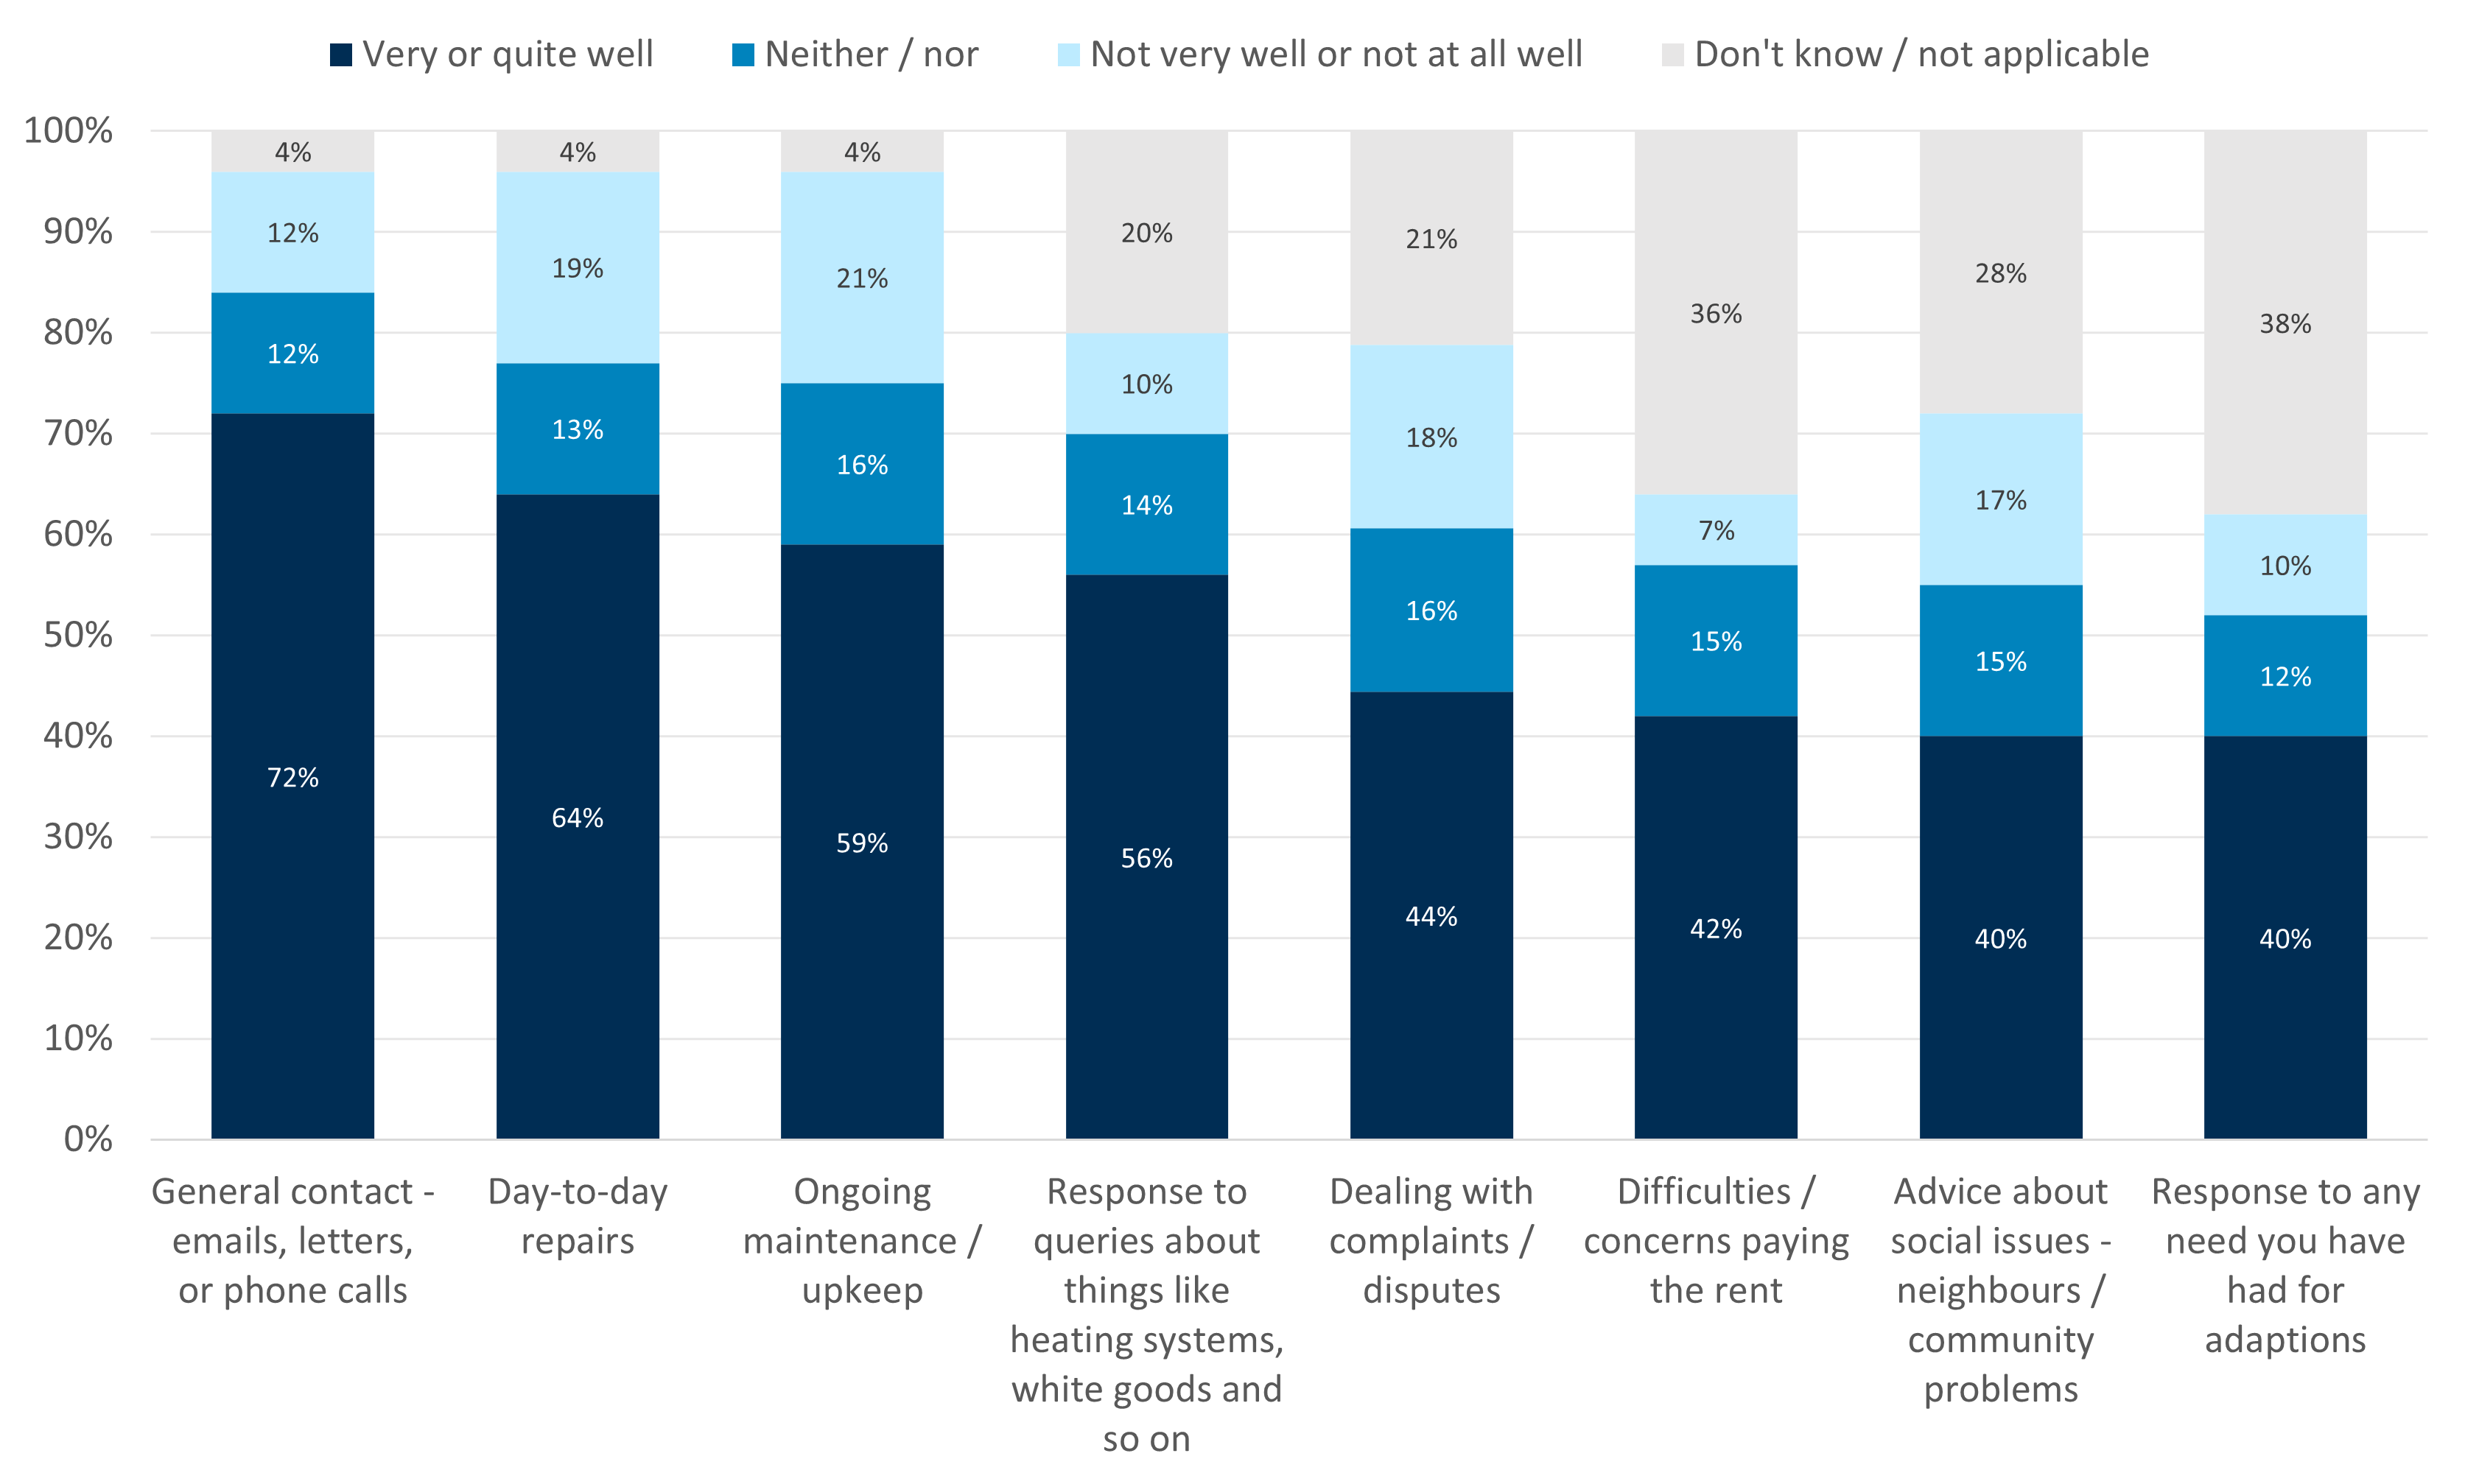
Source: Consumer Scotland Social renters survey, B1. How well, or not, does your landlord respond or help you with the following...? N = 1,402.
Variation by demographic characteristics
Property age is associated with landlord responsiveness, with renters living older unrenovated properties (over 10 years old and not recently renovated) rating landlord responsiveness as better than those in newer or recently renovated older properties (Chart 33).
For example, only 64% of renters in older unrenovated properties rate their landlord’s responsiveness to general contact positively, compared with 78% of those in recently renovated older and 79% in newer properties.
These differences persist even when taking into account the “Don’t know / Not applicable” responses.
Chart 33: Landlord responsiveness is lower among renters living in older properties (over 10 years old) that have not been recently renovated
Percentage of respondents rating their landlord’s responsiveness as ‘very well’ or ‘quite well’, by property age and condition
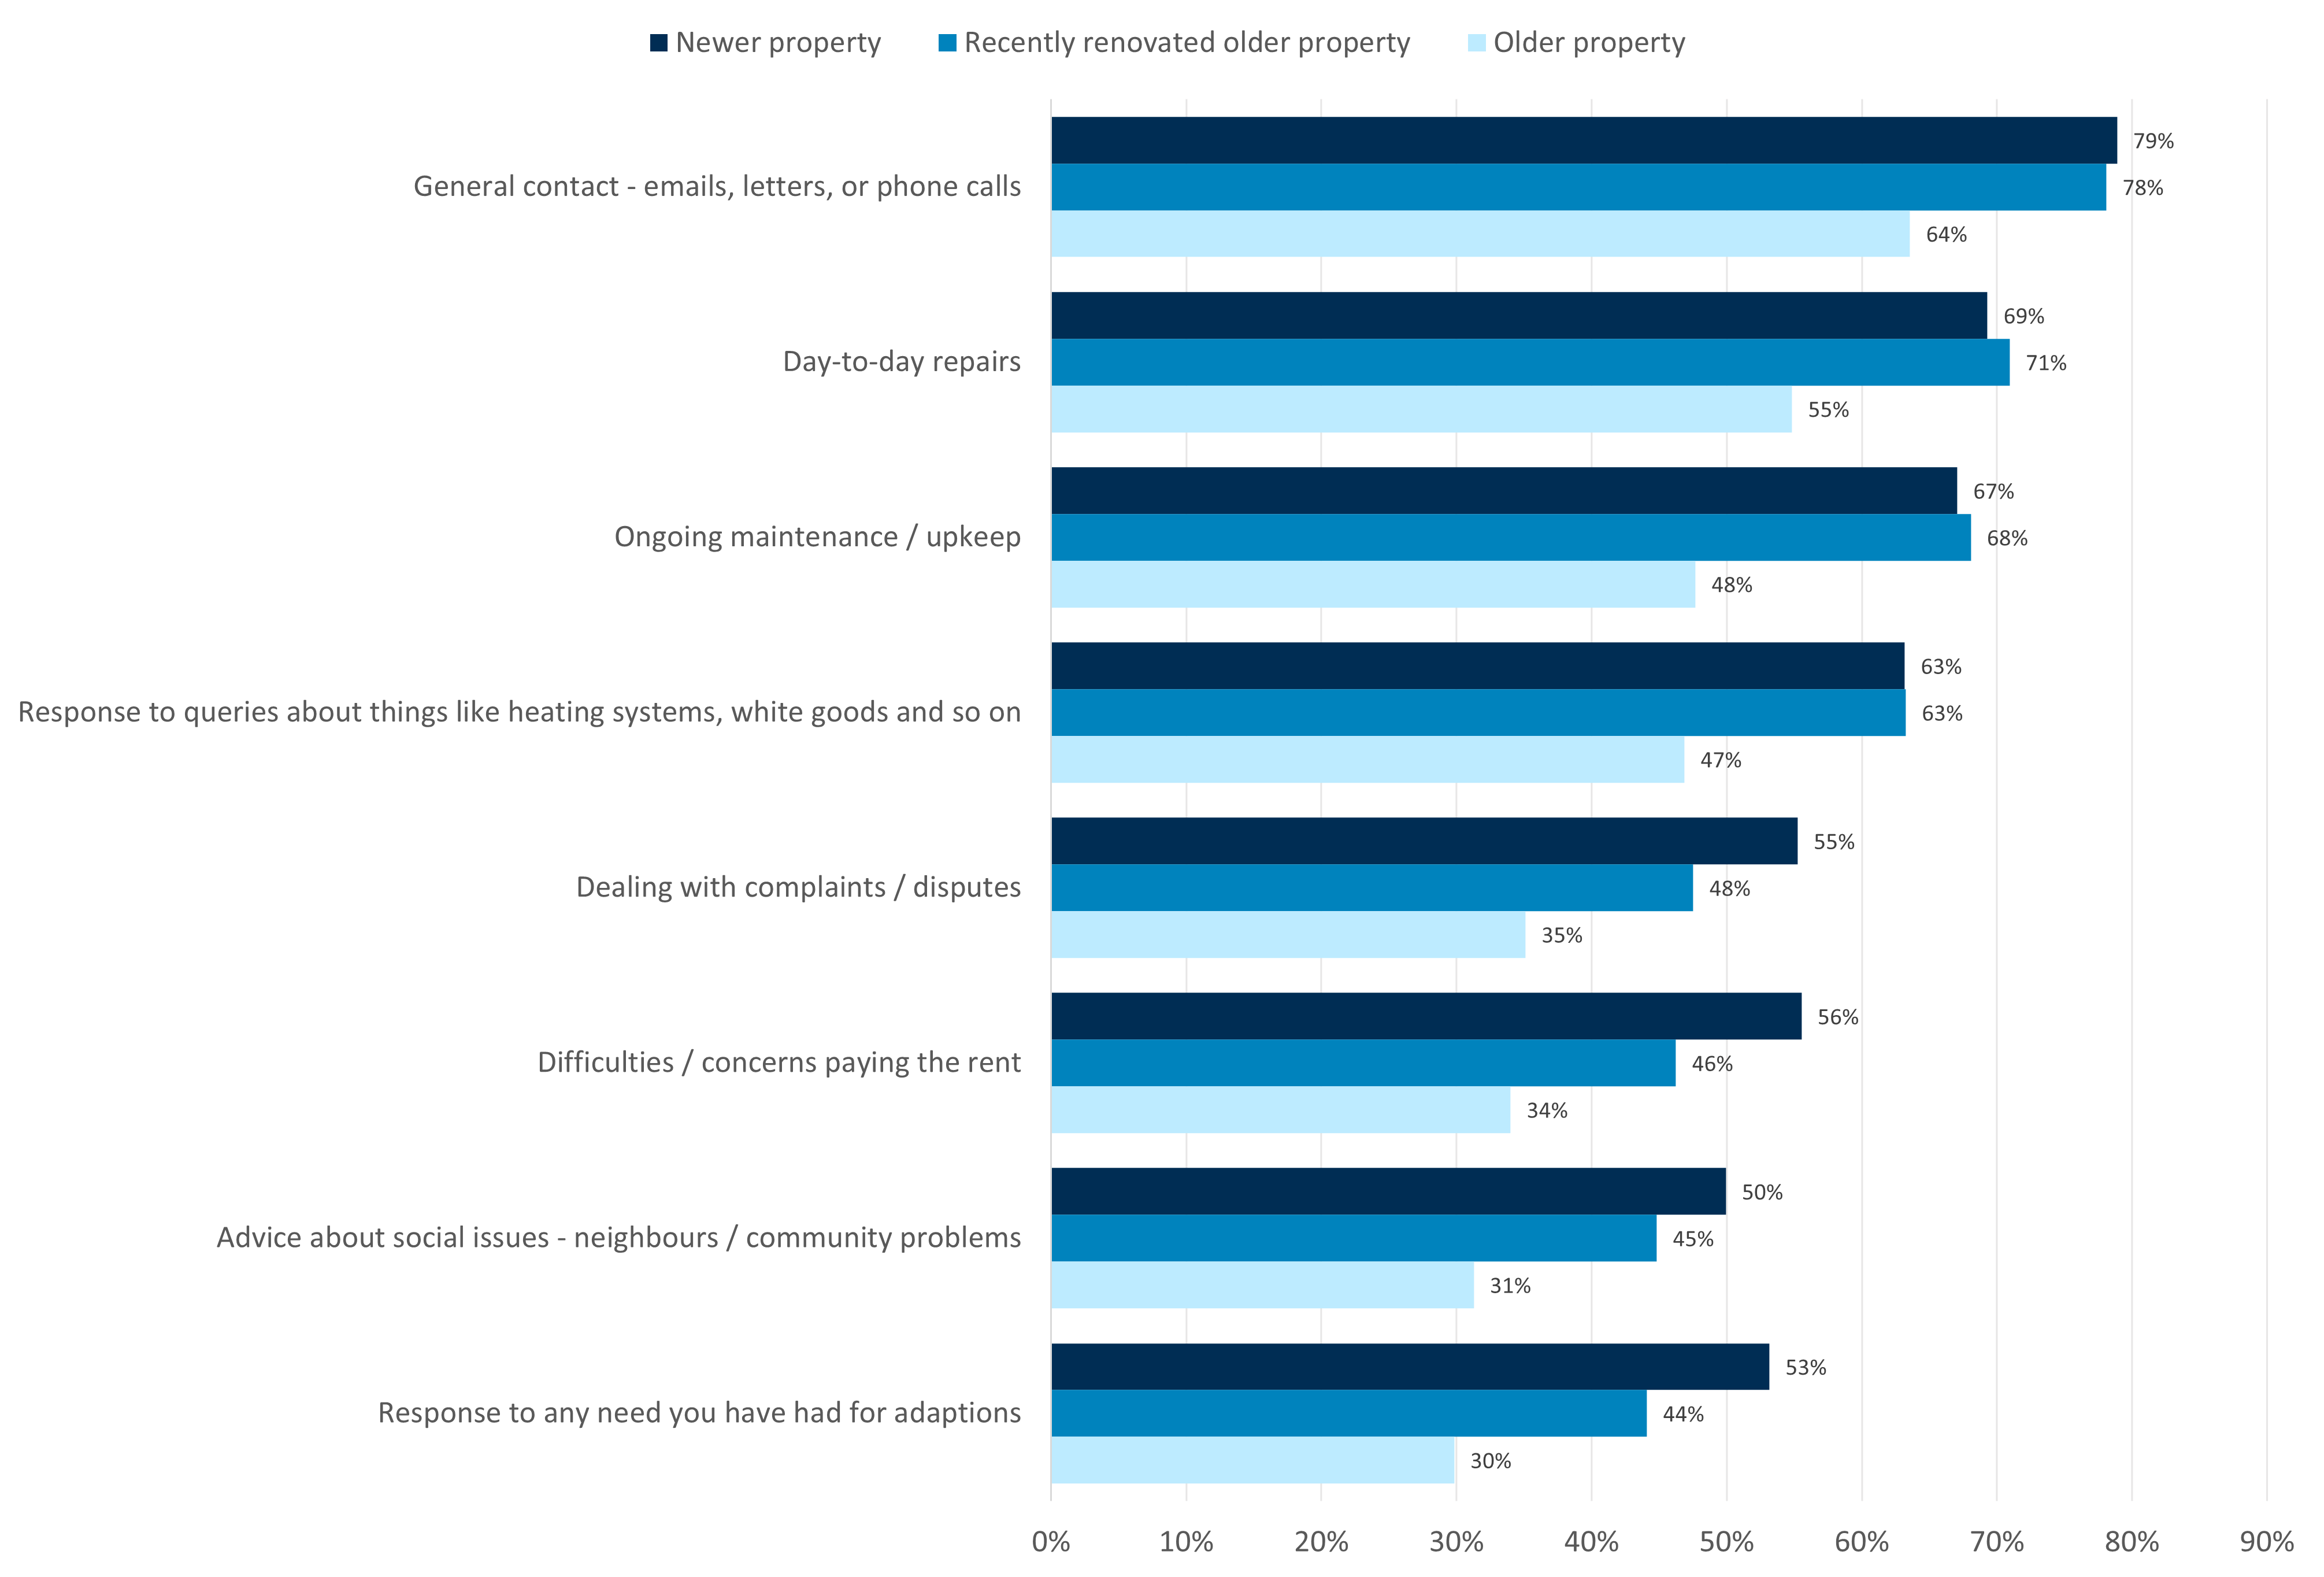
Source: Consumer Scotland’s Social rented sector survey, B1. How well, or not, does your landlord respond or help you with the following…? N = 1,402.
Across all these measures, renters who do not have a housing officer whom they know how to contact (‘known housing officer’) report poorer ratings on landlord responsiveness, compared with those who do (Chart 34).
For example, only 57% of renters without a known housing officer rate their landlord’s responsiveness to general contact positively, compared with 77% of those with one.
This difference was especially stark for advice on social issues: just 24% of renters without a known housing officer rated this positively, compared with 46% of those with one.
Again, these differences persist even when taking into account the “Don’t know/Not applicable” responses.
These consistent better perceptions of landlord responsiveness are perhaps unsurprising, as housing officers are intended to facilitate communication between renters and their landlords. This reinforces the previous findings, suggesting that housing officers are working as intended to bridge communication between renters and their landlords.
Chart 34: Renters without a known housing officer whom they know how to contact report poorer landlord responsiveness
Percentage of respondents rating their landlord’s responsiveness as ‘very well’ or ‘quite well’, by known housing officer
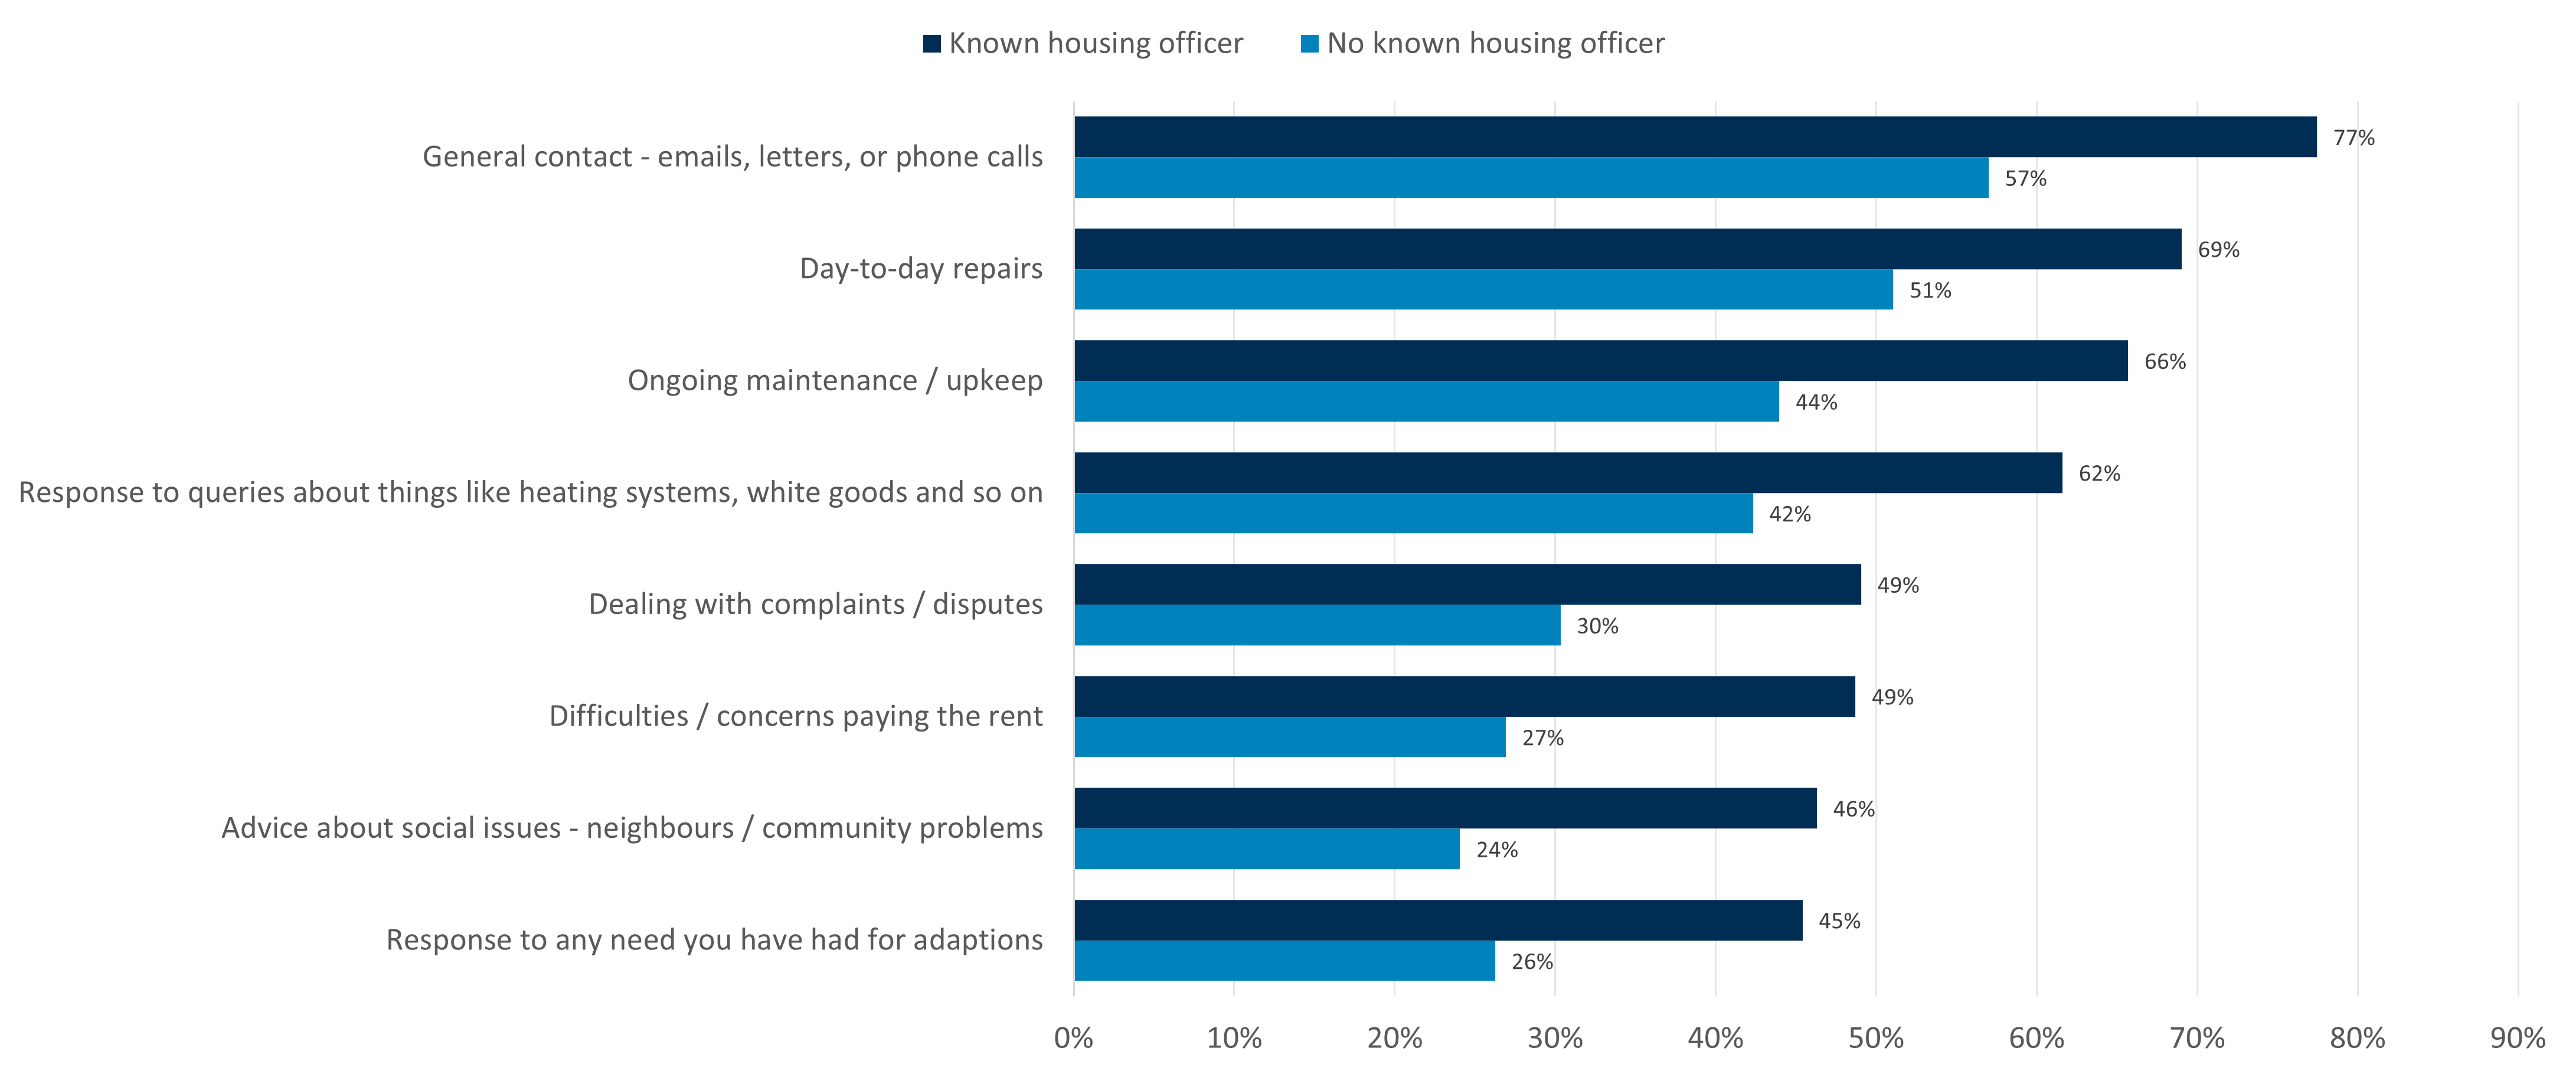
Source: Consumer Scotland Social renters survey, B1. How well, or not, does your landlord respond or help you with the following…? N = 1,402.
11. Housing officer or named point of contact
This chapter examines whether renters have a housing officer or named point of contact, and their experience of contacting them. Most (71%) renters have a housing officer or named point of contact whom they know how to contact. However, a sizeable minority (29%) do not – they do not know how to contact them, do not have one, or do not know whether they have one – and this is associated with a more negative renting experience overall. Among those who do have a housing officer or named point of contact, around half say that it is always easy to get in touch with them. And three-quarters of renters who have contacted them are satisfied with the experience.
Presence and awareness of housing officer
In the social rented sector, a housing officer or named point of contact is a frontline staff member responsible for day‑to‑day management of rental properties. Their responsibilities include supporting housing applications, organising repairs, and assisting with neighbour problems and rent arrears. Social landlords are not legally required to provide a housing officer or named point of contact.
Most renters (71%) report having a housing officer or named point of contact whom they know how to contact. The remaining 29% fall into three roughly equal groups (Chart 35):
- 9% have one but do not know how to contact them
- 9% do not have one
- 11% do not know whether they have one
These results may reflect a combination of landlord communication and tenant engagement. For example, some tenants who say they do not know how to contact their housing officer may not recall being informed, while others who report hot having a contact may in fact have one but are unaware.
Although the provision of a housing officer or named point of contact is not mandatory, renters with one and know how to contact them consistently report a more positive renting experience across multiple measures, including property condition, repair handling and landlord relationship. While we cannot determine whether the presence of a housing officer directly improves outcomes, the strength and consistency of the association indicates that accessible frontline support plays an important role in shaping tenants’ experiences.
Taken together, these findings suggest that improving the visibility and accessibility of housing officers or named points of contact – whether through clearer communication, increased engagement, or expanding provision – could help ensure that more tenants benefit from this support.
Chart 35: 71% of renters have a housing officer or named point of contact whom they know how to contact
Knowledge of housing officer/named point of contact
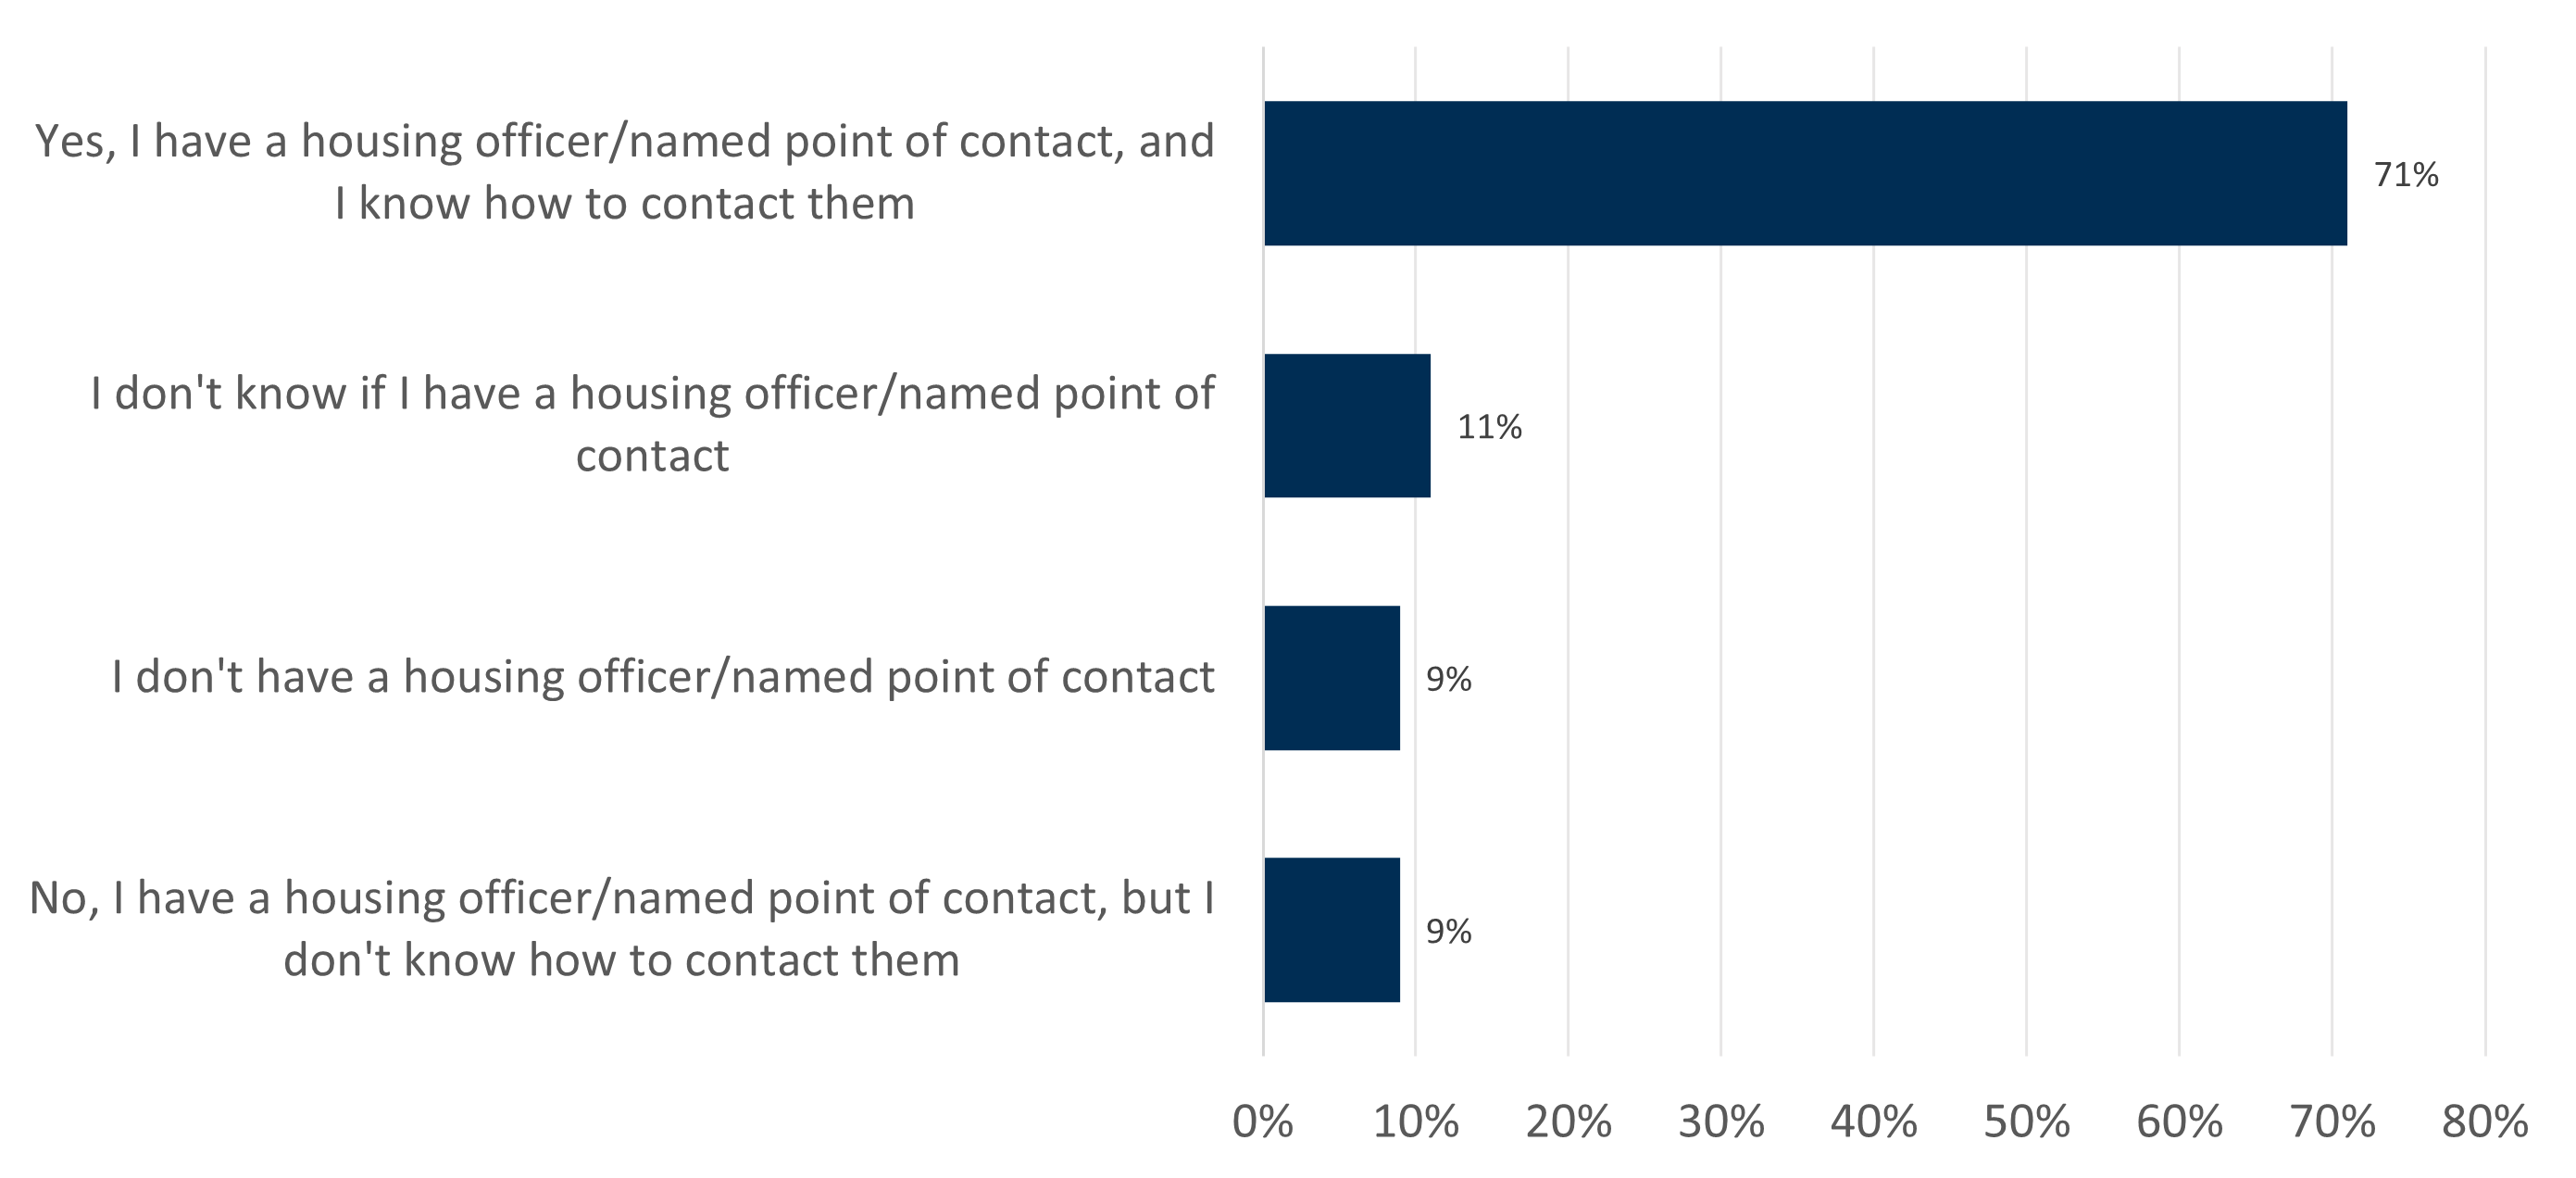
Source: Consumer Scotland Social renters survey, B11. Do you know how to contact your local housing officer/named point of contact for your tenancy if you need to? N = 1,402.
Variation by demographic characteristics
Certain groups of tenants are less likely to have a housing officer or point of contact whom they know how to contact (Chart 36):
- Renters aged 18-44 (62-68%) compared with those aged 65+ (80%)
- Renters renting from councils (66%) compared with housing associations (78%)
These patterns may reflect several factors. Younger renters may have shorter or more interrupted tenancies, giving them fewer opportunities to establish and build relationships with housing staff. Differences between landlord types may relate to variations in staffing models, visibility of frontline staff, or communication practices. Importantly, these differences between groups persist even after accounting for related factors such as tenancy length, suggesting that structural and organisational factors may also play a role.
These disparities indicate that some groups renters are not benefiting equally from this role, despite the clear association between having an accessible housing officer and a more positive renting experience.
Chart 36: Younger renters and those renting from councils are less likely to have a housing officer or point of contact whom they know how to contact
Percentage of renters who have a housing officer/named point of contact and know how to contact them, by demographics
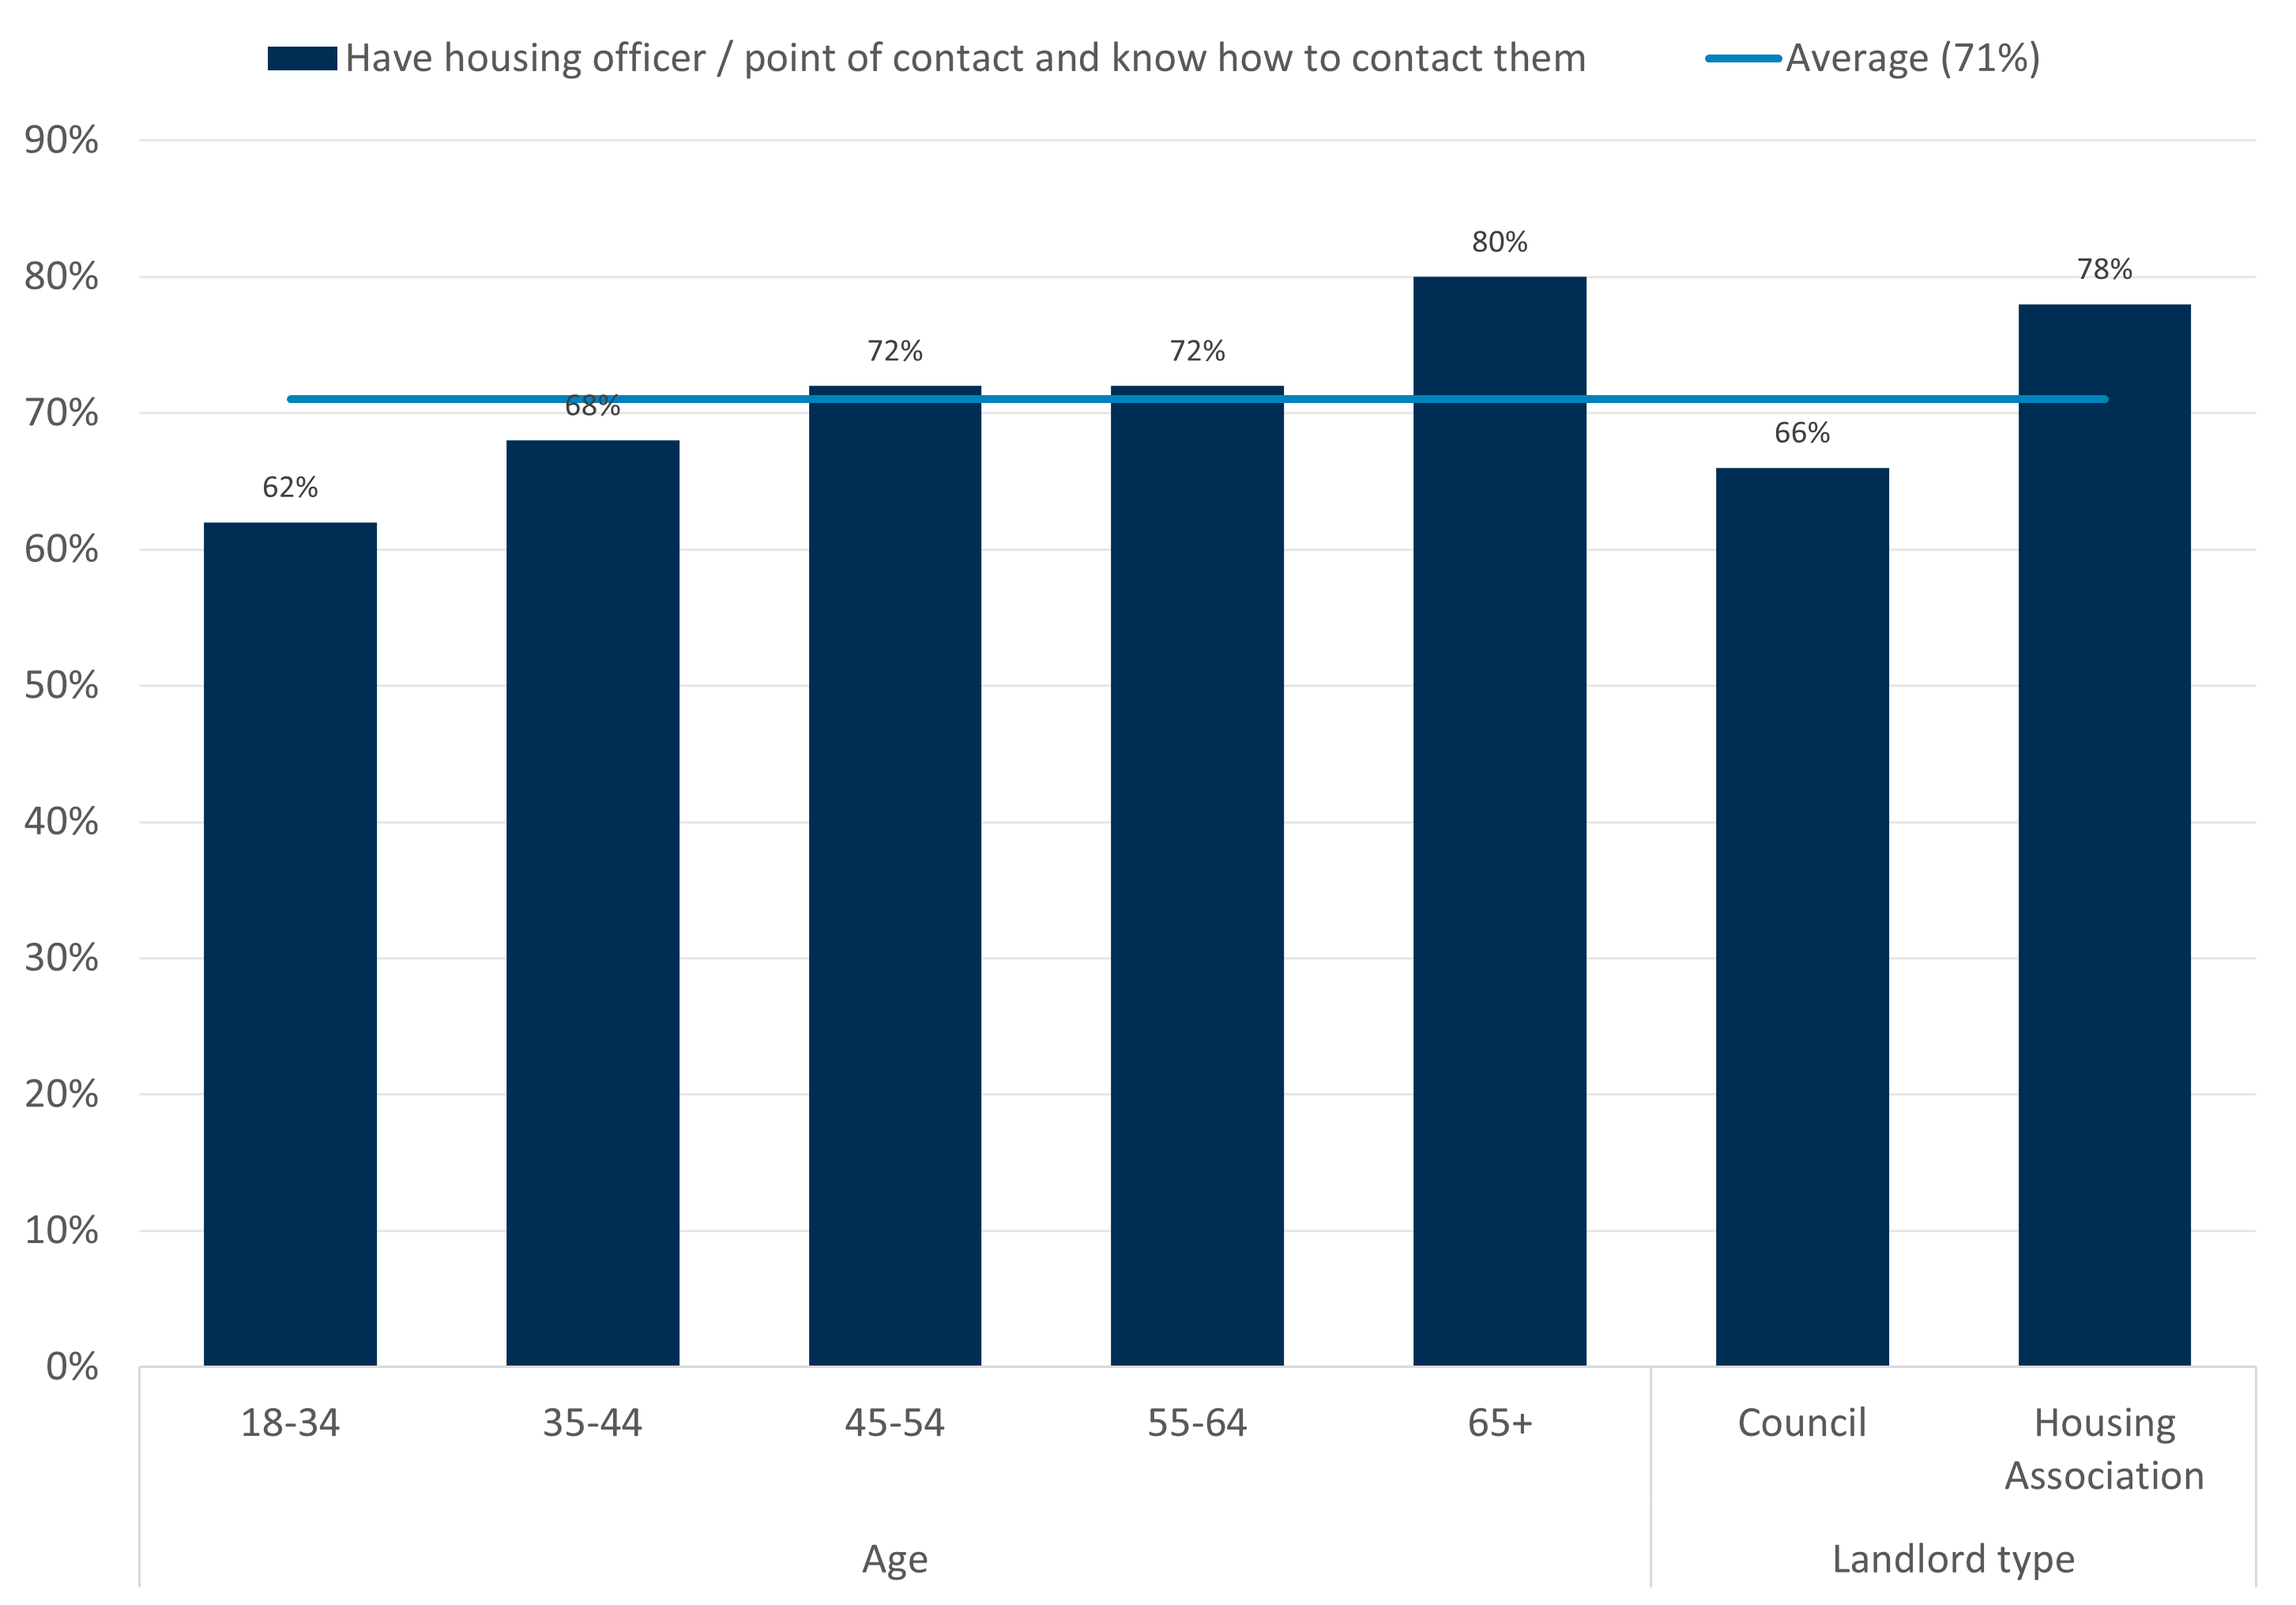
Source: Consumer Scotland Social renters survey, B11. Do you know how to contact your local housing officer/named point of contact for your tenancy if you need to? N = 1,402.
Experience of contacting housing officer
Among renters who have a housing officer or point of contact and know how to contact them, 89% have contacted them (Chart 37):
- 52% say it’s always easy to get in touch
- 27% have encountered delays
- 10% have trouble getting in touch
These figures suggest overall good accessibility but highlight that a significant minority still face barriers, with 37% experiencing delays or trouble getting in touch.
Renters are generally satisfied with their experience of contacting their housing officer or named point of contact. Three-quarters of renters who have contacted them are satisfied with the ease of accessing them (79%), their responsiveness (75%) and the level of support provided (73%).
Chart 37: Renters are generally satisfied with their experience of contacting their housing officer
Of those who have contacted their housing officer/named point of contact, satisfaction with experience
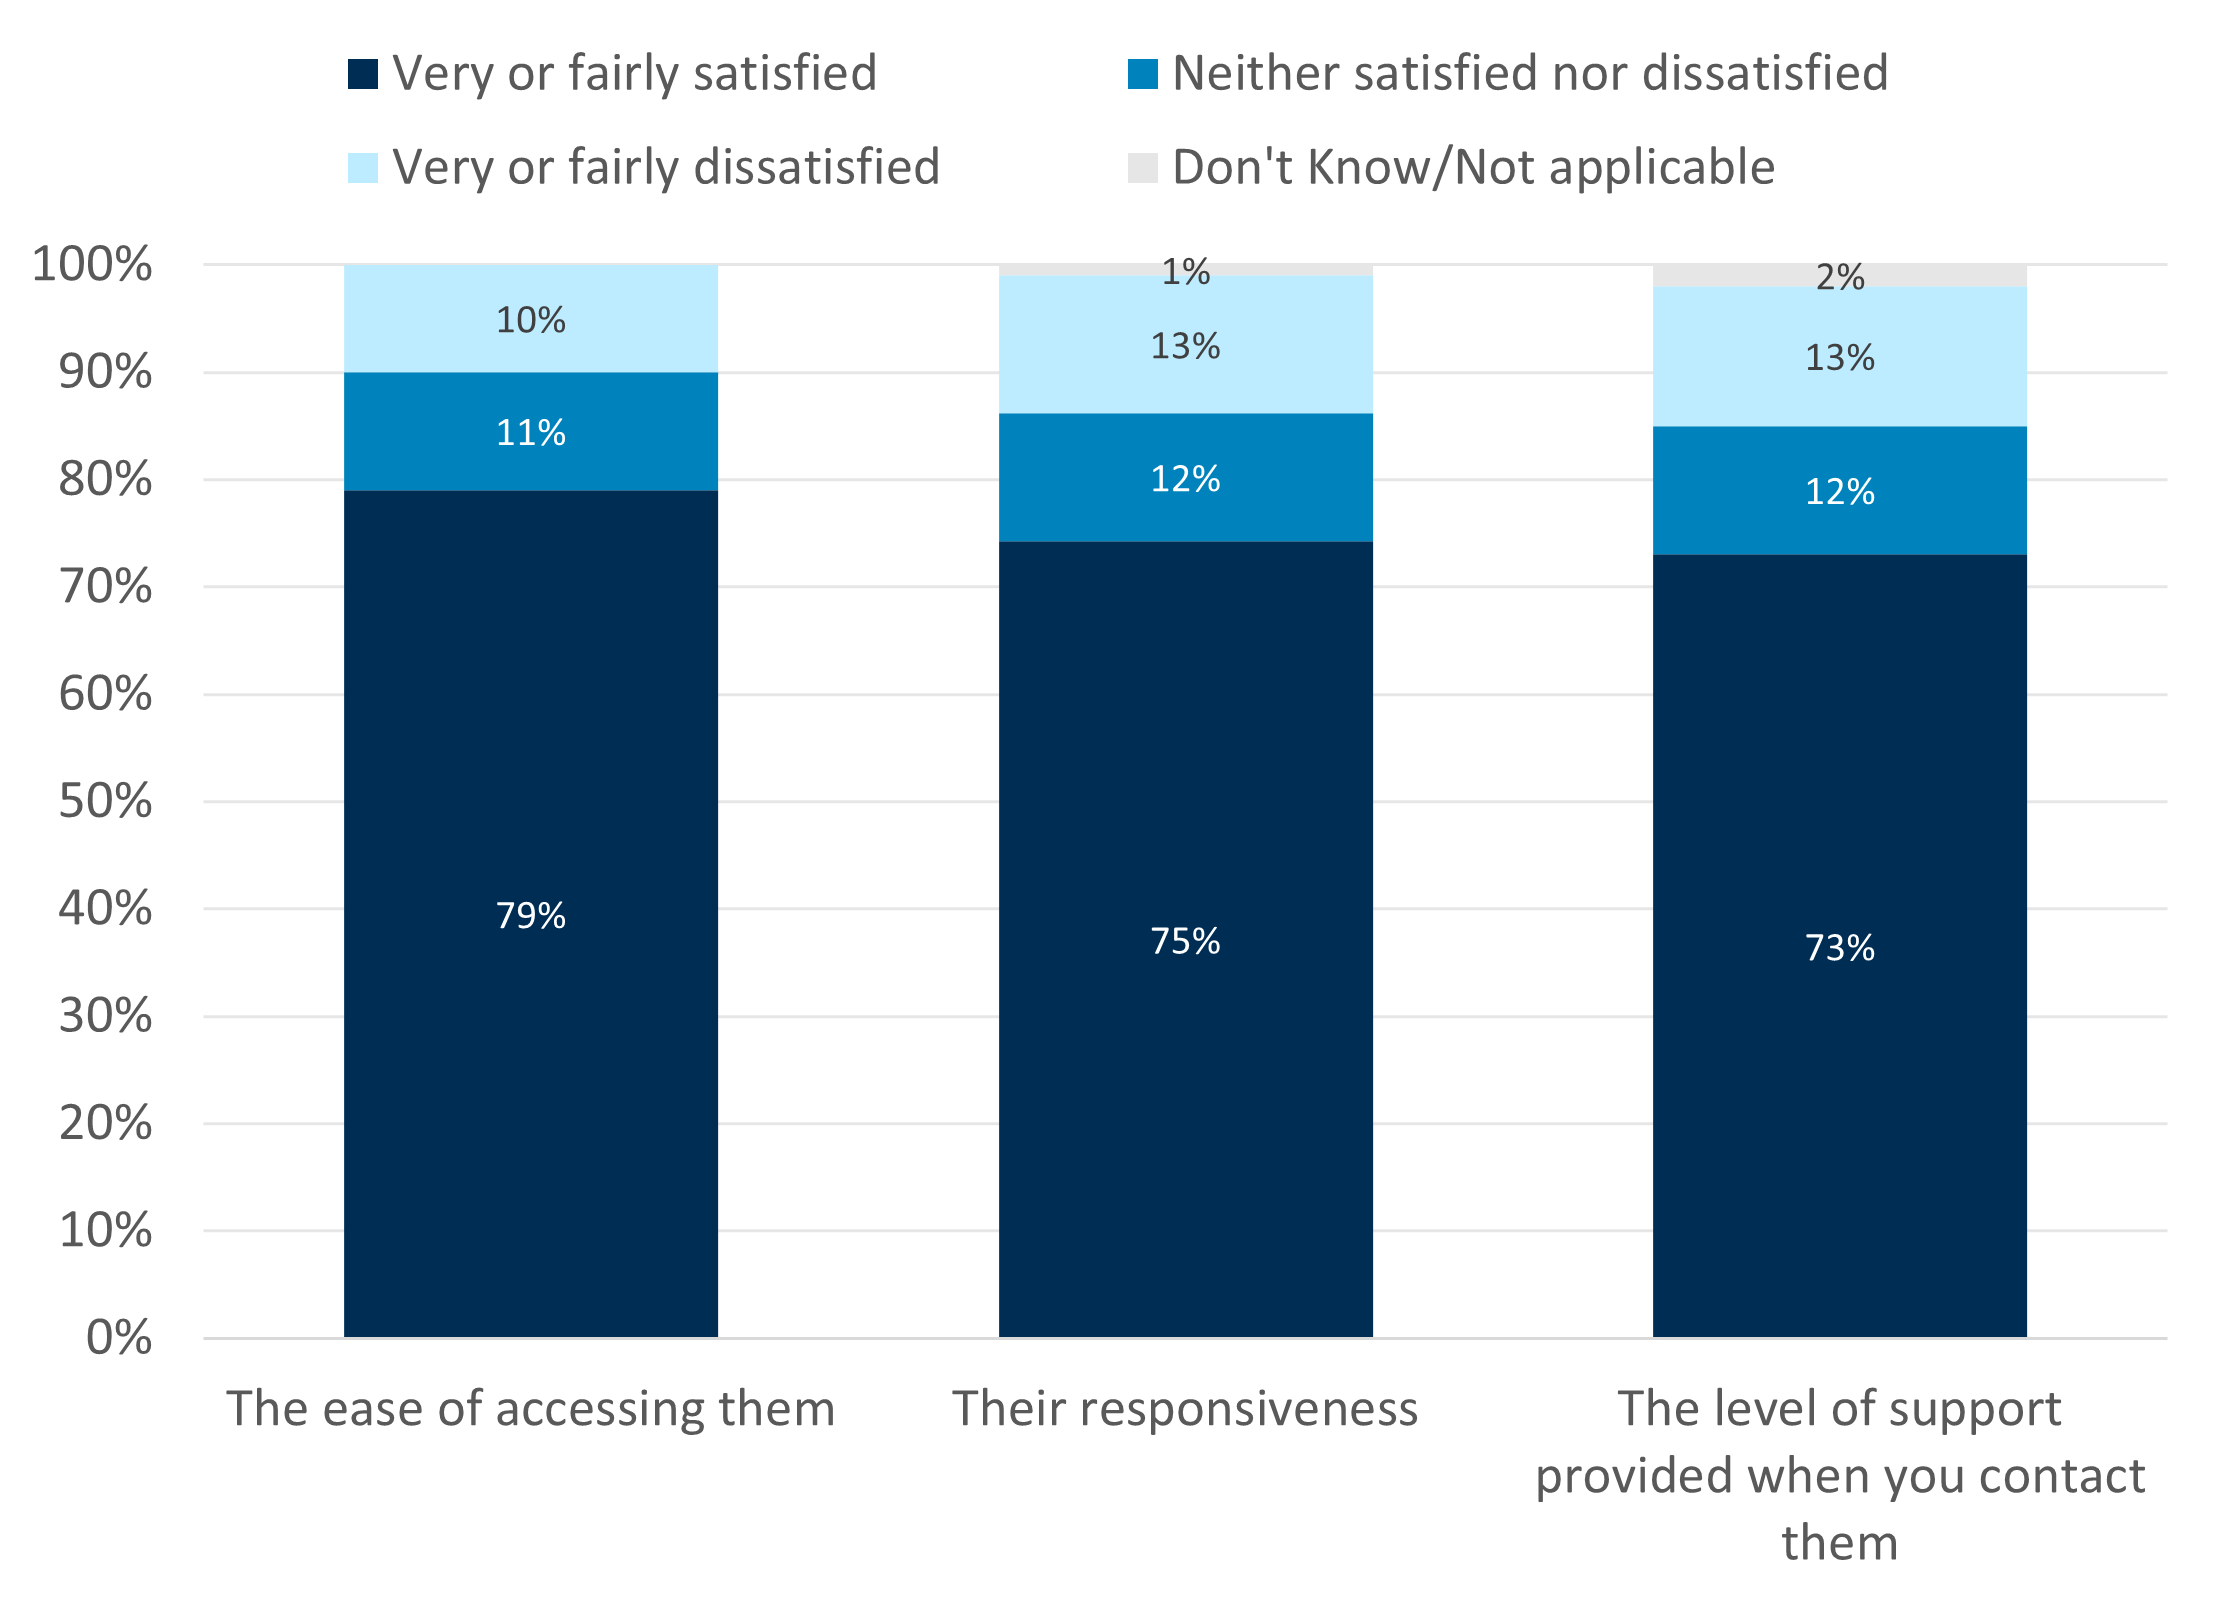
Source: Consumer Scotland Social renters survey, B13. Thinking about your interactions with your housing officer/named point of contact, how satisfied or dissatisfied are you with...? N = 892.
12. Comparisons with the private rented sector
Throughout this chapter, we draw on findings from the RentBetter Research Programme and SafeDeposits Scotland’s Voice of the Tenant survey to provide comparisons with the private rented sector. However, social and private renters differ substantially in socio‑economic characteristics, including household income and the types and cost of the properties they rent. As a result, differences between sectors should be interpreted with caution, as they may reflect these underlying demographic and financial factors rather than tenure alone. Where possible, we explored comparisons by income bands to help mitigate these differences.[23]
Property conditions
Private renters tend to be more positive than social renters about the condition of their property (Chart 38). For example, 87% of private renters rate the overall condition of the property as good, compared with 77% of social renters (RentBetter survey).
While this may reflect true differences in landlord practice, differences between sectors may reflect underlying demographic and financial characteristics of the renter populations rather than from tenure alone, so should be interpreted with caution.
Chart 38: Private renters are more positive about their property than social renters, though this may reflect demographic or property differences rather than tenure alone
Percentage of respondents rating their property as ‘very good’ or ‘fairly good’ across a range of measures, by sector.
Source: Consumer Scotland’s Social rented sector survey, C1. How would you rate the following aspects of the property? Private rented sector figures are from RentBetter Wave 3 Tenants survey analysis report (2024), p.26.
Problems with property condition
Private renters are slightly more likely to report having experienced a problem with the condition of their property in the last six months (58%, Voice of the Tenant survey) compared with social renters (53%). Issues such as plumbing problems, electrical hazards, and faulty or missing appliances appear more common in the private rented sector (Chart 39).
Taken together, these findings suggest that condition-related problems are more prevalent in the private rented sector. This may reflect a range of factors: private renters may have higher expectations due to paying more for their housing; they may be more likely to rent a furnished property and therefore encounter a wider range of items that could fail; or conditions in the private rented sector may genuinely be worse. It may also matter that the private rented sector includes many individual landlords and does not have an equivalent regulator or Ombudsman, which can affect how consistently standards are upheld.
Chart 39: Private renters are slightly more likely to have experienced a problem with the condition of their property (58%) compared with social renters (53%)
Percentage of respondents experiencing an issue with the condition of their property in the last six months, by sector
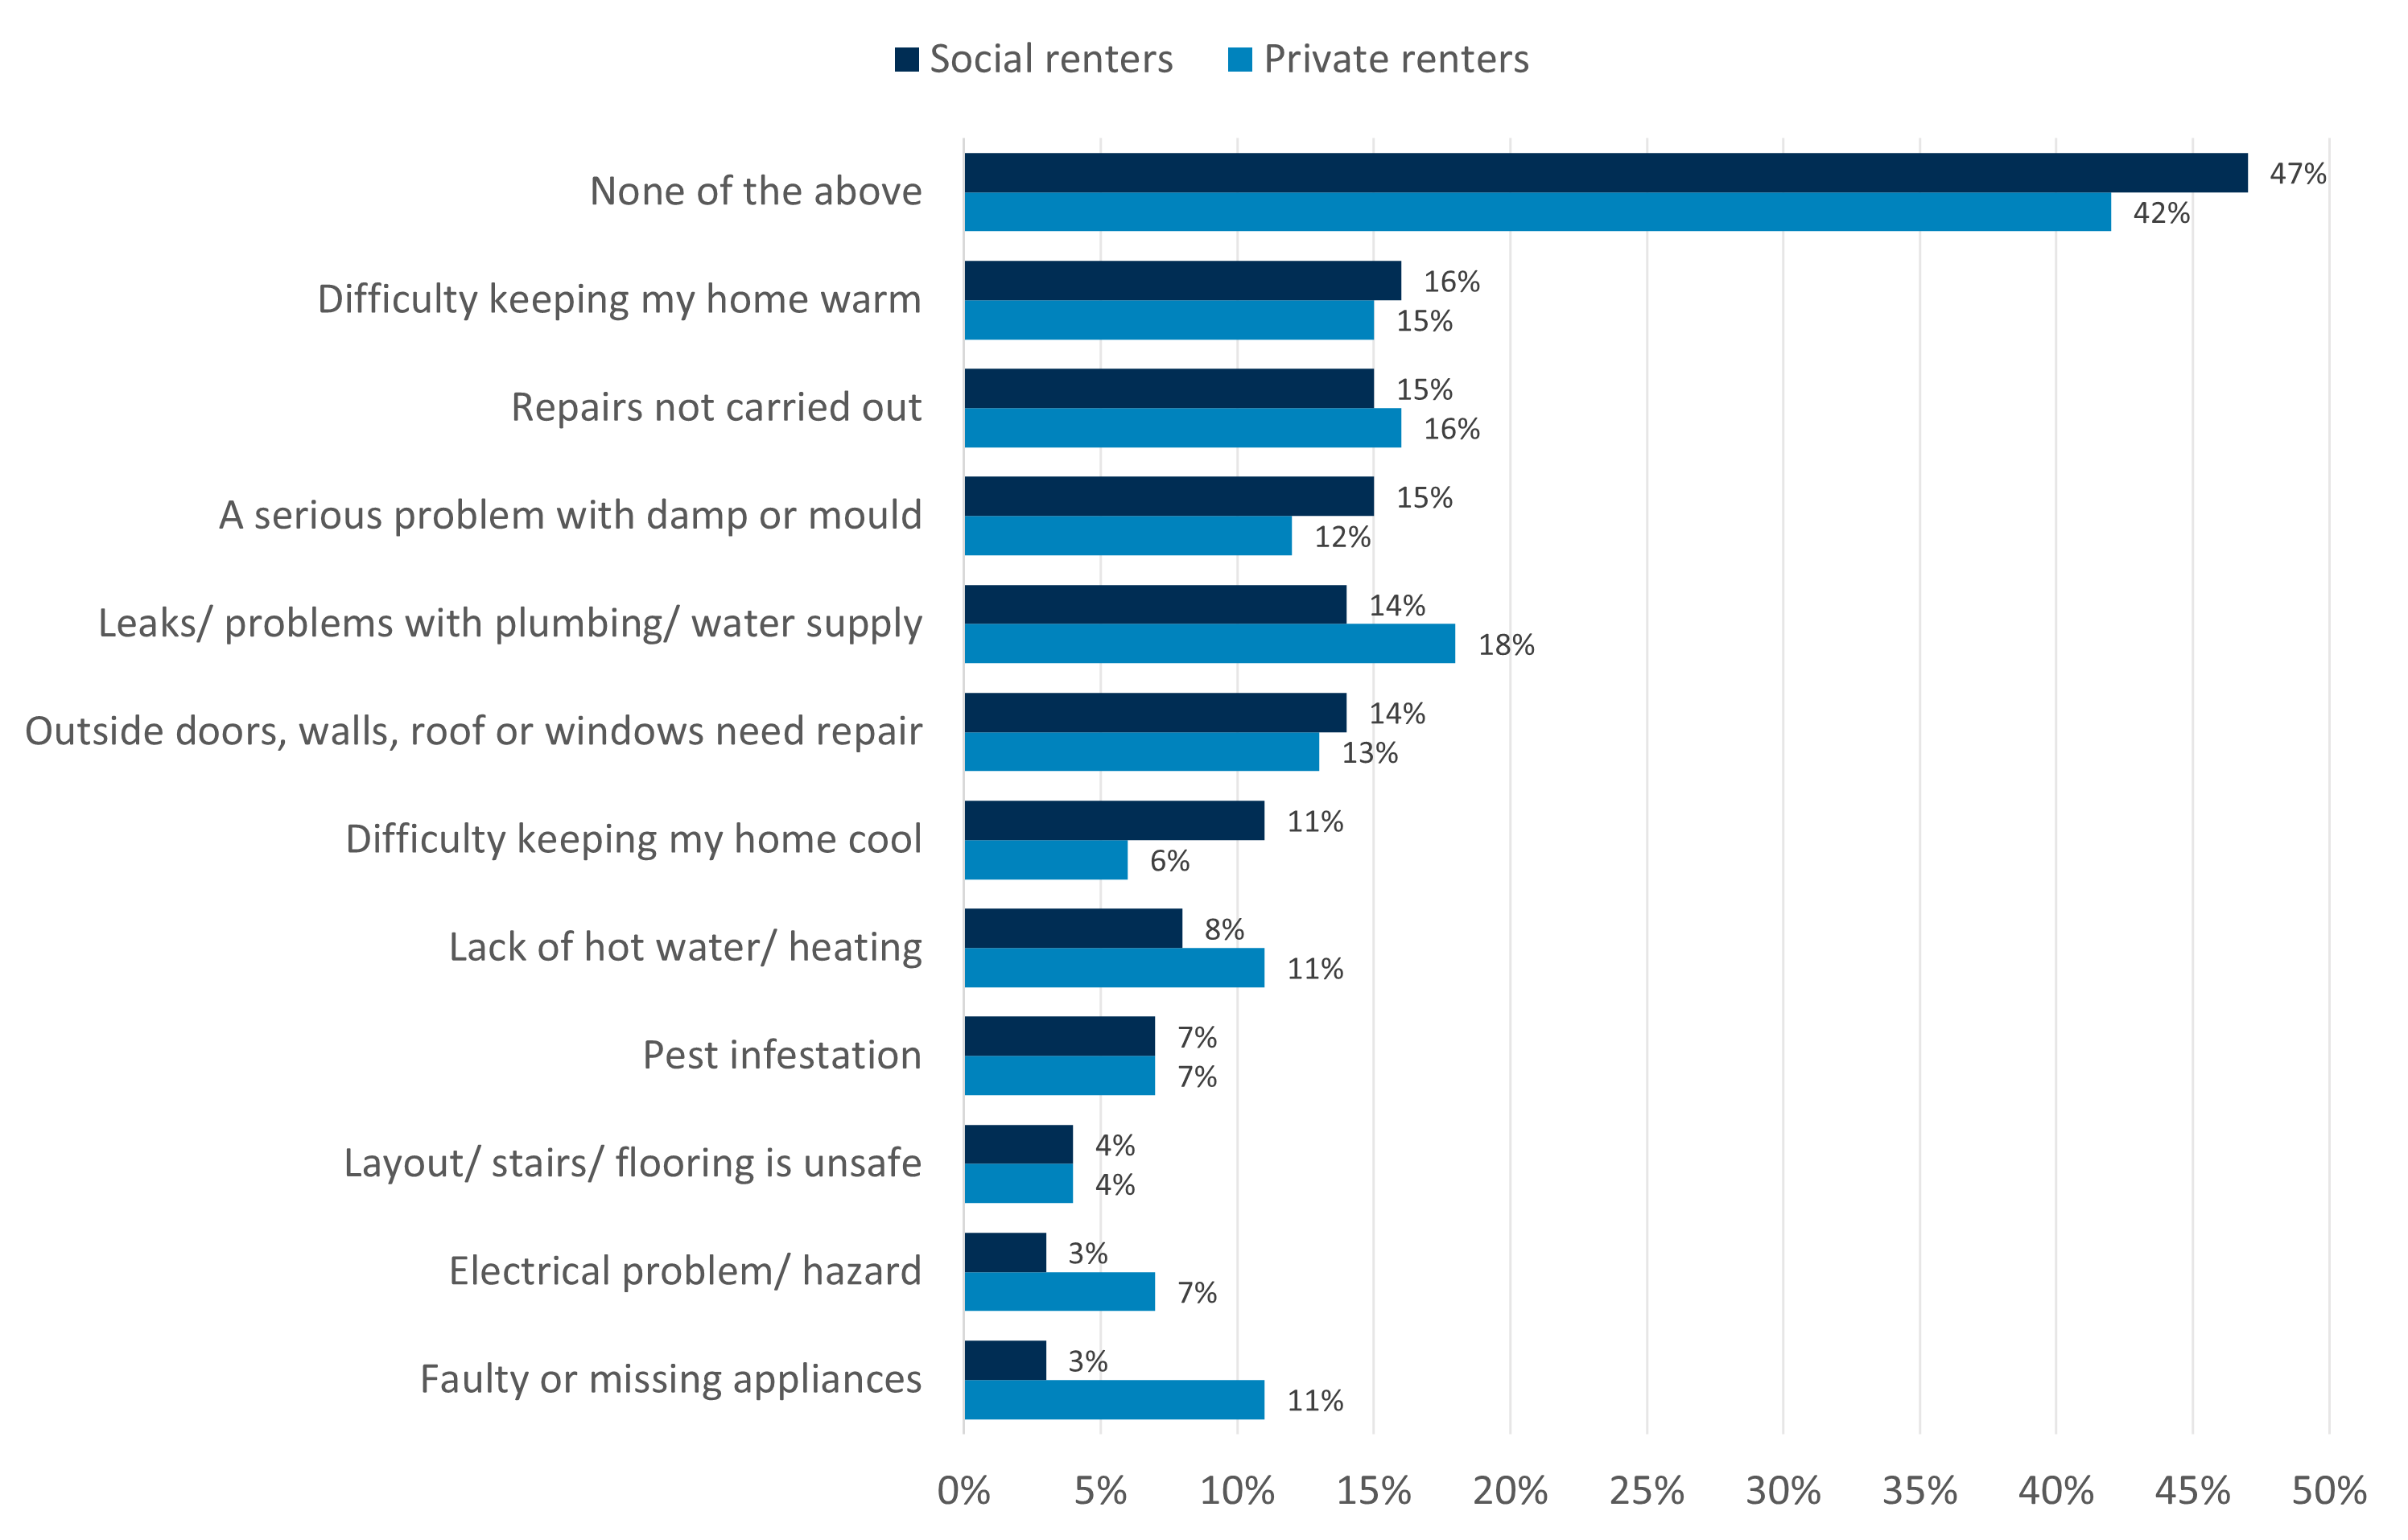
Source: Consumer Scotland’s Social rented sector survey, D1. In the last 6 months, have you experienced any problems with the condition of your home, for example a serious problem with damp or mould, lack of hot water or heating or pest infestation? Private rented sector figures are from Voice of the Tenant Survey Scotland, Wave 2 (2026), p.28. Note: both surveys were conducted in summer. ‘No working smoke/ fire alarm or other fire hazard’ is excluded due to low counts.
Renter journeys following a property condition problem
Despite experiencing more condition-related problems, private renters report faster or fuller resolution (Chart 40).
More private renters than social renters reported these issues to their landlord (90% and 83% respectively). However, private renters are more likely to have had their issues resolved fully (48% compared with 30%) or partially (43% compared with 29%) by their landlord.
Private landlords may face stronger incentives to respond quickly to retain tenants or avoid reputational risk. Social landlords, who manage larger and more complex estates, may face heavier repair workloads.
Chart 40: 48% of private renters have had their issues fully resolved by their landlord, compared with 30% of social renters
Percentage of private renters reporting having a problem with the condition of their
property, and whether it was resolved
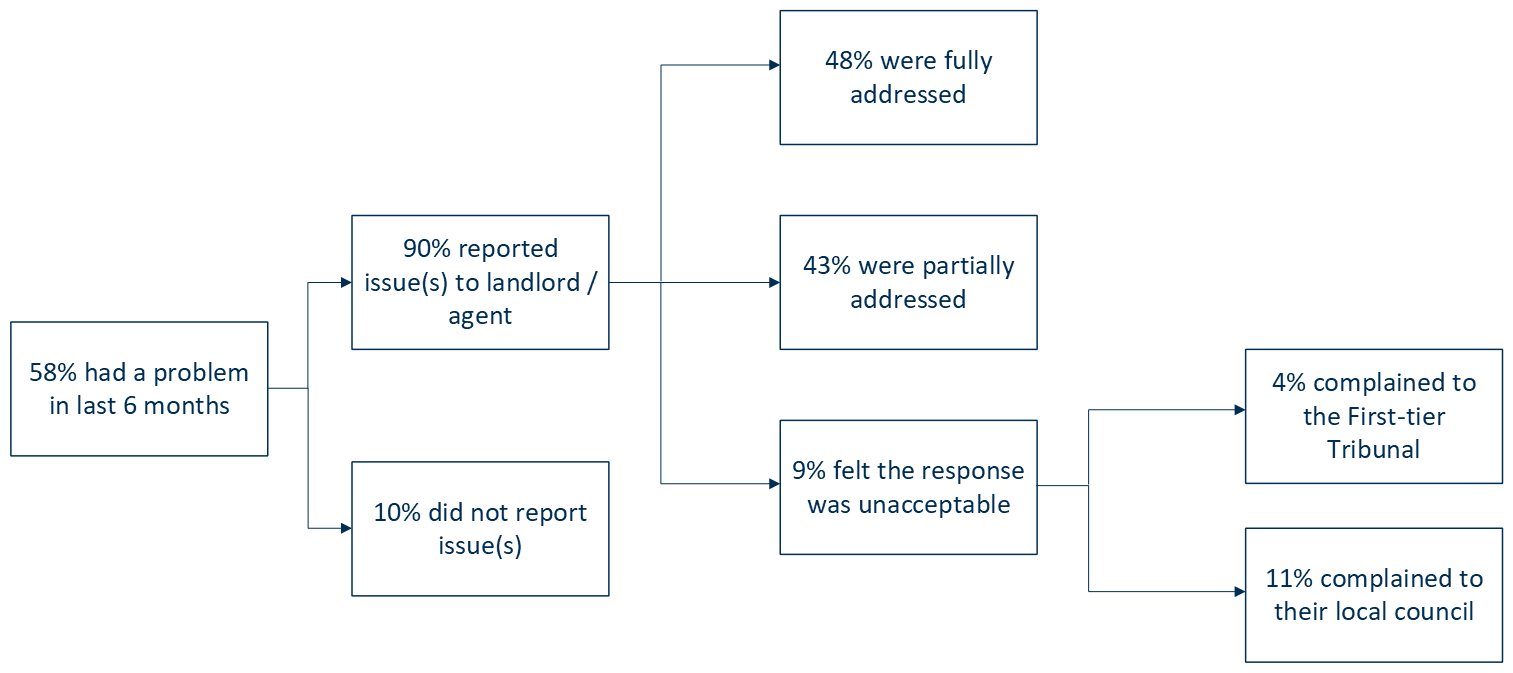
Source: The Voice of the Tenant Survey Scotland, Wave 2 (2026), p.29.
Knowing where to go if landlord fails to resolve issues
More private renters (63%) than social renters (48%) say that they know where to go if their landlord fails to address their issue or complaint (Voice of the Tenant survey).[24] This indicates relatively low awareness across both sectors, and a considerable awareness gap between them (Chart 41).
This limited awareness is consistent with Consumer Scotland’s earlier work, which highlighted a need to increase private renters’ awareness on their tenancy rights and how to resolve issues as they often do not pursue formal routes even when problems persist. The pattern observed here among social renters – where awareness is even lower – reinforces Consumer Scotland’s previous recommendation to improve understanding and awareness of rights and redress pathways in the rental sector.[25]
Awareness among social renters rises considerably with income, while awareness among private renters remains more stable across income groups. This suggests that lower-income social renters may particularly benefit from an awareness campaign on where to go if their landlord fails to address their issue or complaint.
Chart 41: Under half of social renters know where to go if their landlord fails to address their issue or complaint, lower than in the private sector
Percentage of respondents who know where to go if their landlord fails to address their issue or complaint, by sector
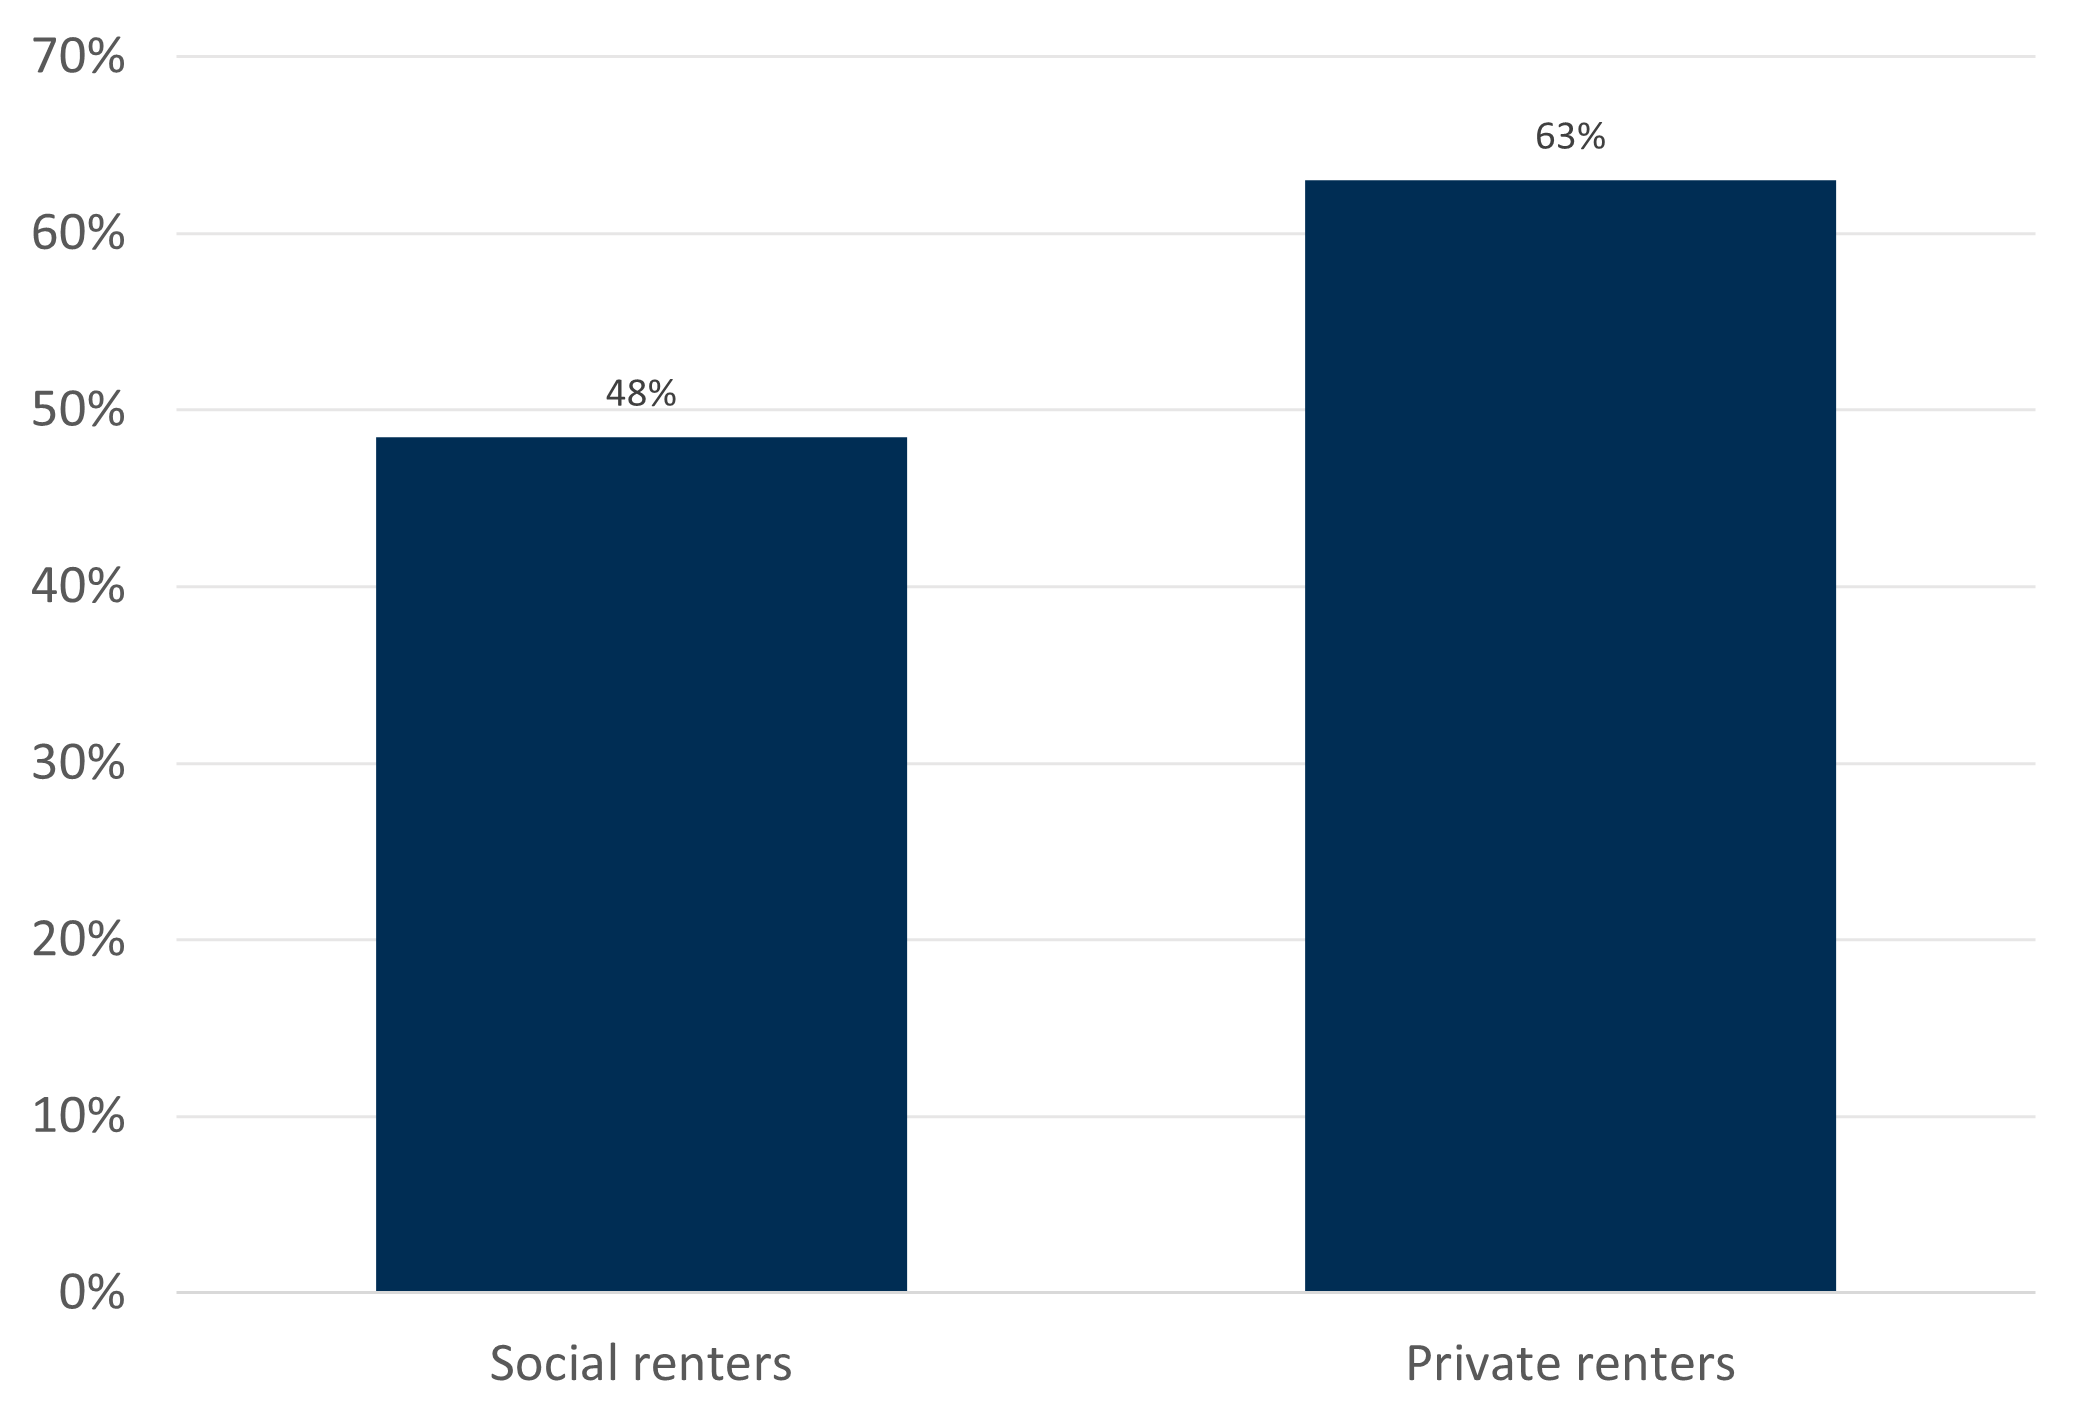
Source: Consumer Scotland’s Social rented sector survey, D10. Do you know where to go if your landlord fails to address your issue or complaint? Private rented sector figures are from Voice of the Tenant Survey Scotland, Wave 2 (2026), p.31. If you had a problem with your rented home that your landlord / letting agent failed to address, would you know where to take your complaint next?
Landlord relationship
Private renters are more likely to feel that they have a good relationship with their landlord (71%, Voice of the Tenant survey) than social renters (59%). However, this difference is largely driven by higher neutrality among social renters rather than higher dissatisfaction (Chart 42).
Chart 42: Private renters are more likely than social renters to feel that they have a good relationship with their landlord
Agreement with statement ‘I have a good relationship with my landlord’, by sector
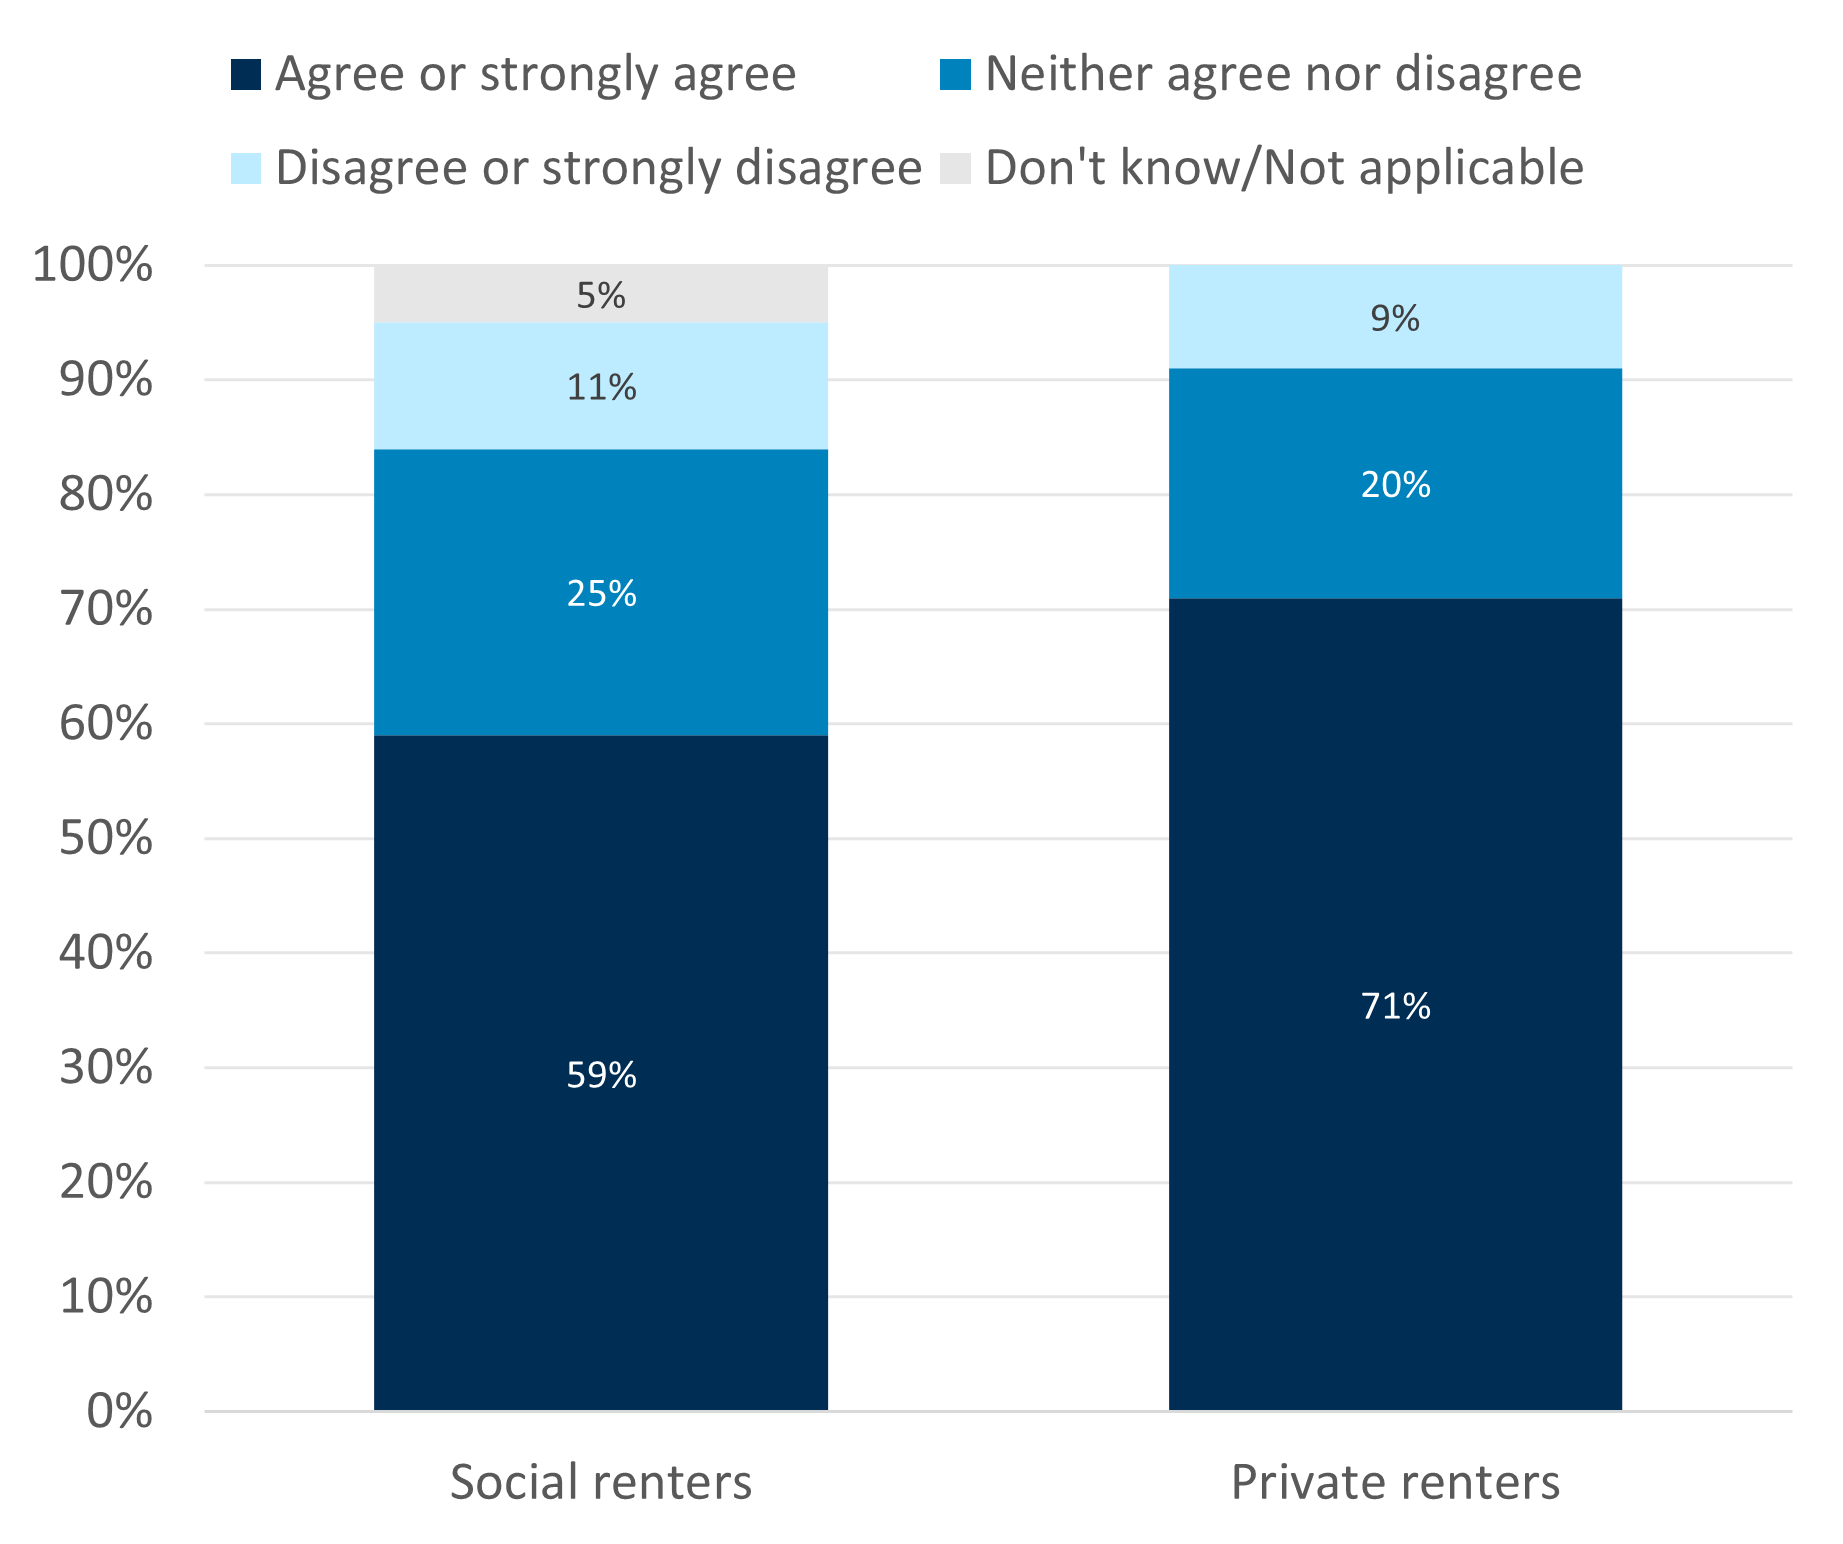
Source: Consumer Scotland Social renters survey, A4. To what extent do you agree or disagree with the following statements… I have a good relationship with my landlord. Private rented sector figures are from Voice of the Tenant Survey Scotland, Wave 2 (2026), p.26.
Landlord responsiveness
Private renters are more likely than social renters to feel that their landlord responds well on a range of areas (RentBetter survey, Chart 43).
For example, while a high proportion of social renters rated general contact well (72%), this was even higher among private renters (89%).
Similarly, the vast majority of private renters (83%) feel their landlord responds very or quite well to day‑to‑day repairs, compared with 64% of social renters. The gap is similar for ongoing maintenance, where 79% of private renters rate responsiveness well, compared with 59% of social renters.
However, a relatively high proportion of social renters respond “Don’t know / Not applicable” to certain areas. Even after excluding these responses, private renters remain more positive — particularly regarding support with rent difficulties or advice on social or community issues.
As previously discussed, differences between sectors may reflect underlying demographic and financial characteristics of the renter populations rather than from tenure alone. For example, private landlords may have stronger financial incentives to address renters’ queries or issues promptly, which could contribute to higher levels of responsiveness.
Chart 43: Private renters are more likely than social renters to rate landlord responsiveness well
Extent to which renters rate their landlord as responding or helping with different areas, by sector
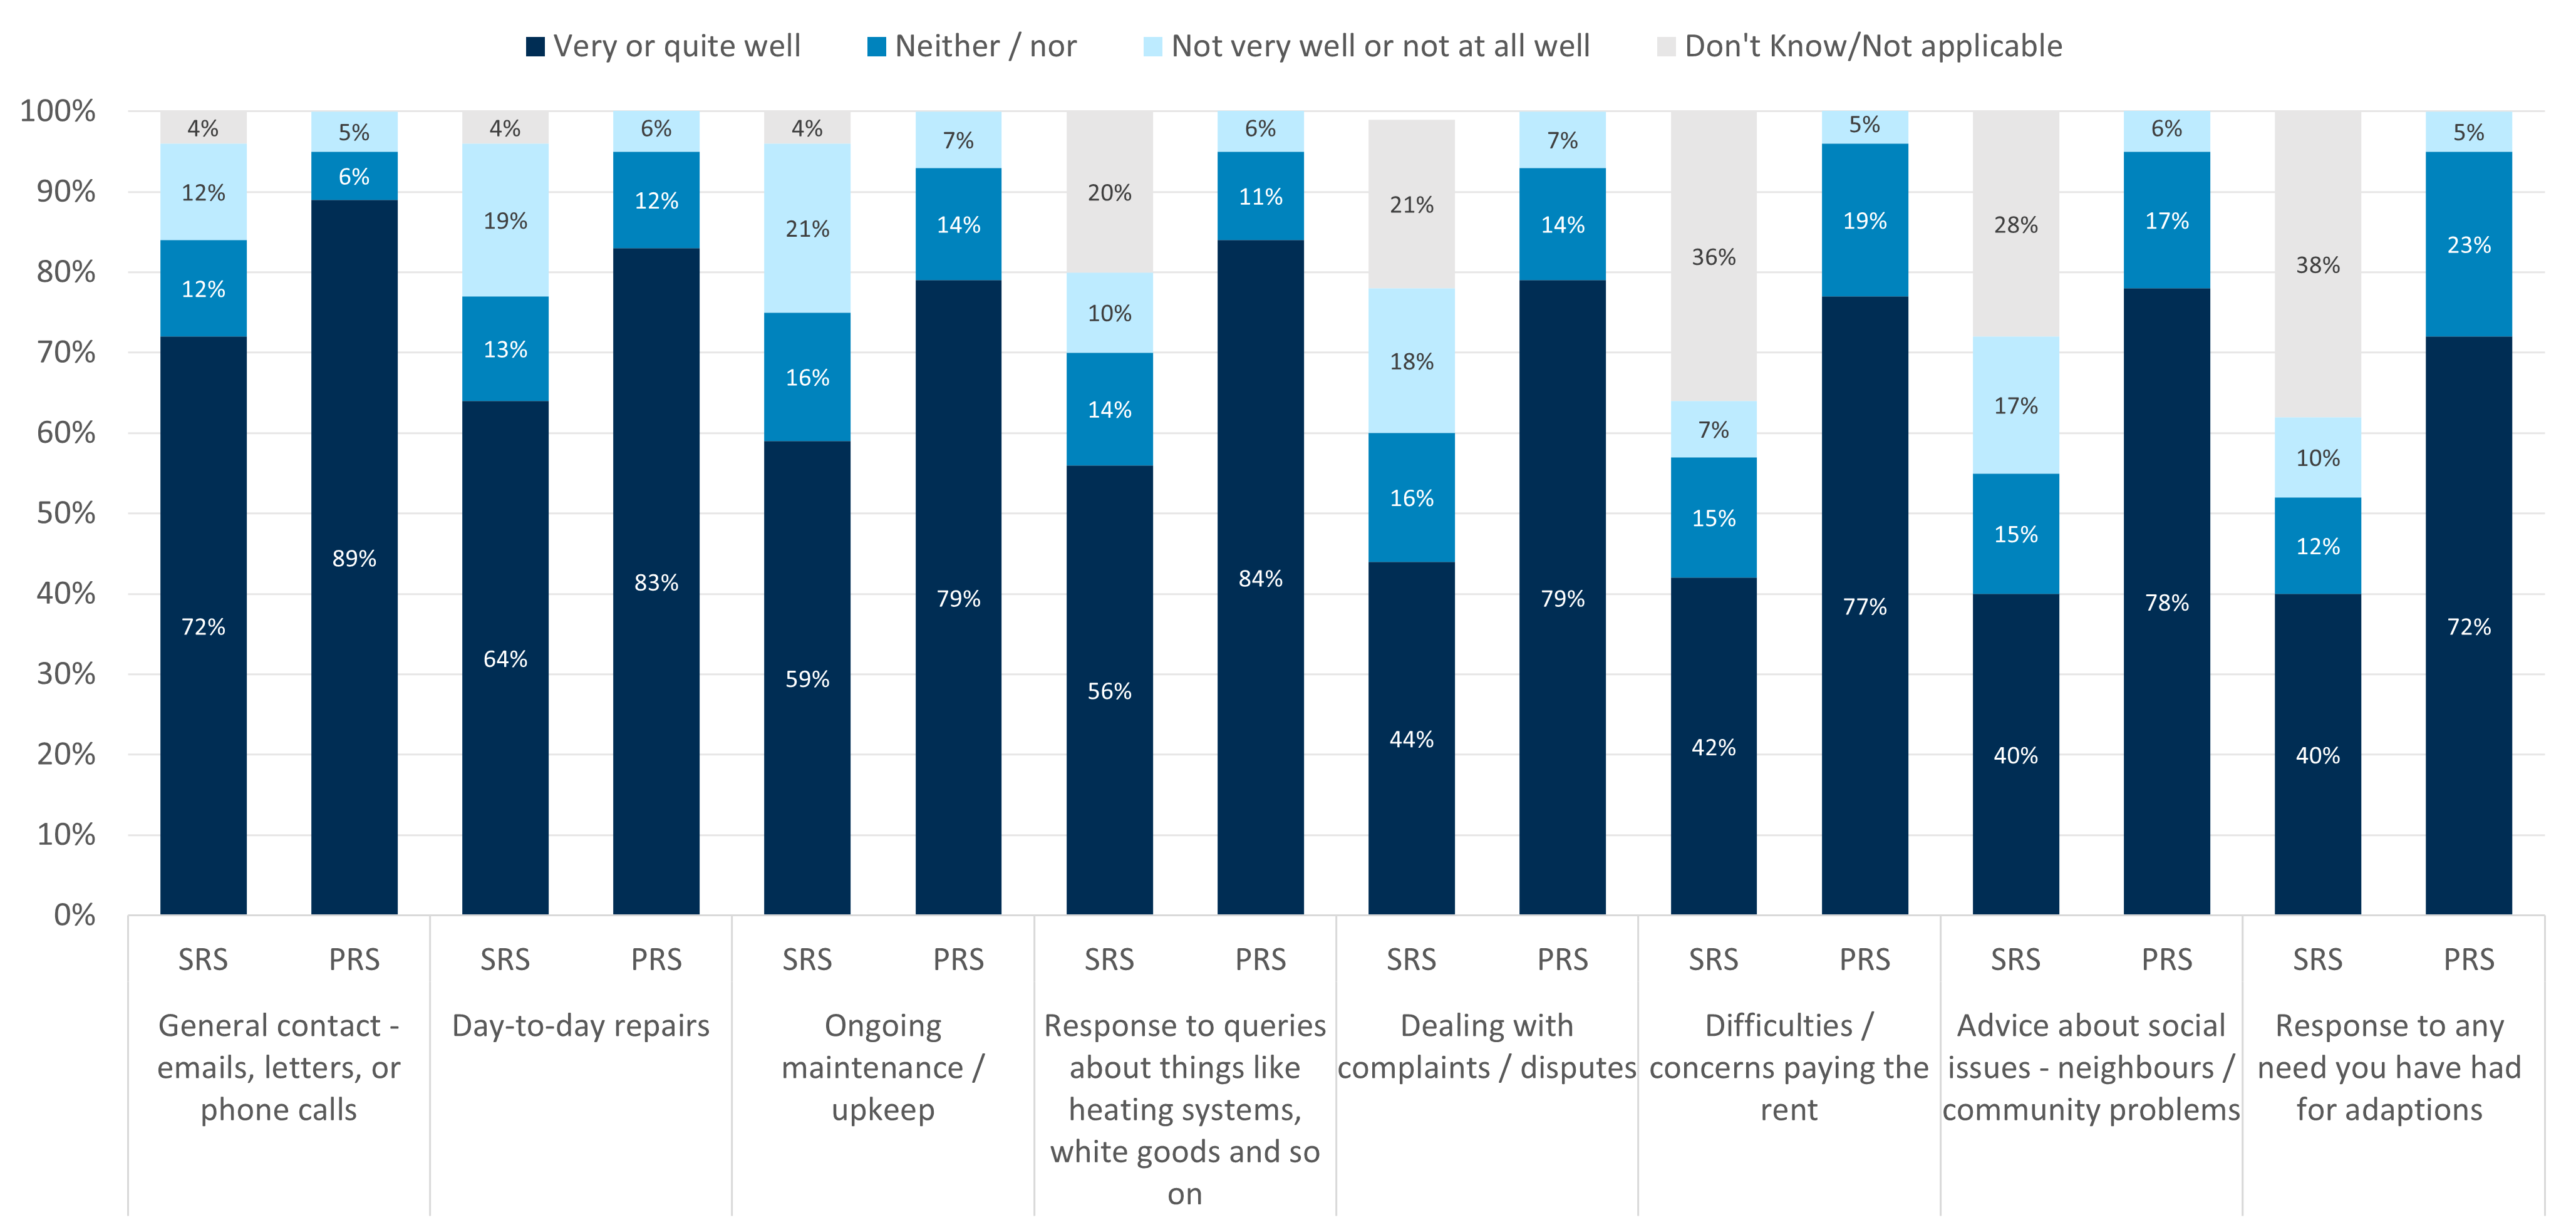
Source: Consumer Scotland Social renters survey, B1. How well, or not, does your landlord respond or help you with the following...? private rented sector figures are from RentBetter Wave 3 Tenants survey analysis.
13. Conclusion
This research provides one of the most comprehensive recent assessments of the experiences of renters in the Scottish social rented sector. Renters are generally positive about their renting experience, including property condition, repairs and maintenance. However, there are areas for improvement, such as complaints handling and awareness of rights and redress pathways. Moreover, certain groups of renters – particularly those with disabilities or health conditions that limit their day-to-day activities, those living in properties over 10 years old, and those without a known housing officer – consistently have poorer experiences overall.
Overall, renters in the social rented sector are satisfied, with most reporting positive experiences of their homes and landlord interactions. However, satisfaction is not universal, and our research also revealed that there are key areas where improvement is needed.
Problems with property condition are common, and resolution is often slow, incomplete, or poorly communicated, with some renters taking on the cost or work of repairs themselves. Complaints handling presents similar challenges, with low satisfaction at every aspect of the process, particularly for speed of resolution. At the same time, many renters are unaware of their rights or of where to seek help when landlords fail to act, limiting their ability to pursue redress or challenge unresolved issues.
Certain groups of renters consistently report poorer experiences across multiple measures, even after accounting for other characteristics. These include renters who have disabilities or health conditions that limit their day-to-day activities; younger and middle‑aged renters (particularly those aged 35-44); those living in older properties (over 10 years old) that have not been recently renovated; and those without a known housing officer or named point of contact. By contrast, renters aged 65 and over were overwhelmingly positive about their renter experience; they repeatedly reported having a better experience across many measures.
Comparisons with private rented sector data highlight several notable differences between sectors. Private renters are more likely than social renters to report experiencing condition‑related problems, yet they are also more likely to have their problems fully resolved. Social renters show far lower levels of concern about retaliatory eviction than private renters. And while awareness of where to go if their landlord fails to address an issue or complaint is low across both sectors, it is even lower among social renters. However, these differences should be interpreted with caution, as social and private renters vary substantially in their socio‑economic characteristics – including income and the types and costs of the properties they rent.
Taken together, the evidence points to a sector that works well for many, but where significant vulnerabilities remain. Ensuring a more equitable renting experience for different groups, improving complaint handling, and increasing awareness of rights – particularly for disabled renters, younger and middle‑aged tenants, and those in older homes – will be essential to ensuring more equitable outcomes and improving renter confidence across the sector.
14. Appendix A: Methodology
Following completion of a scoping study which identified a need for in-depth, quantitative research with a representative sample of social renters, Consumer Scotland commissioned IFF Research to conduct this survey research. The overall aim of this research was to develop a better understanding of the experience of social renters in Scotland and to identify what factors would help improve their renting experience.
Research objectives
The objectives of the research were to:
- Gather quantitative evidence on the renting experience of social rented sector tenants to allow us to generate policy recommendations and conduct advocacy aimed at improving outcomes in the social rented sector
- Compare evidence from the social rented sector with existing evidence around the experience of private rented sector tenants, to allow the identification of disparities in outcomes across tenure types or across groups of consumers. This will support advocacy to improve outcomes in both sectors
Research questions
The key research questions were:
- What are the key issues affecting social rented sector tenants that could be addressed through changes in policy and/or practices?
- How does experience differ across tenures (e.g. between tenants with council and housing association landlords, and between private and social renters) and demographics?
Method
Consumer Scotland commissioned IFF Research to conduct this research in two stages. A design and pilot stage was carried out between January and April 2025, with mainstage fieldwork commencing in July 2025.
Review
The first stage of the research design was to review existing surveys of both social and private renter experiences and relevant publications including:
- Consumer Scotland (2024), A Fairer Rental Market: Consumer challenges in the private and social rented sectors: Scoping study[26]
- Scottish Housing Regulator (2025), National Panel of Tenants and Service Users 2024 to 2025[27]
- Scottish Housing Regulator (2024), National Report on the Scottish Social Housing Charter - Headline Findings - 2023-2024[28]
- SafeDeposits Scotland Charitable Trust (2024), Living in the Private Rented Sector in 2024: The Voice of the Tenant Survey Scotland (Wave 1)[29]
- Indigo House in association with IBP Strategy and Research (2024), Rent Better: Wave 3 Tenants survey analysis report[30]
- Regulator of Social Housing (2024), Tenant Satisfaction Measures 2023/24: Key findings[31]
- IFF Research (2024), Tenant Satisfaction Measures: Key trends and Insights from the first year[32]
Analysis from this phase was collated into a framework by IFF Research, identifying key topic areas to take forward into the primary research stages. The review identified three key service areas – repairs and maintenance, tenant communication, and security of tenure – as central to overall tenant satisfaction. It also highlighted affordability and accessibility challenges for private rented tenants, which were explored further in social renters focus groups.
The review emphasised the need to examine tenant engagement, trust in landlords, and how easily tenants can navigate the housing system within the mainstage survey. Addressing these topics would provide meaningful insights to inform improvements in housing services and policy across both sectors.
Focus groups
As part of the design phase Consumer Scotland also wanted to include the perspective of Scottish social renters themselves on what issues might require further research. We therefore commissioned IFF Research to conduct three focus groups with 18 tenants in total. The focus groups explored the following topic areas:
- Accessibility, affordability, and security of tenure
- The landlord–tenant relationship
- Tenant interactions
- Reporting issues and renters’ rights
- Engagement and communication
Focus group participants were recruited by Taylor McKenzie Research. A structured sampling framework and detailed screening process were applied to ensure a diverse mix of tenants, capturing a broad range of perspectives across demographic groups. Participants received incentive payments of £50 in recognition of their time.
Fieldwork took place during the week commencing 10 February 2025 and comprised three virtual focus groups conducted via Microsoft Teams, each with 5-7 participants and lasting 90 minutes.
Participants were selected to be representative across key demographics, including age, gender, ethnicity, urban/rural location, income level, employment status, disability status, property type, and landlord type (council vs. housing association).
During analysis, each group discussion was mapped against the initial thematic framework. For each topic, both the importance (the extent to which the issue shaped or influenced their overall renting experience) and the impact (the severity or consequences experienced when problems arose) were assessed.
The focus groups highlighted several areas for inclusion in the pilot survey, centred on tenant experiences with housing allocation, repairs, communication, landlord relationships, and overall satisfaction.
Key findings included:
- Frustration with inconsistent waiting times for accessing or moving within social housing, with tenants feeling that individual needs were not always recognised
- Repairs dominated discussion, with many reporting damp, mould, and poor build quality – issues more common in older properties than newer ones
- Communication challenges were widespread, including delays, lack of follow-up, and reliance on online channels. Tenants expressed a need for more personal and consistent contact with housing officers
- Many tenants lacked awareness of their rights, particularly around repairs, and wanted greater transparency and involvement in decision-making
- Accessibility was less of a concern, though waiting times remained an issue. Tenants felt rent offered good value but were more sceptical about service charges
Pilot
Following the analysis of review and focus group findings, a pilot survey of approximately 15 minutes in length was developed. A key consideration in design was to ensure that key questions would generate data comparable with existing measures, including the Tenant Satisfaction Measures for Social Housing tenants, the Rent Better Research Programme, and the SafeDeposits Scotland Voice of the Tenant Survey Scotland, which capture insights from private rented sector tenants.
Fieldwork was conducted between 20 and 27 March 2025. A total of 100 responses were collected, with representation across age groups and a balanced mix of Local Authority and Registered Social Landlord tenants.
After reviewing results of the pilot, minor changes were made to the questionnaire to be taken forward to the mainstage.
Mainstage
Fieldwork for the mainstage of the research was conducted between July and September 2025.
Questionnaire
- The final survey included the following areas:
- General satisfaction with the social housing landlord
- Communication with the social housing landlord
- Property conditions and standards
- Issues, complaints and rights
- Accessibility and security of tenure
- Thoughts for improvement
- Property and tenancy details
- Demographics
Sampling
The mainstage survey used a blended online panel approach supplemented with CATI Lifestyle telephone interviews to achieve a total sample size of 1,400 Scottish socially renting tenants.
It was important that the survey achieved responses from across the social housing sector and was not overly skewed towards council or housing association tenants. Therefore, a quota was set on the proportions of council and housing association respondents. Other demographics were allowed to fall naturally in the sample but were monitored throughout the fieldwork.
The blended panel approach was used to maximise the number of participants. 3 online panels (Savanta, Yonder, and Norstat) were used to gather a sample of 1,050 Scottish tenants in the social rented sector.
In order to minimise digital exclusion in the sample, a further 350 participants were surveyed by IFF Research via telephone with the sample supplied by Sagacity. Monitoring of the online sample showed a bias towards younger participants, so the telephone interviews were initially targeted at older social renters to boost this demographic before being opened up more widely.
Profile of respondents
Comparison with demographics for Scotland’s social rented sector from the 2022 Census and 2022 Scottish Household Survey (SHS) provided that, while our sample was broadly representative, the age profile differed slightly from what would be expected.
The age profile of the achieved sample being slightly older than other large data sets would suggest. We therefore applied weighting to adjust the sample to be in line with the age profile suggested by the Scottish Household Survey 2022.
Property characteristics
Within the social rented sector, there has been a significant shift from council stock to housing association stock. As of 31st March 2024, there were 633,030 social rented properties in Scotland, roughly evenly split between council (325,477) and housing association homes (307,553).[33]
In line with these published figures, survey respondents are roughly evenly split between homes managed by councils and those managed by housing associations (Table 14.3).
The properties themselves vary in age and condition. While fewer than one in five (18%) respondents describe their home as a newer building (built within the last 10 years), 41% live in recently renovated older properties (over 10 years old but recently renovated), and a third (33%) live in older unrenovated properties (over 10 years old and not recently renovated).[34] A 10‑year cut‑off was used as it provides respondents with a clearer and more meaningful way to assess the age and condition of their property, reducing uncertainty for those who may not know the exact year their home was built or last upgraded.
Flats (including tenements, maisonettes, apartments, and bedsits) make up over half (54%) of all property types, while houses and bungalows account for just under half (44%).[35]
Analysis
Frequency tables were produced to summarise overall patterns in the survey data, providing a clear view of tenant responses across key measures. Cross-tabulations were then used to examine differences between demographic and tenancy groups, supported by chi-square tests to identify statistically significant associations. This approach enabled a robust assessment of how experiences and perceptions vary across the tenant population.
To explore this further, we performed logistic regression analyses to model the probability of an outcome variable (such as overall satisfaction), as a function of various explanatory variables. Unless otherwise specified, all demographic differences reported are statistically significant at the 95% confidence level, and remain significant after accounting for relevant factors, including: renter age; known housing officer; children under 18 in household; limiting disability or health condition; household income; landlord type; property age and condition; property type; tenancy length; single adult household.
Where comparable, findings are compared to published results from two recent surveys of private rented sector tenants – the Rent Better Research Programme, and the SafeDeposits Scotland Voice of the Tenant Survey Scotland. It is important to note that social and private sector renter populations differ in several socio‑economic characteristics, including household income and the nature and cost of the properties they rent. As a result, differences between sectors should be interpreted with caution, as they may reflect these underlying demographic and financial factors rather than differences in tenure alone. Where possible, we compare results across income bands to help mitigate these differences.
Fuller information about the survey is available on request and in an accompanying report.
15. Endnotes
[1] Survey respondents were asked “H7. Do you have any physical or mental health conditions, lasting or expected to last for 12 months or more?” and “H8. Do any of your conditions or illnesses reduce your ability to carry out day-to-day activities?” The definition is based on the Scottish Government’s harmonised disability and long‑term conditions questions. For the purposes of discussing the findings, we have used the wording that was used in the survey. The policy briefing that accompanies this analysis primarily uses identity first language, referring to disabled renters rather than renters with a disability or health condition. This identity first language reflects the social model of disability which recognises that people are disabled by society not by their impairment or condition.
[2] Scottish Government (2024). Housing Statistics for Scotland, 2022-23. Available at: https://www.gov.scot/news/housing-statistics-for-scotland-2022-23/
[3] Consumer Scotland. (2024). A Fairer Rental Market: Consumer challenges in the private and social rented sectors. Available at: https://consumer.scot/publications/a-fairer-rental-market-consumer-challenges-in-the-private-and-social-rented-sectors/
[4] Scottish Housing Regulator. (2025). National Panel of Renters and Service Users 2024 to 2025. Available at: https://www.housingregulator.gov.scot/for-renters/national-panel-of-renters-and-service-users-research-reports/national-panel-of-renters-and-service-users-2024-to-2025/
[5] Scottish Housing Regulator. (2025). National Report on the Scottish Social Housing Charter - 2024-2025. Available at: https://www.housingregulator.gov.scot/landlord-performance/national-reports/national-reports-on-the-scottish-social-housing-charter/national-report-on-the-scottish-social-housing-charter-2024-2025/
[6] Scottish Government. (2025). Scottish House Condition Survey. Available at: https://www.gov.scot/collections/scottish-house-condition-survey/
[7] Consumer Scotland (2024). A Fairer Rental Market: Consumer challenges in the private and social rented sectors: Scoping study. Available at: https://consumer.scot/publications/a-fairer-rental-market-consumer-challenges-in-the-private-and-social-rented-sectors/
[8] Indigo House in association with IBP Strategy and Research. (2024). RentBetter Wave 3 Tenants survey analysis report. Available at: https://rentbetter.indigohousegroup.com/wp-content/uploads/sites/3/2022/05/Tenant-survey-report-FINAL-AE210824-publication.pdf.
[9] SafeDeposits Scotland Charitable Trust (2026). The Voice of the Tenant Survey Scotland (Wave 2). Available at: 99b051_b6df88580ebd45d1b924e7954c3eed5c.pdf
[10] Regulator of Social Housing (2024). Tenant Satisfaction Measures 2023/24: Key findings. Available at: https://www.gov.uk/government/statistics/tenant-satisfaction-measures-202324. These satisfaction measures are used in England to survey tenants’ experiences in Social Housing
[11] Indigo House in association with IBP Strategy and Research. (2024). RentBetter Wave 3 Tenants survey analysis report. Available at: https://rentbetter.indigohousegroup.com/wp-content/uploads/sites/3/2022/05/Tenant-survey-report-FINAL-AE210824-publication.pdf.
[12] SafeDeposits Scotland Charitable Trust (2024). The Voice of the Tenant Survey Scotland (Wave 1). Available at: https://www.safedepositsscotlandtrust.com/post/the-voice-of-the-tenant-survey
[13] Logistic regression analyses accounted for: renter age; known housing officer; children under 18 in household; limiting disability or health condition; household income; landlord type; property age and condition; property type; tenancy length; single adult household.
[14] Scottish Government. (2026). Scottish House Condition Survey: 2024 Key Findings. Available at: https://www.gov.scot/publications/scottish-house-condition-survey-2024-key-findings/pages/key-findings-summary/
[15] This chart (and all charts in the report) presents descriptive statistics only for demographic variables that showed statistically significant subgroup differences in logistic regression models (controlling for other factors). The accompanying text specifies which groups differ significantly. For example, chart 4.1 presents renter age because differences in satisfaction levels between the subgroups (e.g. 35-44 compared with 65+) were significant even after controlling for other factors.
[16] As with the other logistic regressions conducted, this model included the dependent variable (here, overall satisfaction) and a set of independent variables (listed) capturing renter and property characteristics. However, it differs in that it also incorporates the experience‑based measures as additional explanatory variables.
[17] Scottish Government (2026). Scottish House Condition Survey: Chapter 2 Energy Efficiency. Available at: https://www.gov.scot/publications/scottish-house-condition-survey-2024-key-findings/pages/2-energy-efficiency/
[18] Scottish Government (2026). Scottish House Condition Survey: Chapter 2 Energy Efficiency. Available at: https://www.gov.scot/publications/scottish-house-condition-survey-2024-key-findings/pages/5-housing-conditions/#:~:text=5.2.3%C2%A0Scottish%20Housing%20Quality%20Standard%20(SHQS)
[19] Scottish Government (2026). Scottish House Condition Survey 2024: Chapter 3 Fuel Poverty. Available at: https://www.gov.scot/publications/scottish-house-condition-survey-2024-key-findings/pages/3-fuel-poverty/
[20] Known housing officer refers to renters who have a housing officer or named point of contact AND know how to contact them. ‘Without known housing officer’ includes renters who have a housing officer or named point of contact but do not know how to contact them, as well as those who do not have one or are unsure whether they do.
[21] SafeDeposits Scotland Charitable Trust (2026). The Voice of the Tenant Survey Scotland (Wave 2). Available at: 99b051_b6df88580ebd45d1b924e7954c3eed5c.pdf
[22] Although this question wording is similar to D11‑3: “I know where to go for advice, support, or information if I have a problem that my landlord has not resolved to my satisfaction.”, it measures slightly different aspects of the same topic. These differences in framing and question order likely explain why D11‑3 produces a higher figure of awareness (61%) than the more specific D10 (48%). D10 was asked to enable comparison with the same question used in the private rented sector survey Voice of the Tenant. As such, this metric is used as the headline figure of tenant awareness of where to go.
[23] We examined Voice of the Tenant data by income band and compared it with our social renters data to understand how experiences vary across income levels and whether cross-sector patterns were consistent.
[24] The private rented survey question is slightly different so comparisons should be interpreted with this in mind: If you had a problem with your rented home that your landlord / letting agent failed to address, would you know where to take your complaint next?
[25] Consumer Scotland (2025). A Fairer Rental Market: Exercising tenancy rights in Scotland’s private rented sector. Available at: https://consumer.scot/publications/a-fairer-rental-market-exercising-tenancy-rights-in-scotland-s-private-rented-sector-html/
[26] Consumer Scotland (2024). A Fairer Rental Market: Consumer challenges in the private and social rented sectors. Available at: https://consumer.scot/publications/a-fairer-rental-market-consumer-challenges-in-the-private-and-social-rented-sectors/
[27] Scottish Housing Regulator (2025). National Panel of Tenants and Service Users 2024 to 2025. Available at: https://www.housingregulator.gov.scot/for-tenants/national-panel-of-tenants-and-service-users-research-reports/national-panel-of-tenants-and-service-users-2024-to-2025/
[28] Scottish Housing Regulator (2024). National Report on the Scottish Social Housing Charter - Headline Findings - 2023-2024. Available at: https://www.housingregulator.gov.scot/landlord-performance/national-reports/national-reports-on-the-scottish-social-housing-charter/national-report-on-the-scottish-social-housing-charter-headline-findings-2023-2024/
[29] SafeDeposits Scotland Charitable Trust (2024). The Voice of the Tenant Survey Scotland (Wave 1). Available at: https://www.safedepositsscotlandtrust.com/post/the-voice-of-the-tenant-survey
[30] Indigo House in association with IBP Strategy and Research. (2024). RentBetter Wave 3 Tenants survey analysis report. Available at: https://rentbetter.indigohousegroup.com/wp-content/uploads/sites/3/2022/05/Tenant-survey-report-FINAL-AE210824-publication.pdf
[31] Regulator of Social Housing (2024). Tenant Satisfaction Measures 2023/24: Key findings. Available at: https://www.gov.uk/government/statistics/tenant-satisfaction-measures-202324. These satisfaction measures are used in England to survey tenants’ experiences in Social Housing
[32] IFF Research (2024). Exploring year 1 of tenant satisfaction measures. Available at: https://www.iffresearch.com/blogs/exploring-year-1-of-tenant-satisfaction-measures/
[33] Scottish Government. (2025). Housing statistics 2024: Key trends summary. Available at: https://www.gov.scot/publications/housing-statistics-2024-key-trends-summary/pages/social-housing-stock/
[34] The property age and condition definitions are: newer (“Newer property – built within the last 10 years” or “Newer property but recently renovated (including energy efficiency adaptations)”); recently renovated older (“Older property but recently renovated property (including energy efficiency adaptations)”; older unrenovated (“Older property – with no recent renovations”). Respondents were asked which of these 4 categories best describes their property.
[35] Flats refers to flats, tenements, maisonettes, apartments and bedsits and houses refers to houses and bungalows.