1. About us
Consumer Scotland is the statutory body for consumers in Scotland. Established by the Consumer Scotland Act 2020, we are accountable to the Scottish Parliament. The Act defines consumers as individuals and small businesses that purchase, use or receive in Scotland goods or services supplied by a business, profession, not for profit enterprise, or public body.
Our purpose is to improve outcomes for current and future consumers, and our strategic objectives are:
- to enhance understanding and awareness of consumer issues by strengthening the evidence base
- to serve the needs and aspirations of current and future consumers by inspiring and influencing the public, private and third sectors
- to enable the active participation of consumers in a fairer economy by improving access to information and support
Consumer Scotland uses data, research and analysis to inform our work on the key issues facing consumers in Scotland. In conjunction with that evidence base we seek a consumer perspective through the application of the consumer principles of access, choice, safety, information, fairness, representation, sustainability and redress.
2. Overview of postal affordability in Scotland
Introduction
The Postal Services Act 2011 sets out a range of postal services that must be provided at affordable prices for consumers in the UK. However, there is no definition of affordability included within the Act and no other generally applied affordability definition across the UK postal sector.
In some markets, such as energy and water, affordability is often measured by considering what proportion of income households spend on those services. Income can be measured before or after various other ‘essentials’.
This approach makes sense for services like energy or water, where virtually all households incur spending, where it is difficult for households to respond to price rises by reducing their usage, and where expenditures typically account for a reasonable share of income.
In this paper we similarly measure affordability of post by considering the percentage of income that households spend on post. However, in the context of post this measure has some limitations. When it comes to postal services, households do have greater ability to respond to price rises by reducing their use of services, and because the value of expenditure is typically much lower.
An alternative approach to examining the affordability of postal services is to ask consumers whether they think postal services are either ‘affordable’ or ‘expensive’. A limitation of this approach is that it can be difficult to separate ‘affordability’ from the concept of ‘value for money’. A consumer might think that a First Class stamp is expensive or not value for money, but that does not necessarily mean that the stamp is unaffordable.
A third approach is to ask consumers what the implications would be for them of having to send an essential item of mail – would they have to cut back on other items of spending for example?
In this paper we report on several dimensions of affordability and value for money to support Consumer Scotland’s response to the Ofcom’s consultation on the future of the Universal Service Obligation. These draw on a mix of official expenditure statistics, Consumer Scotland survey research, and Ofcom data. The measures include:
- Affordability measured as spending on stamps as a percentage of income (both total income and a measure of ‘discretionary income’)
- Consumer perceptions of affordability and value-for-money
- Consumers’ anticipated behaviours when confronted by an essential need to purchase stamps.
The context to this analysis is the significant real terms increases in the price of First Class stamps in particular.[1] The price of a First Class stamp has increased from 65p in 2017 to £1.70 in 2025. Adjusting for wider inflation this is an increase of almost 100%. The price of a Second Class stamp has increased from 56p to 87p; a rise of 18% after adjusting for wider inflation.
Chart 1: Stamp prices have increased in real terms over the past 5 years
First- and second-class stamp prices over time, in cash terms and real (2024) prices
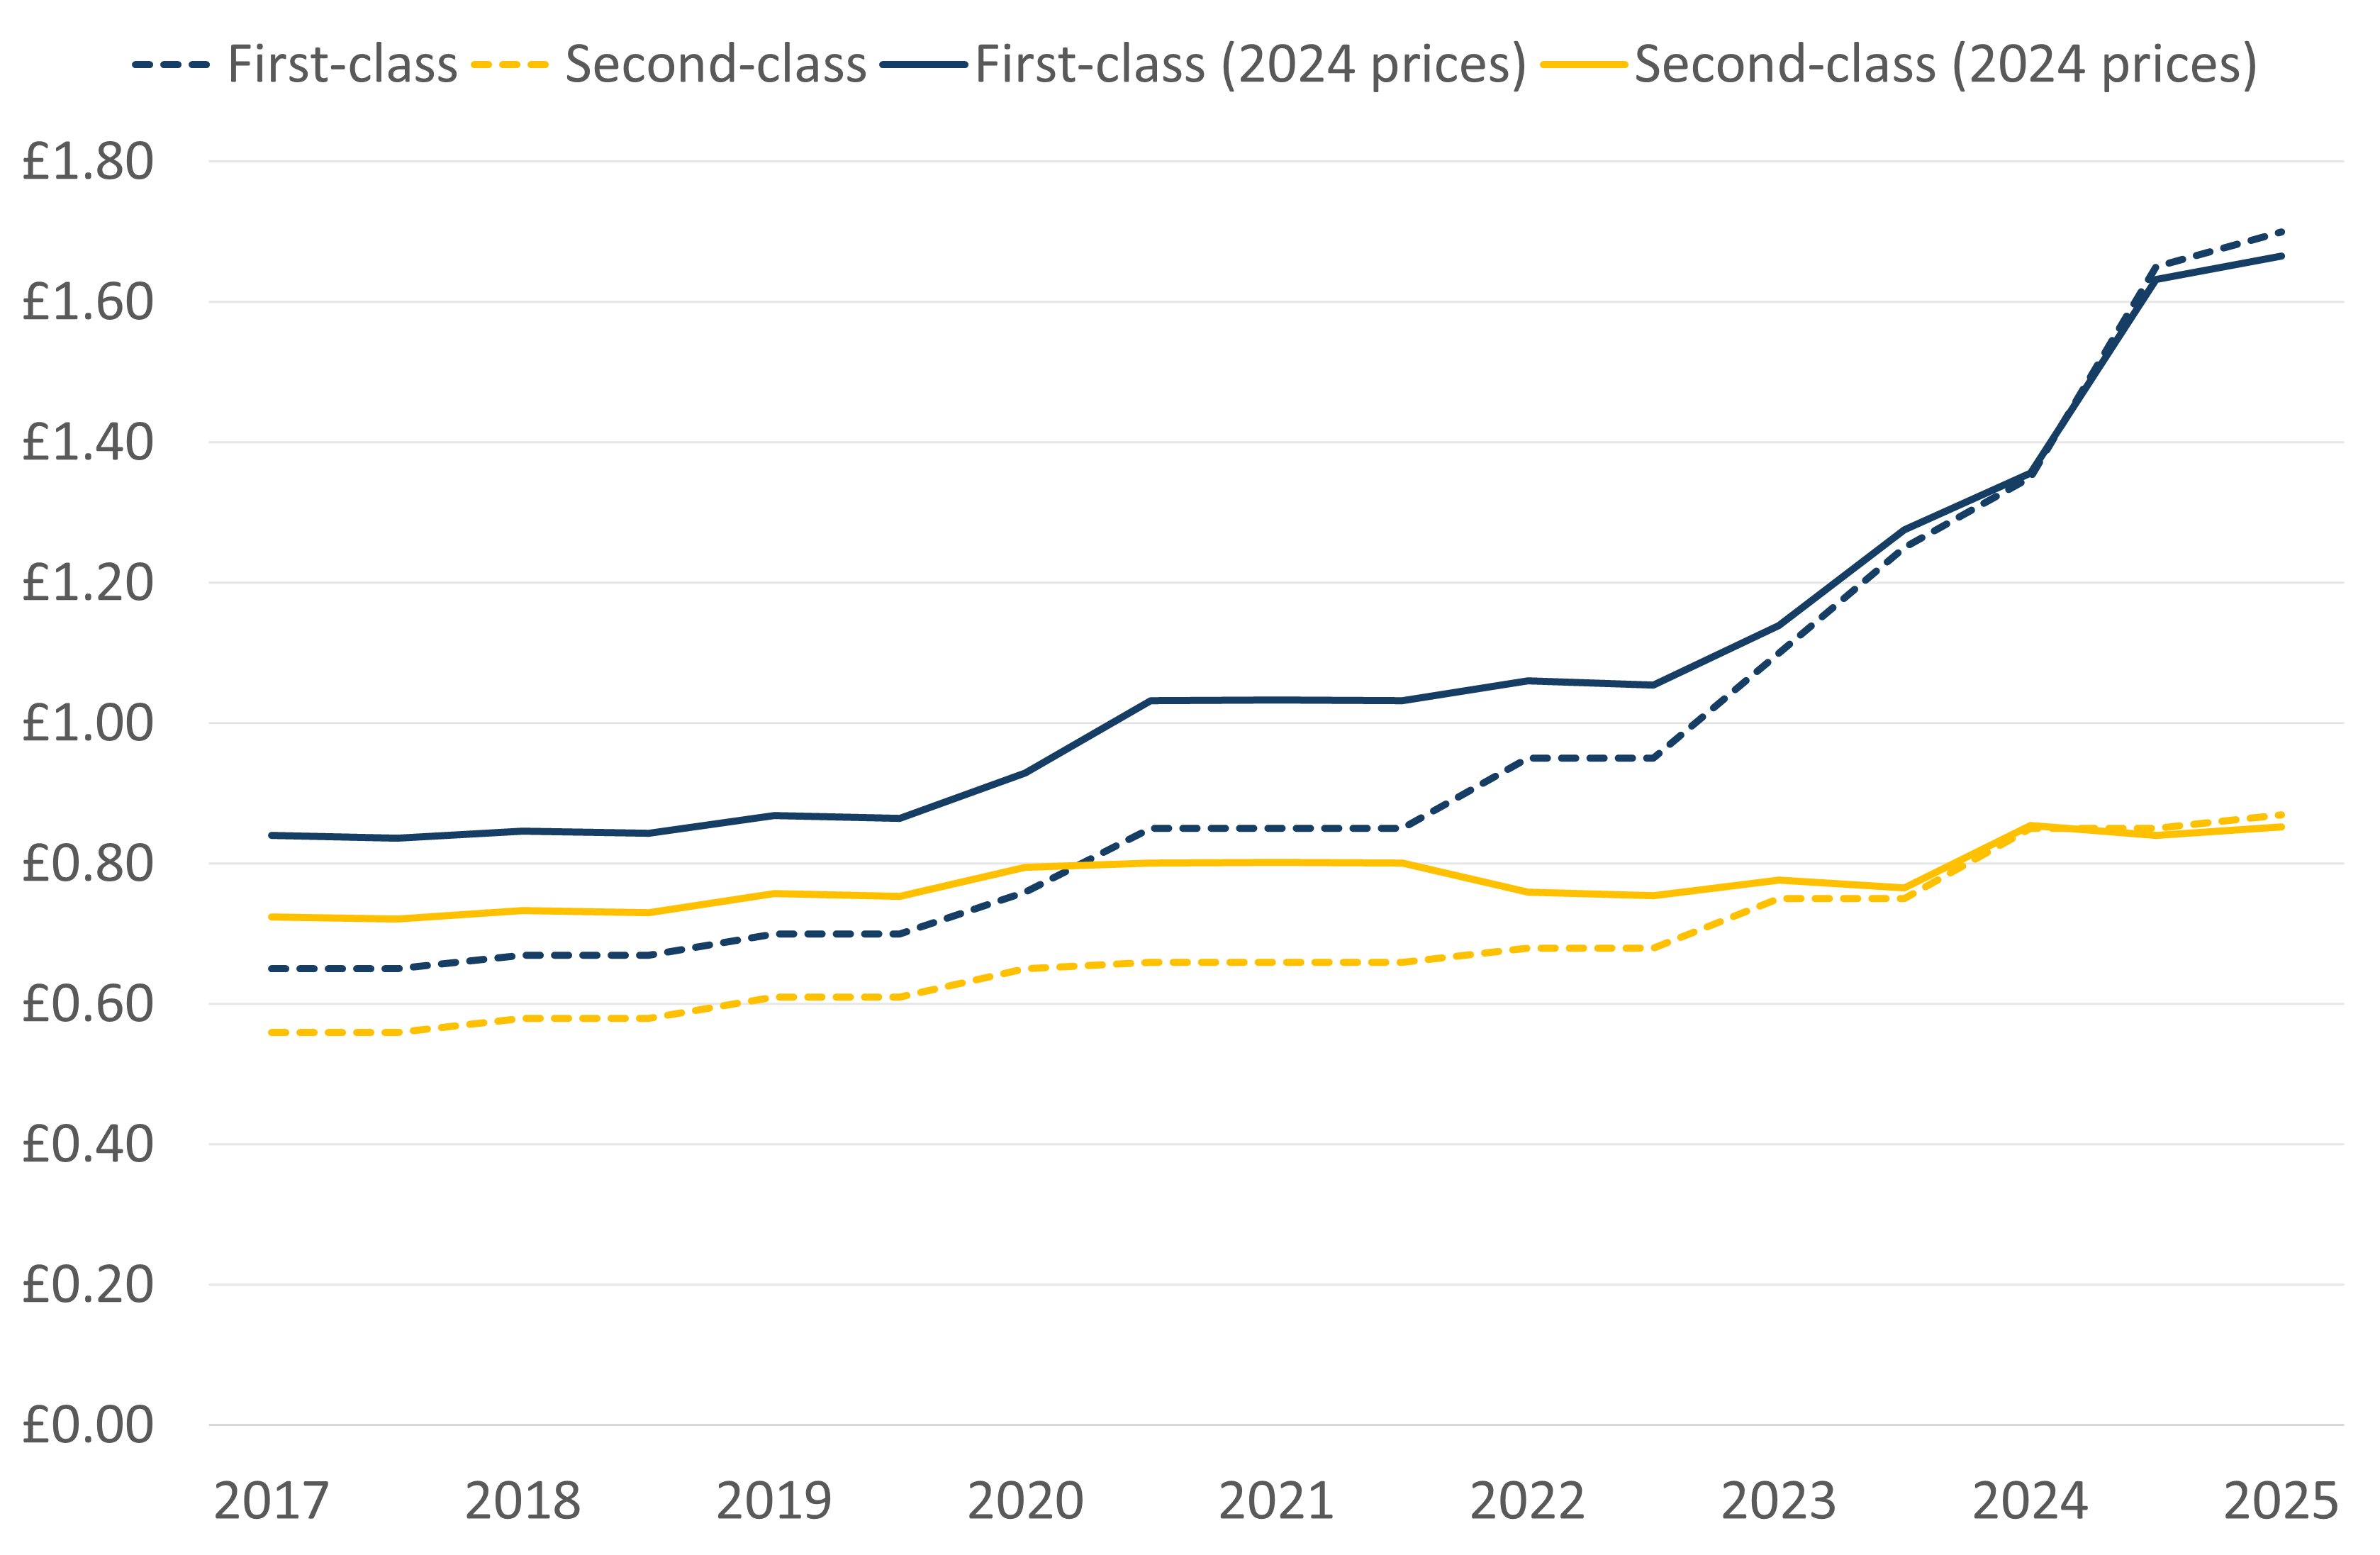
Source: The Price of a Stamp UK stamp price inflation since 1971
Consumer Scotland analysis – spending on postal services
Consumer Scotland conducted analysis using the Office for National Statistics’ Living Costs and Food Survey (LCF).[2] The survey contains a variable on 'postage and poundage‘ expenditure, which includes post office expenditure such as stamps, registered mail or similar post office services. Expenditure is collected as part of a diary recording all expenditure over a 14-day period and is then converted into a ‘weekly equivalent amount’ – the amount households spent on postal services during a week.
Scottish respondents’ data was pooled and analysed for the financial years 2017/18 to 2022/23 (the most recent available) to maximise sample size.
Households generally spend a small amount of money on postal services especially when compared to other communication methods such as telephone, mobile phone and internet.
Across the 6 years (2017/18 to 2022/23), the majority of households in Scotland (85%) spent £0 on postal services per week, with an average weekly expenditure of £1.04 (including those who spent £0 on postal services). If a household spends no money on postal services during the 14-day reporting period, this does not necessarily mean that they never do so, particularly as expenditure is seasonal. Results should be interpreted with this in mind.
Certain households spent statistically significantly more money on postal services in a week:
- Households in rural areas spent more (£1.43) compared to those in urban areas (86p)
- Households with direct internet access spent more (£1.09) compared to those without direct internet access (55p)
- Households where the oldest person is aged 65 and over spent more (£1.39) compared to those where the oldest person is under 65 (88p)
However, Ofcom’s research suggests that post is seen as unaffordable at specific times of the year, when demand for postal services is higher[3]. As would be expected, the LCF analysis found that post expenditure is seasonal, with higher amounts spent in December compared to the rest of the year. This difference was statistically significant and therefore can be generalised to the wider population.
Chart 2: Postal services expenditure is higher in December compared to the rest of the year
Weekly postal services expenditure by month
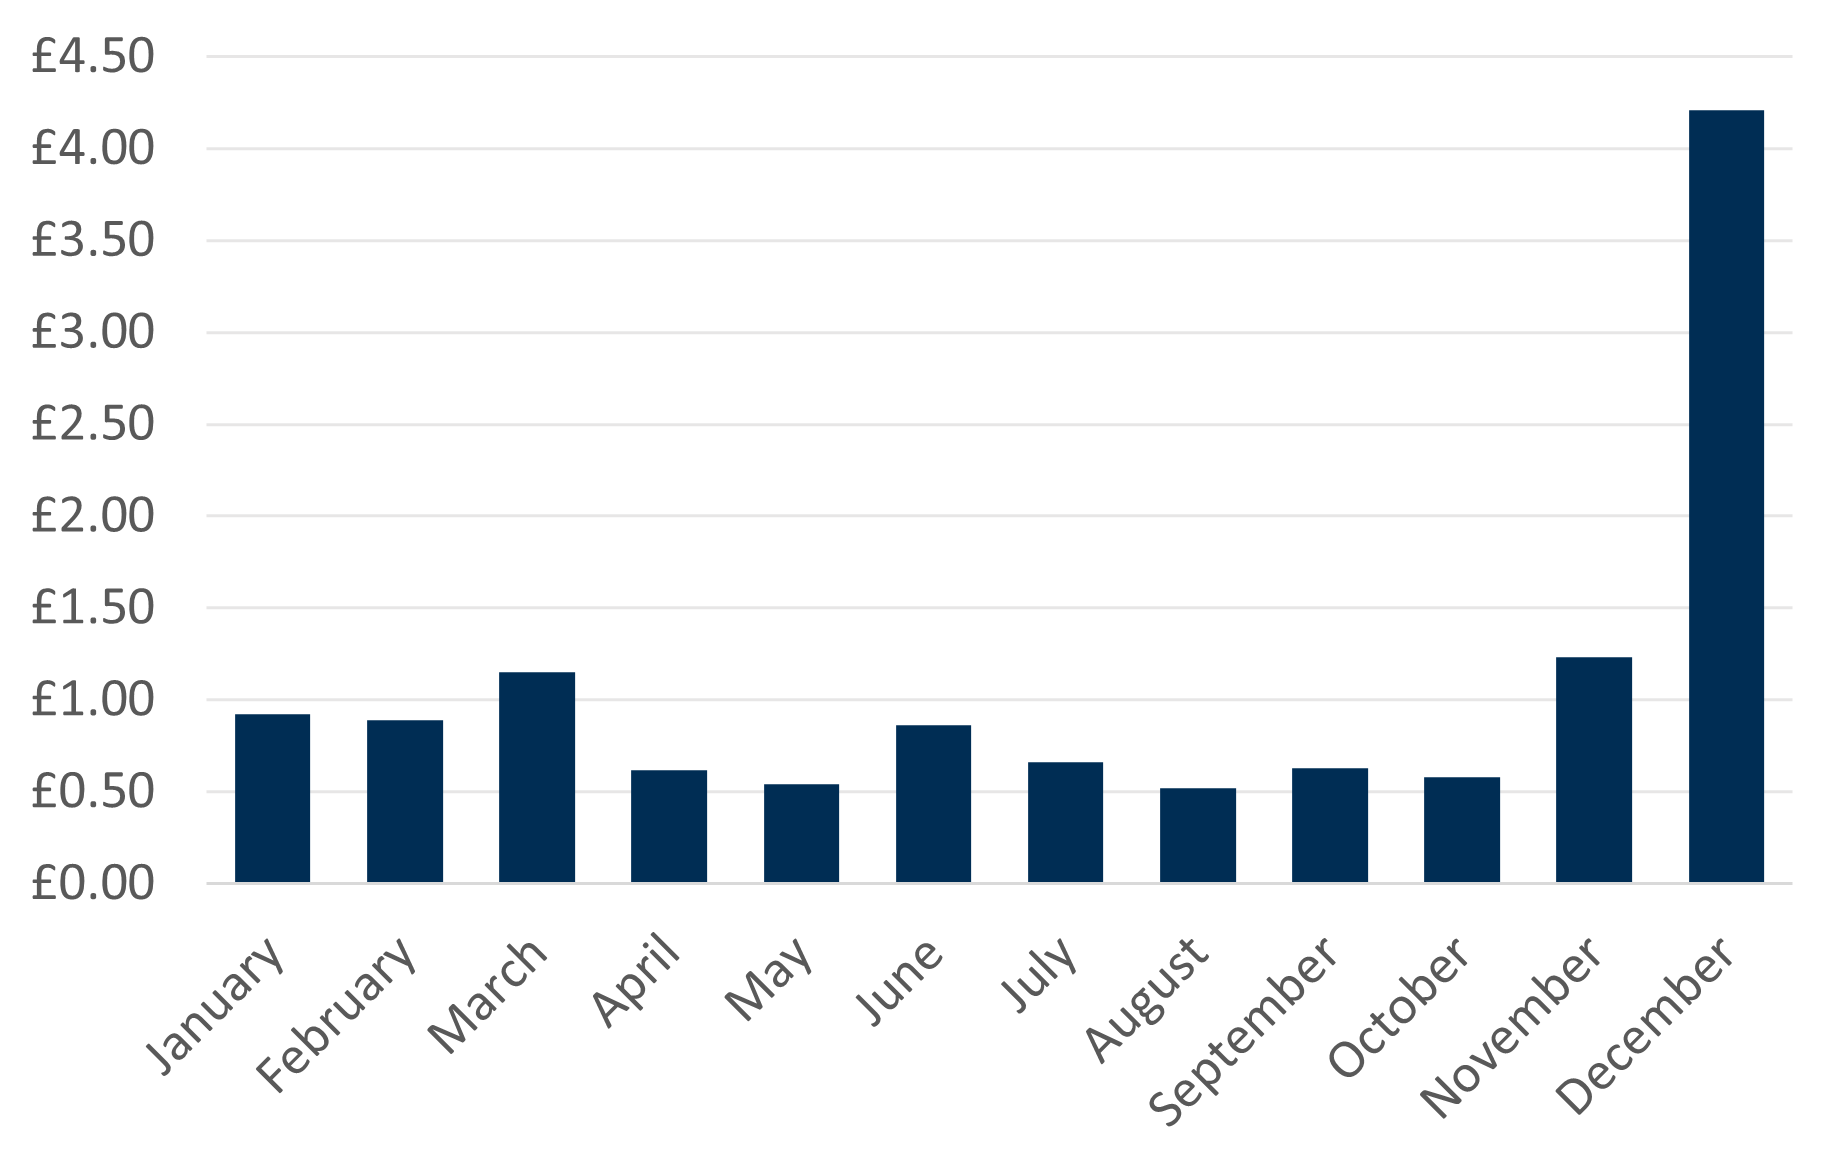
Source: Consumer Scotland analysis of the Living Costs and Food Survey (Office for National Statistics), Scotland, 2017/18 to 2022/23
As expected, the research highlighted that households generally spend a small amount of money on postal services so it’s difficult to ascertain where there may be post affordability issues. Postal services also made up a small proportion of total communications expenditure (1.86% in 2022/23).
Across the 6 years (2017/18 to 2022/23), weekly post expenditure increased until peaking in 2020/21 at £1.51, then decreased to 90p in 2021/22, and dropped further to 56p in 2022/23.
Households in higher equivalised (which accounts for household size and composition) income quintiles generally spent more in a week on postal services than those in lower quintiles, and this was statistically significant.
Chart 3: Post expenditure is higher for those in higher income quintiles
Weekly postal services expenditure by income quintile
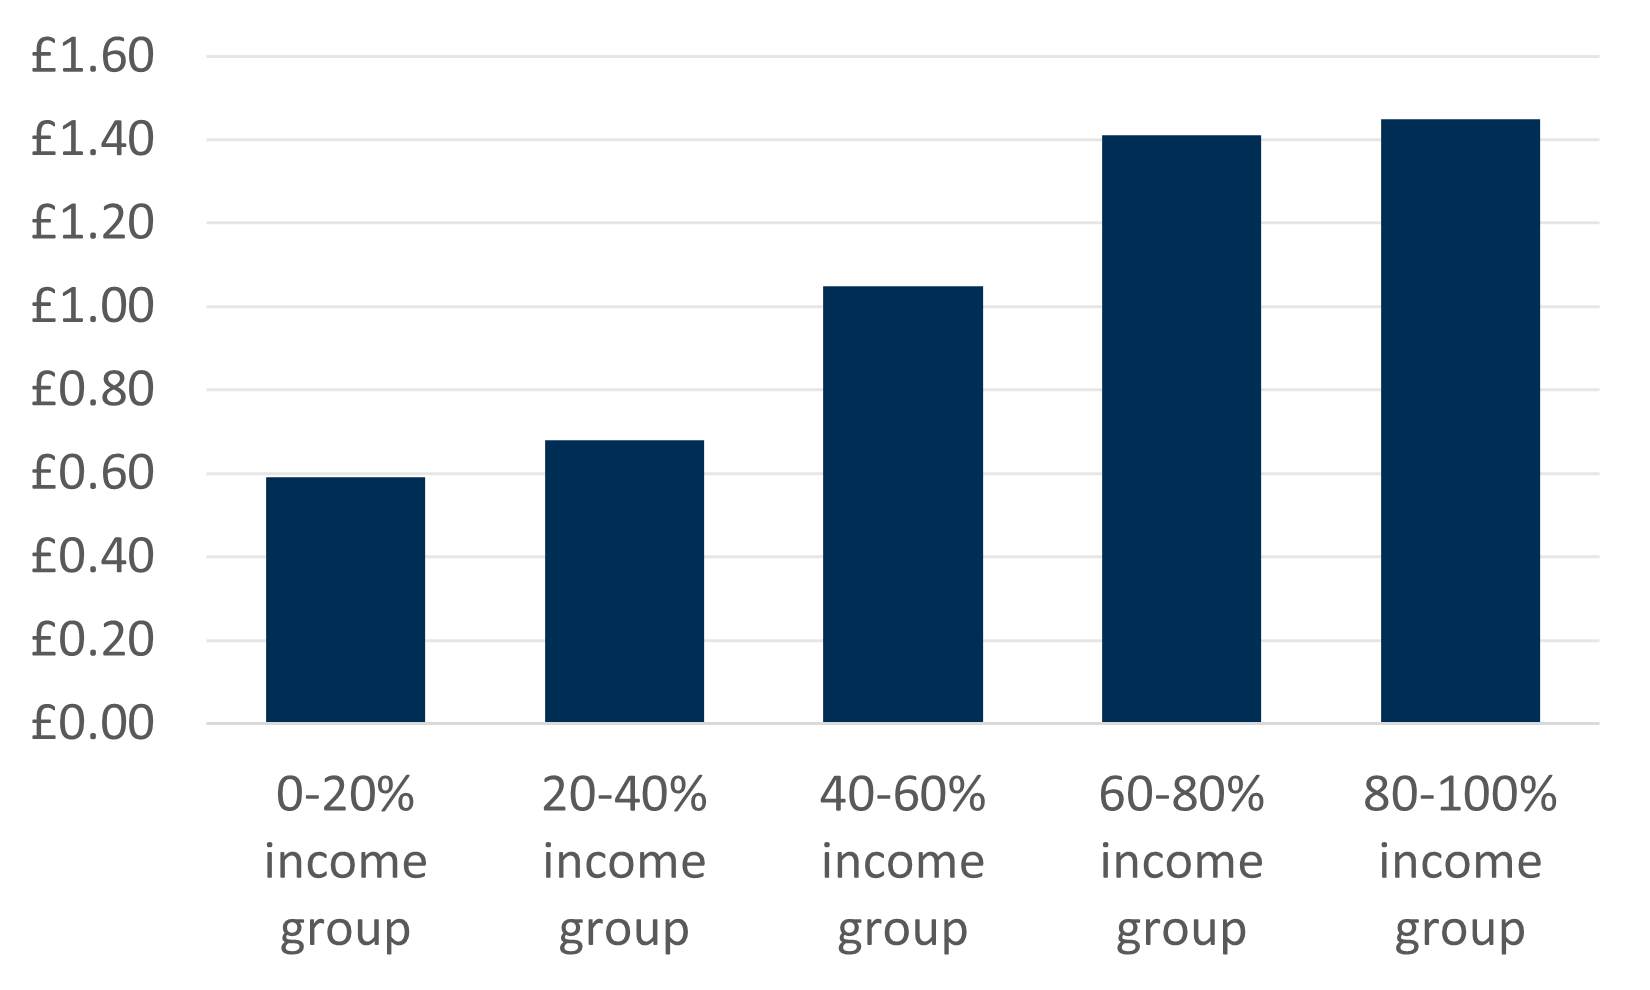
Source: Consumer Scotland analysis of the Living Costs and Food Survey (Office for National Statistics), Scotland, 2017/18 to 2022/23
In terms of understanding post expenditure as a proportion of equivalised income, households in the lowest income quintile spent a similar amount of their income on postal services (0.18%) compared to those in higher income quintiles (0.13-0.19%).
Of households in the lowest equivalised income quintile, 75% spent less than 3% of their income on postal services and 25% spent more than 3% of their income on postal services. However, as outlined below, an over-reliance on % of total income may provide an incomplete picture of postal affordability.
3. Postal expenditure as a proportion of discretionary income
When looking at affordability, it is important to consider that low-income households are often balancing competing essential expenses such as rent, water, energy and food (among other expenses). Therefore, postal services are likely to rank lower in priority when compared to expenditure for food and shelter. In this context, taking affordability as a proportion of overall income can provide a misleading picture of affordability.
For those on low income, when they do need to buy stamps, it can represent a relatively large proportion of discretionary income. The Consumer Council of Northern Ireland have calculated that a First Class stamp is 3% of a low income household’s weekly discretionary income (£51.45 which is income minus spending on basics)[4]. This is a large proportion for one single stamp among competing needs. The finding becomes more stark when it is noted that a book of eight First Class stamps would represent 24% of weekly discretionary spending[5]. It is important to interpret these findings within the context that many people spend £0 on stamps on a weekly basis but it demonstrates that stamps can be difficult to afford and budget for those on low incomes in weeks where they are needed.
Additionally, Citizens Advice have reported a significant increase in people in negative budgets seeking advice (specifically debt advice). For postal affordability, it is critical to note that there is a subsection of consumers who do not have enough money to cover the essentials. Citizens Advice report that in June 2019, the average client had £20 left after paying essentials and in 2024, they have -£20 left[6]. For consumers in negative budget, they are unlikely to be able to afford postal services or may cut back on essentials if they needed to use the postal service.
4. Consumer Scotland survey data on postal affordability
While spending on postal services is low compared to spending on other essentials such as housing or energy, our research shows that many people find postal services expensive. In 2023, Consumer Scotland commissioned a survey on the affordability of postal services.[7] At the time of fieldwork, First Class stamps were 95p and Second Class were 68p (2022 prices). Prices are now £1.70 (79% increase) and 87p (28% increase) respectively.
Based on 2022 prices, the research found that:
- 68% of consumers saw First Class stamps as expensive or far too expensive (with 27% saying far too expensive). Only 25% of consumers said they were a fair price.
- 53% of consumers reported that Second Class stamps were too expensive or far too expensive (with 35% saying they were too expensive). 40% of consumers said they were a fair price and 2% said they were cheap
5. Ofcom's Residential Postal Tracker
Ofcom’s 2023 Residential Postal Tracker found that 20% of respondents reported that they had to reduce the number of letters and cards they sent in the last three months to afford essentials[8]. This was higher among certain groups of respondents:
- 26% of those from ethnic minority backgrounds compared to 19% of white participants
- 25% of those earning under £11,500 per year compared with those earning £11,500 to £49,999 (21%), and those earning £50,000 and over (18%)
- 30% of those who are housebound compared with 19% of those who aren’t
- 27% of those who are disabled compared with 16% of those who aren’t
- Those who have internet at home but don’t use it (34%) compared to those who have internet at home and do use it (19%), and those who don’t have access to the internet (17%)
Additionally, 14% of respondents said that they had to cut back on essentials to afford to send the same number of letters and cards in the past three months. This was particularly higher for:
- Those who receive state benefits (18%) compared with those that don’t (13%)
- Those from ethnic minority groups (20%) compared with white participants (13%)
- Those who are housebound (19%) compared with those who aren’t (13%)
- Those who are disabled (17%) compared with those who aren’t (12%)
- Those who have internet at home but don’t use it (37%) compared to those who have internet at home and do use it (13%), those who don’t have internet at home but use it elsewhere (20%) and those who don’t have access to the internet (12%)
6. Value for money and affordability
As well as affordability, it is important to consider whether First and Second Class stamps represent good value for money for consumers. Given the low percentage of income spent on postal services, stamp prices may appear to be affordable to many consumers. However, the rapidly rising cost of both a single stamp, and books of stamps, may reflect poor value for money for consumers. This is likely evidenced by Consumer Scotland’s findings (above) that the majority of consumers find stamps too expensive[9].
Value for Money can be seen as a two-part equation: what you pay and the service you receive for it. Within this equation, postal services reflect increasingly poor value of money: prices are increasing quickly (see chart 1) but Quality of Service (especially for First Class) is well below the regulatory requirements and not improving. As the Quality of Service data[10] shows:
Table 1
Table 1 shows the difference between Royal Mail's targets and actual Quality of Standard performance
| Class | Actual | Target |
| First Class | 74.5% | 93% |
| Second Class | 92.4% | 98.5% |
Additionally, the price differential between First and Second Class stamps has widened considerably.
Chart 4: The price differential between First and Second Class stamps has widened considerably over time
Differential between First Class and Second Class stamped standard letter prices, 2012-13 to 2023-24
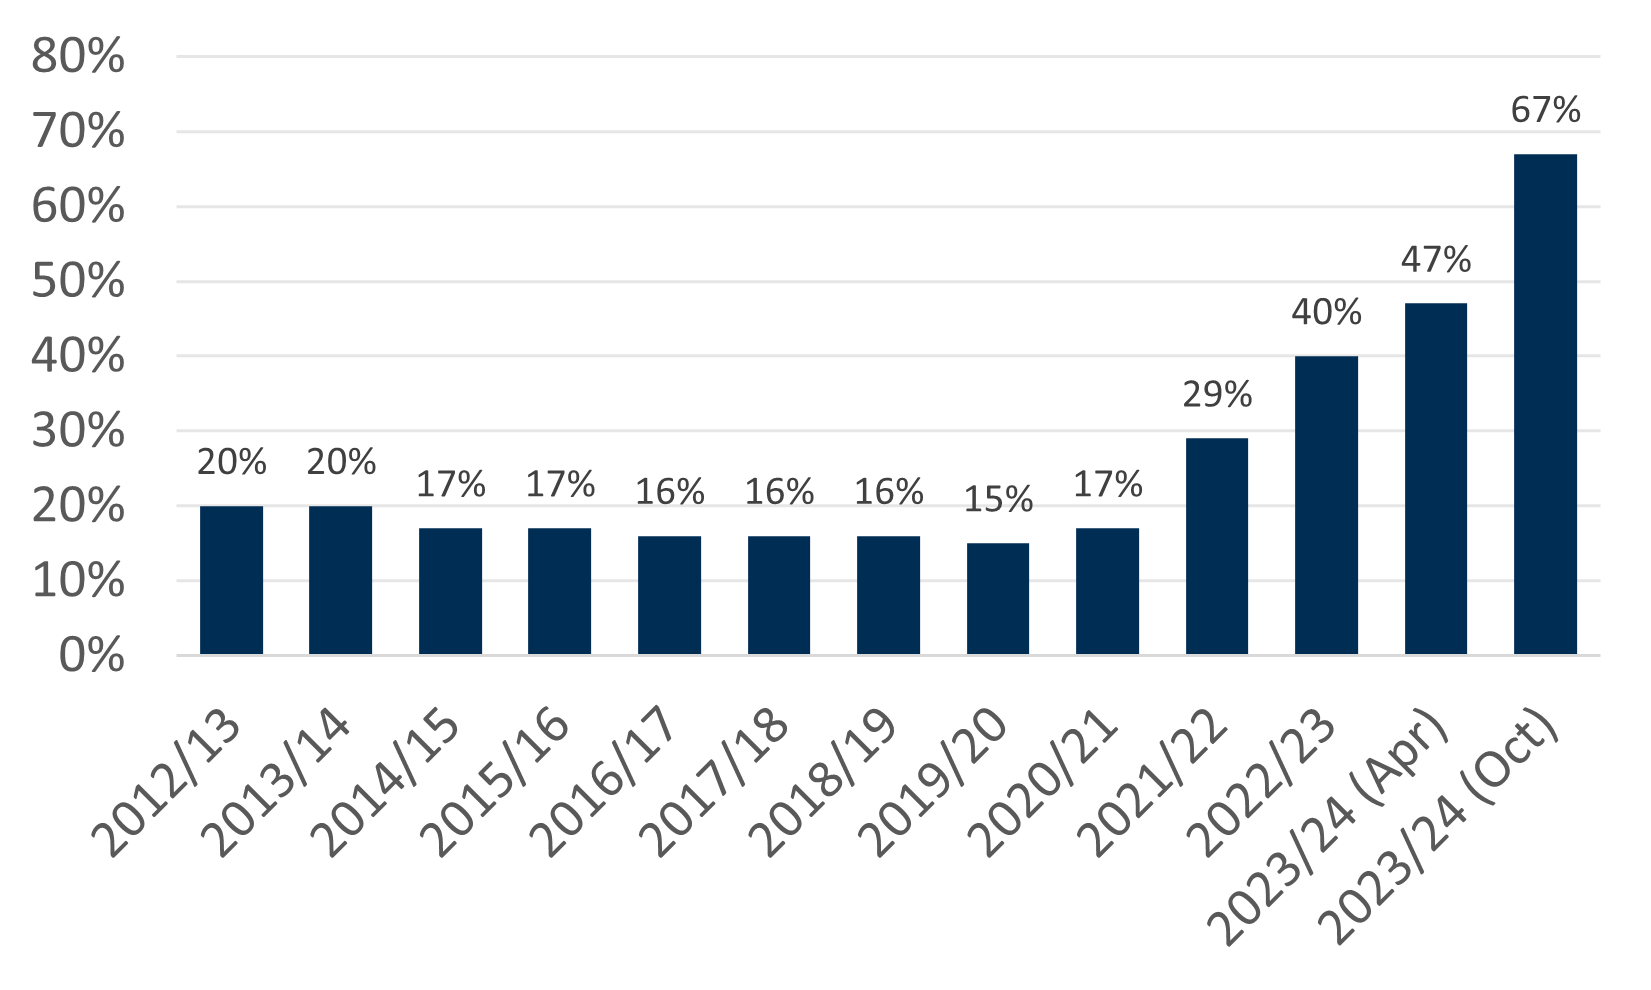
Source: Ofcom analysis of Royal Mail Price Guides
7. Conclusion
Value for Money has clearly deteriorated significantly as costs have increased by 162% (First Class) and 55% (Second Class) since 2017, while there has not been a material improvement in regulatory requirements on quality of service. In real terms these are equivalent to increases of 98% and 18% respectively.
Assessing affordability for postal services is more challenging due to small expenditure on post, seasonality and greater consumer discretion to adapt or vary expenditure depending on ability to pay for postal services. This combination of factors is different to an essential service such as energy, water or food which is less elastic to demand with significantly greater risks of forgoing expenditure.
Nonetheless, some consumers say that their use of post is essential and more than one in ten report that they have cut back on other essentials to meet their post needs. Therefore, the evidence suggests that post does create affordability challenges for some consumers. For those on the lowest incomes, the cost of stamps is a relatively high proportion of discretionary income. The relative high cost of stamps may impact on some lower-income consumers’ ability to pay for postal services.
8. Endnotes
[1] The Price of a Stamp UK stamp price inflation since 1971
[2] Office for National Statistics Living Costs and Food Survey
[3] Ofcom (2023) Residential Postal Affordability Research
[4] CCNI (2024) Q3 2024 Northern Ireland Household Expenditure Tracker
[5] Noting that Northern Ireland expenditure on basics is slightly lower than the rest of the UK.
[6] Citizens Advice (2024) Negative budgets data
[7] Consumer Scotland (2022) The affordability of the Universal Postal Service
[8] Ofcom (2023) Residential Postal Tracker - Jan-Dec 2023 - Weighted Tables
[9] Consumer Scotland (2022) The affordability of the Universal Postal Service
[10] International Distribution Systems (2024) Quarterly Quality of Service & Complaints Report