1. Acknowledgements
The results presented in this report are based on UKMOD version B2025.07. UKMOD is maintained, developed and managed by the Centre for Microsimulation and Policy Analysis at the Institute for Social and Economic Research (ISER), University of Essex. The results and their interpretation are the authors’ sole responsibility.
The authors wish to express their thanks to colleagues at Scottish Government and the Centre for Microsimulation and Policy Analysis, who provided invaluable advice on and support of the underlying modelling that informed this work.
The authors are grateful to staff at Scottish Water and the Scottish Government for helpful discussions during the development of this work.
The views expressed in this report are those of Consumer Scotland alone.
2. Executive Summary
Domestic charges for water and sewerage are expected to increase significantly in real terms in the coming years.
In its Draft Business Plan – which covers the six year Strategic Review of Charges period from 2027-2028 to 2032-2033 – Scottish Water sets out the need for increased investment to address challenges including climate change, demographic shifts, evolving regulatory requirements and replacement of ageing assets.
The required investment will largely be met through increased customer charges. Scottish Water’s Draft Business Plan proposes annual increases in customer charges of CPI+4%, amounting to a cumulative real-terms increase of 26.5% over the six years.
Whilst the actual outlook for bills will not be finalised for several months, these proposed increases follow a cumulative real terms rise in water bills of almost 8% during the past five years – consistent with the Determination of Charges for 2021-2027 – and the prospect of a further real terms increase in the final year of that period.
In this context, it is essential to understand the impact of past and future increases on the affordability of bills. This report examines recent trends in key measures of water poverty and severe water poverty in Scotland, and projects future trends in water poverty under various scenarios for water charging policy.
Trends and outlook for water poverty
The proportion of households in Scotland in water poverty – spending more than 3% of disposable income in water and sewerage charges – fell below 10% in 2023-2024 for the first time. This reflected real terms reductions in water charges during the cost of living period.
The decline in water poverty is anticipated to be relatively short-lived. Water charges increased above inflation in 2024-2025 and 2025-2026 which will take water poverty above the 10% threshold.
By 2029-2030 – halfway through the next SRC period – water poverty is projected to reach 14% if charges increase in real terms by 4% per annum (and in the final year of the current charge period). This is a higher rate of water poverty than has been seen for almost two decades.
By the end of the Strategic Review period, water poverty could reach between 15-16% under a scenario where water charges increase at 4%. The specific rate could be higher or lower than this if charges increase more or less quickly in real terms.
The determinants of water poverty
Water poverty is primarily associated with low income. Virtually all households which are in water poverty are also in low income poverty (i.e. have disposable, equivalised income of below 60% of the median).
Other than income, the characteristics of households in water poverty are relatively diverse. This reflects that low income is experienced by a wide range of households – including those in and out of work, in a variety of housing tenures, and a range of different family types.
Policy options to mitigate the impact of bill increases on affordability
The Water Charges Reduction Scheme (WCRS) currently provides bill reductions of up to 35% for eligible households (those in receipt of Council Tax Reduction). Increasing the WCRS discount to 50% would offset the proposed 4% per annum real increase in bills over the Strategic Review period for the households that receive it.
However, whilst an increase in the WCRS to 50% would partially mitigate the projected rises in water poverty, it would have a relatively modest impact in this regard.
There are several reasons why increasing the WCRS makes a modest impact on water poverty. A relatively low proportion – around one quarter – of households in water poverty currently receive it, reflecting under-claiming and weak targeting (although it is important to add that some households are not in water poverty precisely because they do receive the WCRS).
The modest impacts of increasing the WCRS also results from the assumption in our modelling that the costs of increasing the WCRS to 50% would be ‘socialised’ across other bill-payers. Increasing the WCRS to 50% would add 2 percentage points to bills generally over the six-year charge period (i.e. would see bills increase by 28% in real terms rather than 26%).
The vast majority of the ‘beneficiaries’ of an increase in the WCRS would be households in the lower third of the income distribution. Increasing the WCRS would provide support to a large number of households in income poverty, funded through a relatively progressive increase in charges across other households.
Rather than funding the WCRS through increases in charges more broadly, an increase in WCRS to 50% could be funded through a halving of the Single Person Discount. This policy is slightly more effective at reducing water poverty. But it also results in more significant bill rises for single person households who don’t receive WCRS, including some of those with low incomes. Overall, it is a less progressive reform than funding an increase to WCRS across all billpayers.
Recommendations
Whilst increases in the WCRS cannot fully mitigate the forthcoming rise in water poverty, there is nonetheless a strong case for it to increase to 50%. The households which would benefit from an increase in the WCRS are nearly all households in the lower part of the income distribution, and so are amongst those most likely to be struggling.
Recommendation 1: Consumer Scotland recommends to the Scottish Government that the WCRS is increased to 50% in SR27. The policy would offset the impact of real terms bill increases for over 400,000 households, the vast majority of whom are in the lower part of the income distribution. If the policy could not be funded ‘externally’ (e.g. through an increase in Scottish Water borrowing), then it could be funded by a one-off increase of two percentage points on bills generally.
This policy leaves many households at risk of water poverty who do not qualify for or receive WCRS. There is a case for developing a water hardship fund which could provide support for families with incomes below the thresholds for water poverty and who do not qualify for WCRS.
Recommendation 2: Consumer Scotland recommends the establishment of a water hardship fund. The fund could provide support for families with incomes below the thresholds for water poverty but who do not qualify for WCRS.
In the longer term, policy should move toward a fairer and more targeted charging system. However, given the constraints of the 2027-2033 period, fundamental reform is unlikely to be feasible. Improvements to affordability policy must therefore be pragmatic and workable within the existing system. An enhanced WCRS, supplemented by a ‘by-application’ safety net, represents a practical and impactful approach worthy of serious consideration.
Recommendation 3: During SR27, the Scottish Government and Scottish Water should undertake further work to identify suitable mechanisms to improve the automatic targeting of affordability support in the following charging period.
3. Introduction
Water bills for Scotland’s 2.6 million domestic consumers are on the rise. Between 2020-2021 and 2025-2026, charges increased by 7.4% in real terms (i.e. above the underlying rate of CPI inflation). The typical annual bill for a property in band C is now £534 per year, up from £398 in 2020-2021.
It is likely that water bills will increase more rapidly in coming years.
In Scotland, the framework for water charges is set by a series of strategic reviews of charges (SRC), each covering a period of six years. The current review period, known as SR21, spans from 2021-2022 to 2026-2027. During SR21, Scottish Water is permitted to increase water charges by up to a maximum of two percentage points above CPI inflation (CPI+2%) on average for each of the six years of the plan period. In other words, charges are permitted to increase by up to 12.6 percentage points above the rate of inflation during SR27.
Planning is currently underway for the subsequent strategic review period (SR27) which will cover the period from 2027-2028 to 2032-2033. Scottish Water has published a Draft Business Plan setting out its delivery priorities for the SR27 period. The Draft Business Plan sets out a need for Scottish Water to increase its investment to address a number of challenges.[1] These include the impact of the climate crisis, a shifting and changing population, new regulatory requirements and the increasing cost of replacing ageing assets.
The proposed £13.4 billion in expenditure over the SR27 will largely be funded through customer charges. Scottish Water’s Draft Business Plan proposes annual increases of CPI+4%, amounting to a cumulative real-terms increase of 26.5% over the six years.
The final decision on charges for SR27 will depend on the outcome of the consultation and the views of regulator WICS, and will be set out in a Final Determination. The Final Determination could allow charges to increase by more or less than the CPI+4% currently proposed by Scottish Water. However, regardless of the exact figure, bills are on course to increase significantly in the coming years.
In this context, understanding the impact of proposed bill increases on affordability is essential.
This report examines recent trends in water charge affordability in Scotland and projects future affordability under various charge scenarios. It does this by following the same methodology as in Consumer Scotland’s October 2024 report.[2]
Affordability is assessed by examining the proportion of Scottish households who are likely to experience ‘water poverty’, a well-established and recognised affordability measure. The report explores how water poverty rates may change under different charge scenarios, as well as the impact various discounts and reductions that are available to eligible customers.
This report is one of many pieces of research that is being undertaken by Consumer Scotland, Scottish Water, and others that will collectively inform decisions on SR27 charging parameters. While much of the broader research asks consumers directly about their views on the reasonableness of charges or the perceived impact on affordability, this report uses forecasting techniques to quantify the likely impact of different charge scenarios on the rate of water poverty.
4. Background and context
Water charging policy
Domestic water bills in Scotland are primarily determined by council tax band, and very few domestic properties are metered. In 2025-2026, the combined annual bill for water and sewerage charges ranges from: £400 for a band A property, £600 for band D, and up to £1,200 for a band H property.[3] [4]
Whilst water and sewerage charges are primarily determined by council tax band, there are several reductions, discounts and exemptions available:
Single Person Discount (SPD): Households with only one adult (aged 18 or over), or where other adults are ‘disregarded’ for council tax purposes (such as students, apprentices or have severe mental impairments), receive a 25% discount on their council tax bill.[5] [6]
- Water Charges Reduction Scheme (WCRS): Households that receive Council Tax Reduction (CTR) also receive a discount on their water bill through the WCRS. The WCRS reduction amount is calculated as 35% of their CTR rate. For example, a household receiving a 100% CTR would get the full 35% reduction on their water bill; and a household receiving a 50% CTR would get a 17.5% reduction. The total water bill reduction – combining both the SPD and WCRS – is capped at 35%. For example, a single-person household receiving full CTR would get a 25% discount through SPD and an additional ten percentage points reduction via the WCRS, bringing the total reduction to the 35% maximum
- Disability relief: Households with disabled occupants can apply for a reduction if their home is adapted for disability. Eligible households are charged based on the council tax band below their actual band
- Exemptions: Some households are fully exempt from council tax, and therefore water charges. This includes households where all occupiers are full-time students, those hospitalised long-term, or those with severe mental impairments
The rationale for basing charges on council tax band, with discounts for single person households, is implicitly linked to both consumption of water services and to income. On average, higher banded properties are likely to: consume higher volumes of water and wastewater services; and have higher income. Thus, basing charges on council tax band is justified by two senses of fairness – one that links charges to consumption and one that links charges to ability to pay.
However, there are limitations to this charging method. Council tax band is loosely correlated with income and water consumption, but there is a huge degree of variation within and between council tax bands.
Another reason for linking water charges to council tax band is administrative; local authorities collect water charges on Scottish Water’s behalf, alongside council tax. This approach has been in place since Scottish Water’s establishment in 2002. The only significant structural change was the introduction of the WCRS in 2006, which initially provided bill reductions of up to 25% for CTR recipients.
In 2021, the maximum WCRS discount was increased to 35%. The rationale for this was to protect low-income households from the above-inflation bill increases that were permitted during the SR21 period. This increase helped offset the impact of price rises for recipient households. Specifically, the increase in WCRS to 35% means that recipient households would not see any real terms rise in their bills over the six-year period.
The value of reductions, exemptions and discounts
Table 2.1 summarises the value of these various discounts, reductions and exemptions. In 2023-2024, the total value of water bill reductions, exemptions, and relief, was £205 million. Of this:
- Discounts (mostly for SPD) accounted for £124 million
- WCRS provided £27 million of support to 491,000 households
- Disability relief was received by around 15,000 dwellings, with a total value of £1 million
- Exemptions (for properties that are occupied but where nobody is liable for the charge) was £70 million
The value of the WCRS may appear relatively small because, for households receiving both SPD and WCRS, most of the reduction is counted under SPD. For example, a household who is eligible for a 25% single person status discount and full WCRS at 35%, the majority of that household’s bill reduction (25/35) is accounted for as status discount.
Table 2.1: The total value of water charge reductions and reliefs are around £200 million
Value of charges, reductions, exemptions and discounts (2024-2025)
|
Expenditure |
£ million |
As percentage of gross charges |
Number of dwellings |
|---|---|---|---|
|
Gross charges |
£1,378 |
100% |
2,608,000 |
|
Discounts (mostly for SPD) |
£124 |
9% |
1,024,000 |
|
WCRS |
£29 |
2% |
491,000 |
|
Disability relief |
£1 |
<1% |
15,000 |
|
Exemptions |
£70 |
5% |
106,000 |
|
Net charges |
£1,154 |
84% |
NA |
Source: Supplied by Scottish Water to Consumer Scotland. Note: figures are estimates. At September 2024, an estimated 279,000 homes that received a 25% discount also received WCRS support.
Defining water poverty
This report assesses water affordability using a widely recognised measure of ‘water poverty’. Households spending more than 3% of disposable income on water and sewerage services are considered to be in ‘water poverty’; those spending more than 5% are in ‘severe water poverty’.
These definitions have been used extensively to assess the affordability of water and sewerage charges in England and Wales,[7] Scotland,[8] and other countries outside the UK.[9]
Limitations of these measures include that they ignore other aspects of households’ financial wellbeing, such as debt and assets, and income volatility and uncertainty. Nonetheless, these water poverty measures remain the most pragmatically useful, given the availability of data, and they allow for comparisons to be made across time for different types of consumers.
Estimating and forecasting water poverty
We adopt the same approach to estimating and modelling water poverty as in our previous report.
To monitor trends in water poverty, we use the Households Below Average Income (HBAI) dataset,[10] which is derived from the Family Resources Survey (FRS).[11]
The FRS is overseen by the Department of Work and Pensions. The survey is designed to be representative of households across each nation and region of the UK. Each year, around 3,000 households in Scotland are surveyed. The survey collects detailed information on household demographics, socio-economic characteristics, and income from various sources.
The latest HBAI/FRS data available to us relates to the 2023-2024 financial year. To estimate water poverty in subsequent years, we draw on the UKMOD tax-benefit model.[12] UKMOD enables us to generate uprated iterations of the FRS data, reflecting actual or forecast changes in earnings, other income sources, taxation, and social security policy since 2023-2024.[13] The analysis in this paper draws on the latest available Office for Budget Responsibility (OBR), dated March 2025.
This uprated data is combined with households’ water charges. For 2024-2025 and 2025-2026, actual water charges are used. These are calculated for each household based on council tax band and eligibility for discounts or reductions. For years beyond 2025-2026, we model a range of plausible scenarios for water charges. In line with the Draft Scottish Water Business Plan, our central scenario assumes that water charges will increase by CPI+4%.
5. Trends and outlook for water poverty
This chapter examines how the rate of water poverty has evolved during the past 25 years. It goes on to consider the outlook for water poverty during the next Strategic Review period.
Recent changes in water charges
Chart 3.1 shows the evolution of the water charge in real terms since 2002-2003, when Scottish Water was established.
Following the 2008 recession, water charges were frozen in cash terms for four years, resulting in a real-terms decline. For the next ten years (from 2012-2013 to 2021-2022), water charges remained broadly stable in real terms.
In 2022-2023, the water charge declined significantly in real terms. This was partly due to the method used to uprate charges; increases are based on the annual CPI inflation rate from the previous October. While CPI for 2022-2023 was close to 10%, the relevant October 2021 figure was just over 4% — leading to a below-inflation increase and a real-terms decline.
This below-inflation increase was offset by significantly above-inflation increases in 2024-2025 and 2025-2026, which returned the real-terms charge back to its 2010 level. The charge for the final year of the plan period, 2026-2027, will be announced in early 2026. Notably, there is scope for a further real terms increase within the parameters of the current changing period as explained in the following section.
Changes in water charges in SR21 (2021-2027)
During SR21, Scottish Water is permitted to increase water charges by up to a maximum of two percentage points above CPI inflation (CPI+2%) on average for each of the six years of the plan period.
For any given financial year, the relevant CPI figure is from the previous October. For example, the 2021-2022 charge was based on CPI from October 2020.
Table 3.1 summarises the CPI metric, annual charge increase, and cumulative change for the first five years of SR21. While the charge increased by CPI+1.8% in 2021-2022, it increased in line with inflation in 2022-2023 and significantly below inflation in 2023-2024. In 2024-2025 and 2025-2026 the charge increased well above CPI+2%.
Overall, charges have increased by 7.4% above inflation over the first five years of SR21. Given the cumulative cap of 12.6% above inflation (1.026), this suggests scope for an increase of up to CPI+5% in 2026-2027, the final year of the plan period.
Table 3.1: Increases in CPI and charges during SR21
| Year | CPI (previous October) | Increase in charge | Difference |
|---|---|---|---|
| 2021-2022 | 0.7% | 2.5% | 1.8% |
| 2022-2023 | 4.2% | 4.2% | 0.0% |
| 2023-2024 | 11.1% | 5.0% | -6.1% |
| 2024-2025 | 4.6% | 8.8% | 4.2% |
| 2025-2026 | 2.3% | 9.9% | 7.6% |
| Cumulative | 124.7% | 134% | 107.4% |
Chart 3.1: Water charges declined in real terms during the cost-of-living crisis but have since increased
Combined water and sewerage charge for a band D property in 2025-2026 prices, and the percentage of households in Scotland spending above 3% of disposable income on water charges

Source: Consumer Scotland analysis of Scottish Water charges data. Charges are deflated using the Consumer Prices Index published by ONS; for 2025-2026, CPI is forecast to grow 1.6% in line with the latest forecast from the Office for Budget Responsibility. Note that the measure of inflation that determines water charging parameters is from October of the previous year, whereas this chart deflates charges by the relevant financial year deflator.
Historic trends in water poverty
Chart 3.2 shows how the 3% and 5% water poverty rates (defined in the previous chapter) in Scotland have changed since 2000.
From a peak at 16% in 2005-2006, the water poverty rate declined through the mid-2010s. This decline reflected two things: the introduction of the Water Charges Reduction Scheme (initially at a maximum of 25% discount for households receiving Council Tax Reduction); and below-inflationary charge increases from 2009-2010 to 2012.13, shown in Chart 3.1.
The water poverty rate remained at around 11% to 12% from the early 2010s until 2021-2022. It then fell in 2022-2023 and dropped below 10% for the first time in 2023-2024. As described in our 2024 report, this decline reflects the below-inflation increase in charge, combined with the temporary cost of living payments which helped support low-income households during the cost of living crisis.
Note that the severe water poverty rate has been much more stable over time. As we discuss subsequently, this is because many of the households in severe water poverty spend substantially more than 5% of their income on water charges, meaning small changes in charges over time do not materially affect the number of households in this category.
Chart 3.2: Water poverty fell to its lowest rate in 2023-2024
Percentage of households in Scotland spending above 3% or 5% of disposable income on water charges (2000-2001 to 2023-2024)
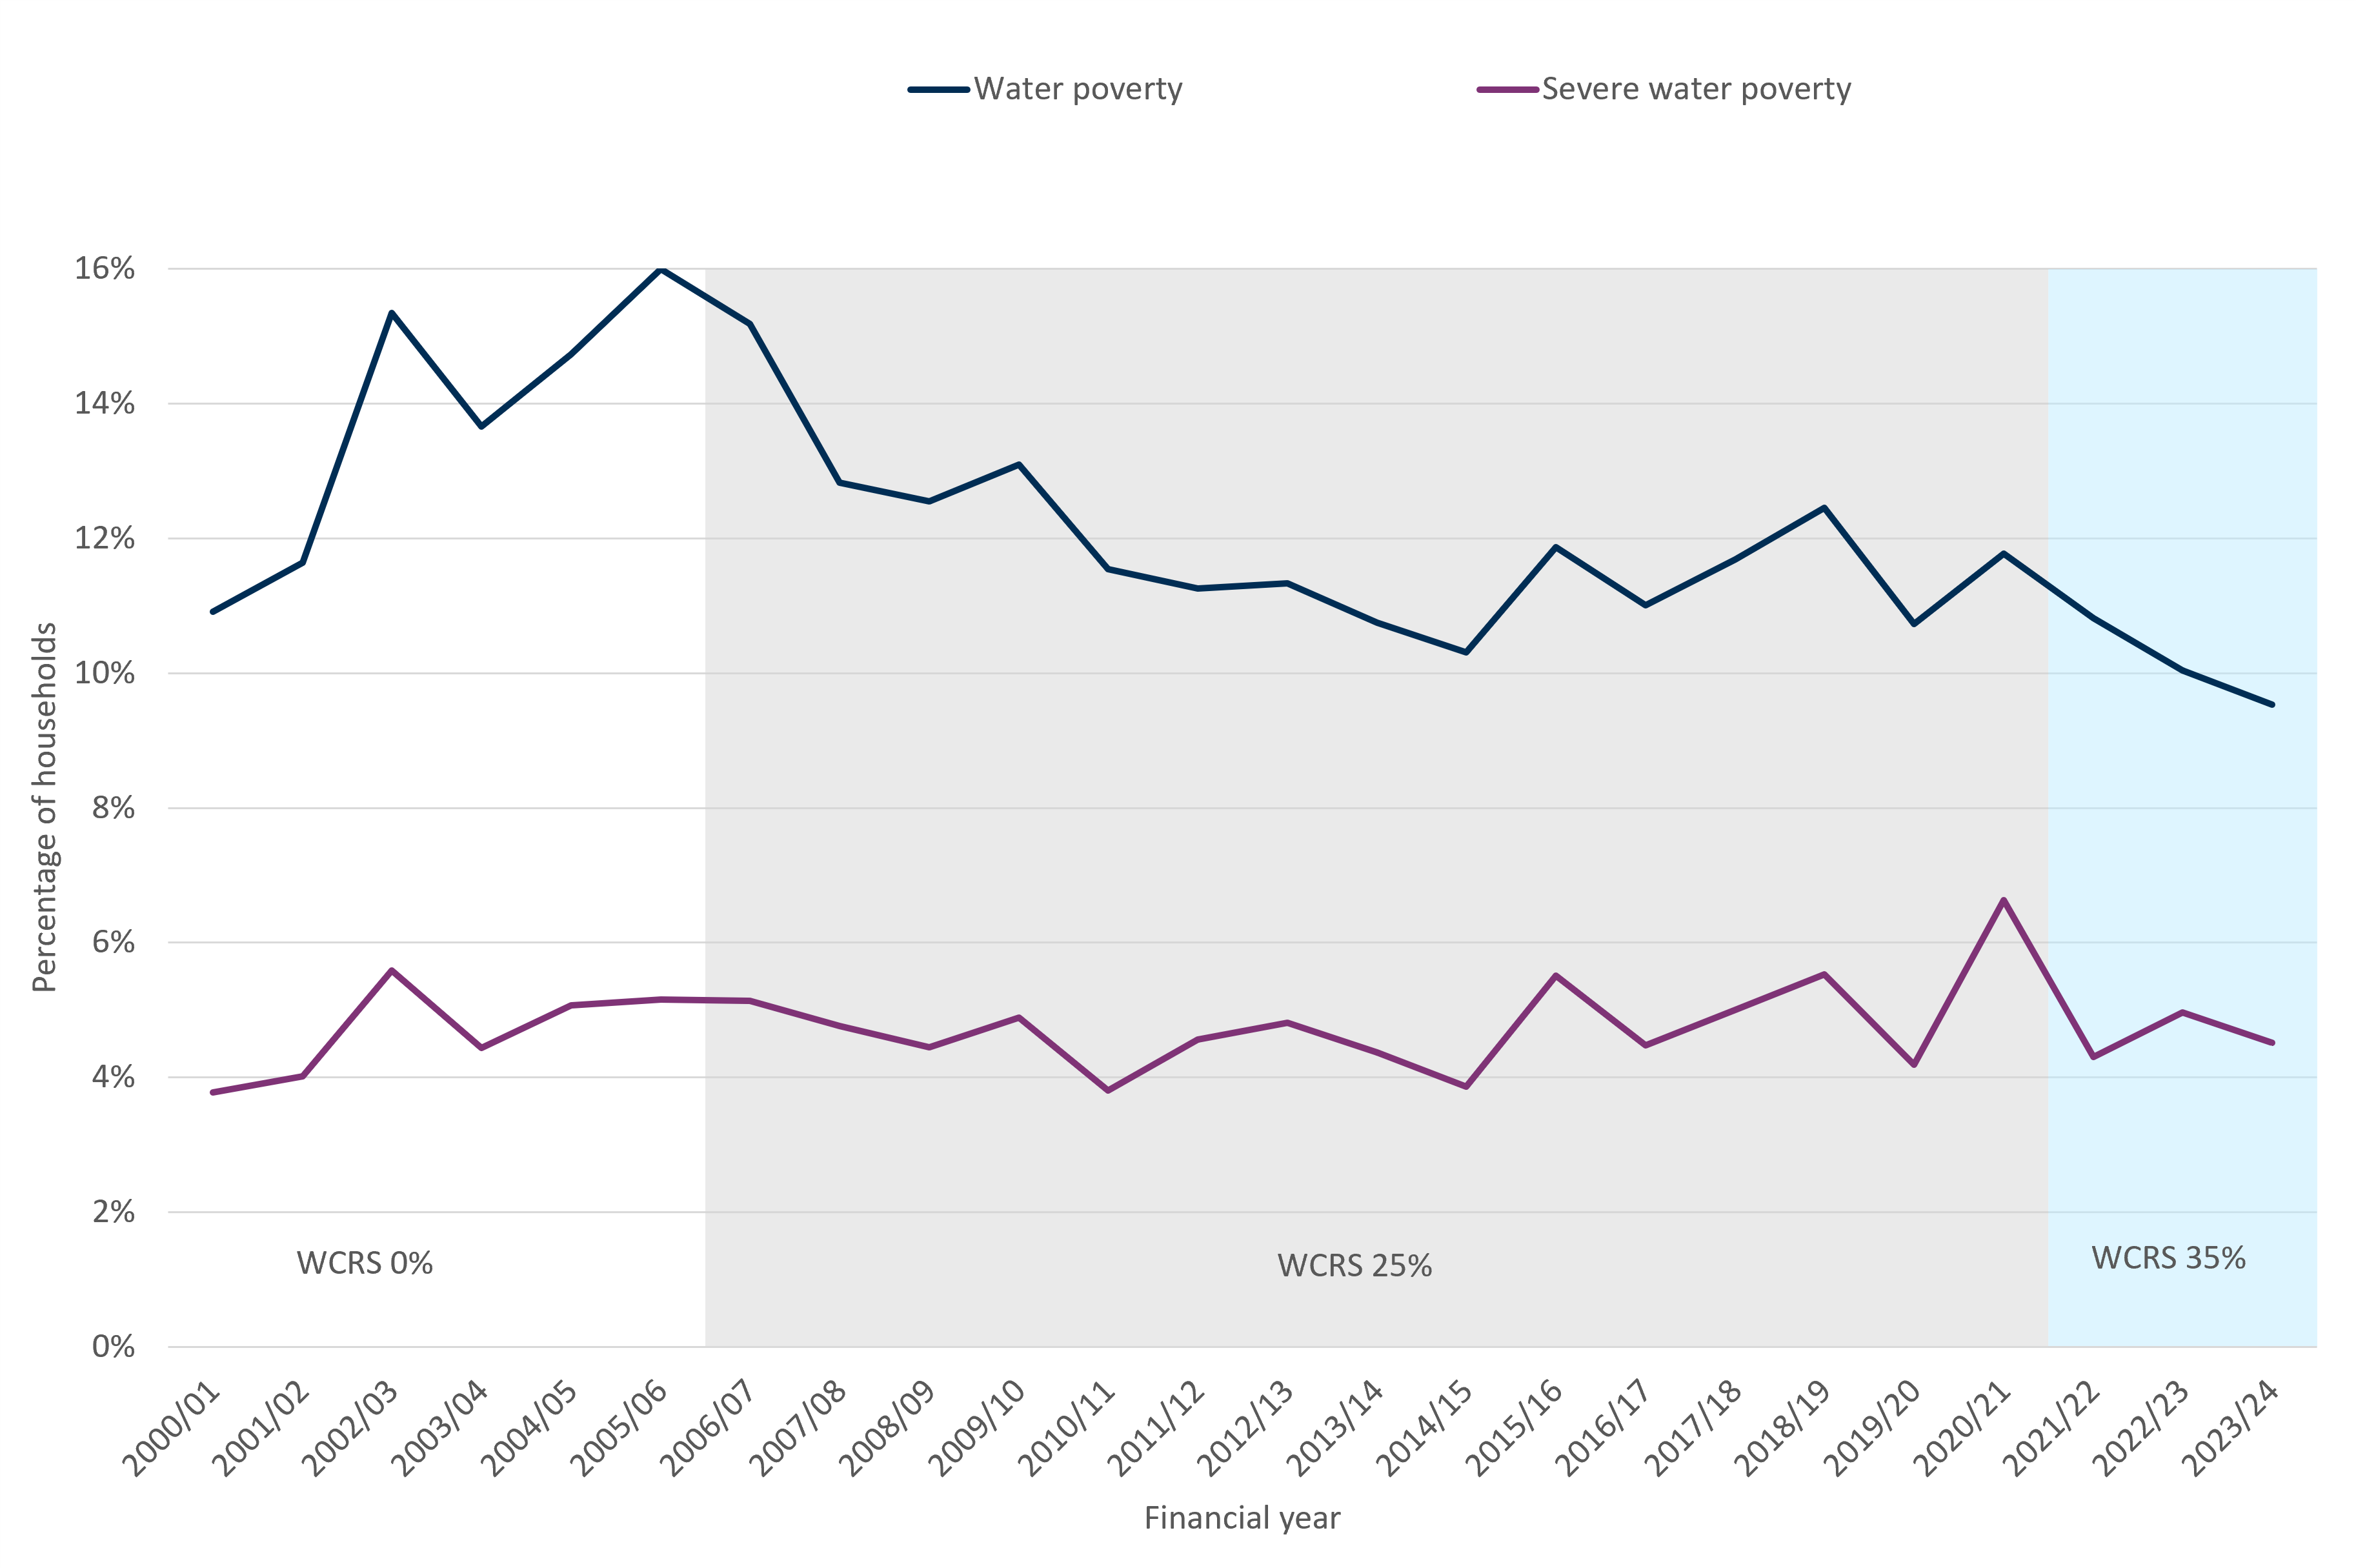
Source: Consumer Scotland analysis of Households Below Average Income dataset.
Proportion of income spent on water and sewerage charges
In the last publication, we forecasted that in 2023-2024, 9.5% of households were in water poverty and 4.5% in severe water poverty. These forecasts are now confirmed by the latest HBAI data, providing additional confidence in the forecasting approach.
While it is useful to know how many households fall above or below these 3% and 5% thresholds, examining the broader distribution of the percentage of income spent on water gives us a fuller picture of affordability. This helps to identify how many households are close to the poverty line, and therefore at risk of crossing it due to small changes in charges or income.
Chart 3.3 shows that most households spend less than 2% of their income on water and sewerage. However:
- 14% spend between 2% and 3%, meaning that they are at risk of entering water poverty
- 4% of households spend between 3% and 4%, meaning that they are in water poverty but not severely so
In other words, a reasonably large proportion of households sit just above or below the water poverty thresholds, and could move in or out of water poverty with relatively small changes.
In contrast, relatively few households are on the cusp of the severe water poverty threshold of 5%. For example, 3% of households (the majority of those in severe water poverty) spend over 8% of disposable income on water charges. This helps explain why the severe water poverty rate is less sensitive to changes in underlying parameters.
Chart 3.3: Most households spend less than 2% of their disposable income on water charges
Percentage of disposable income spent on water charges (2023-2024)
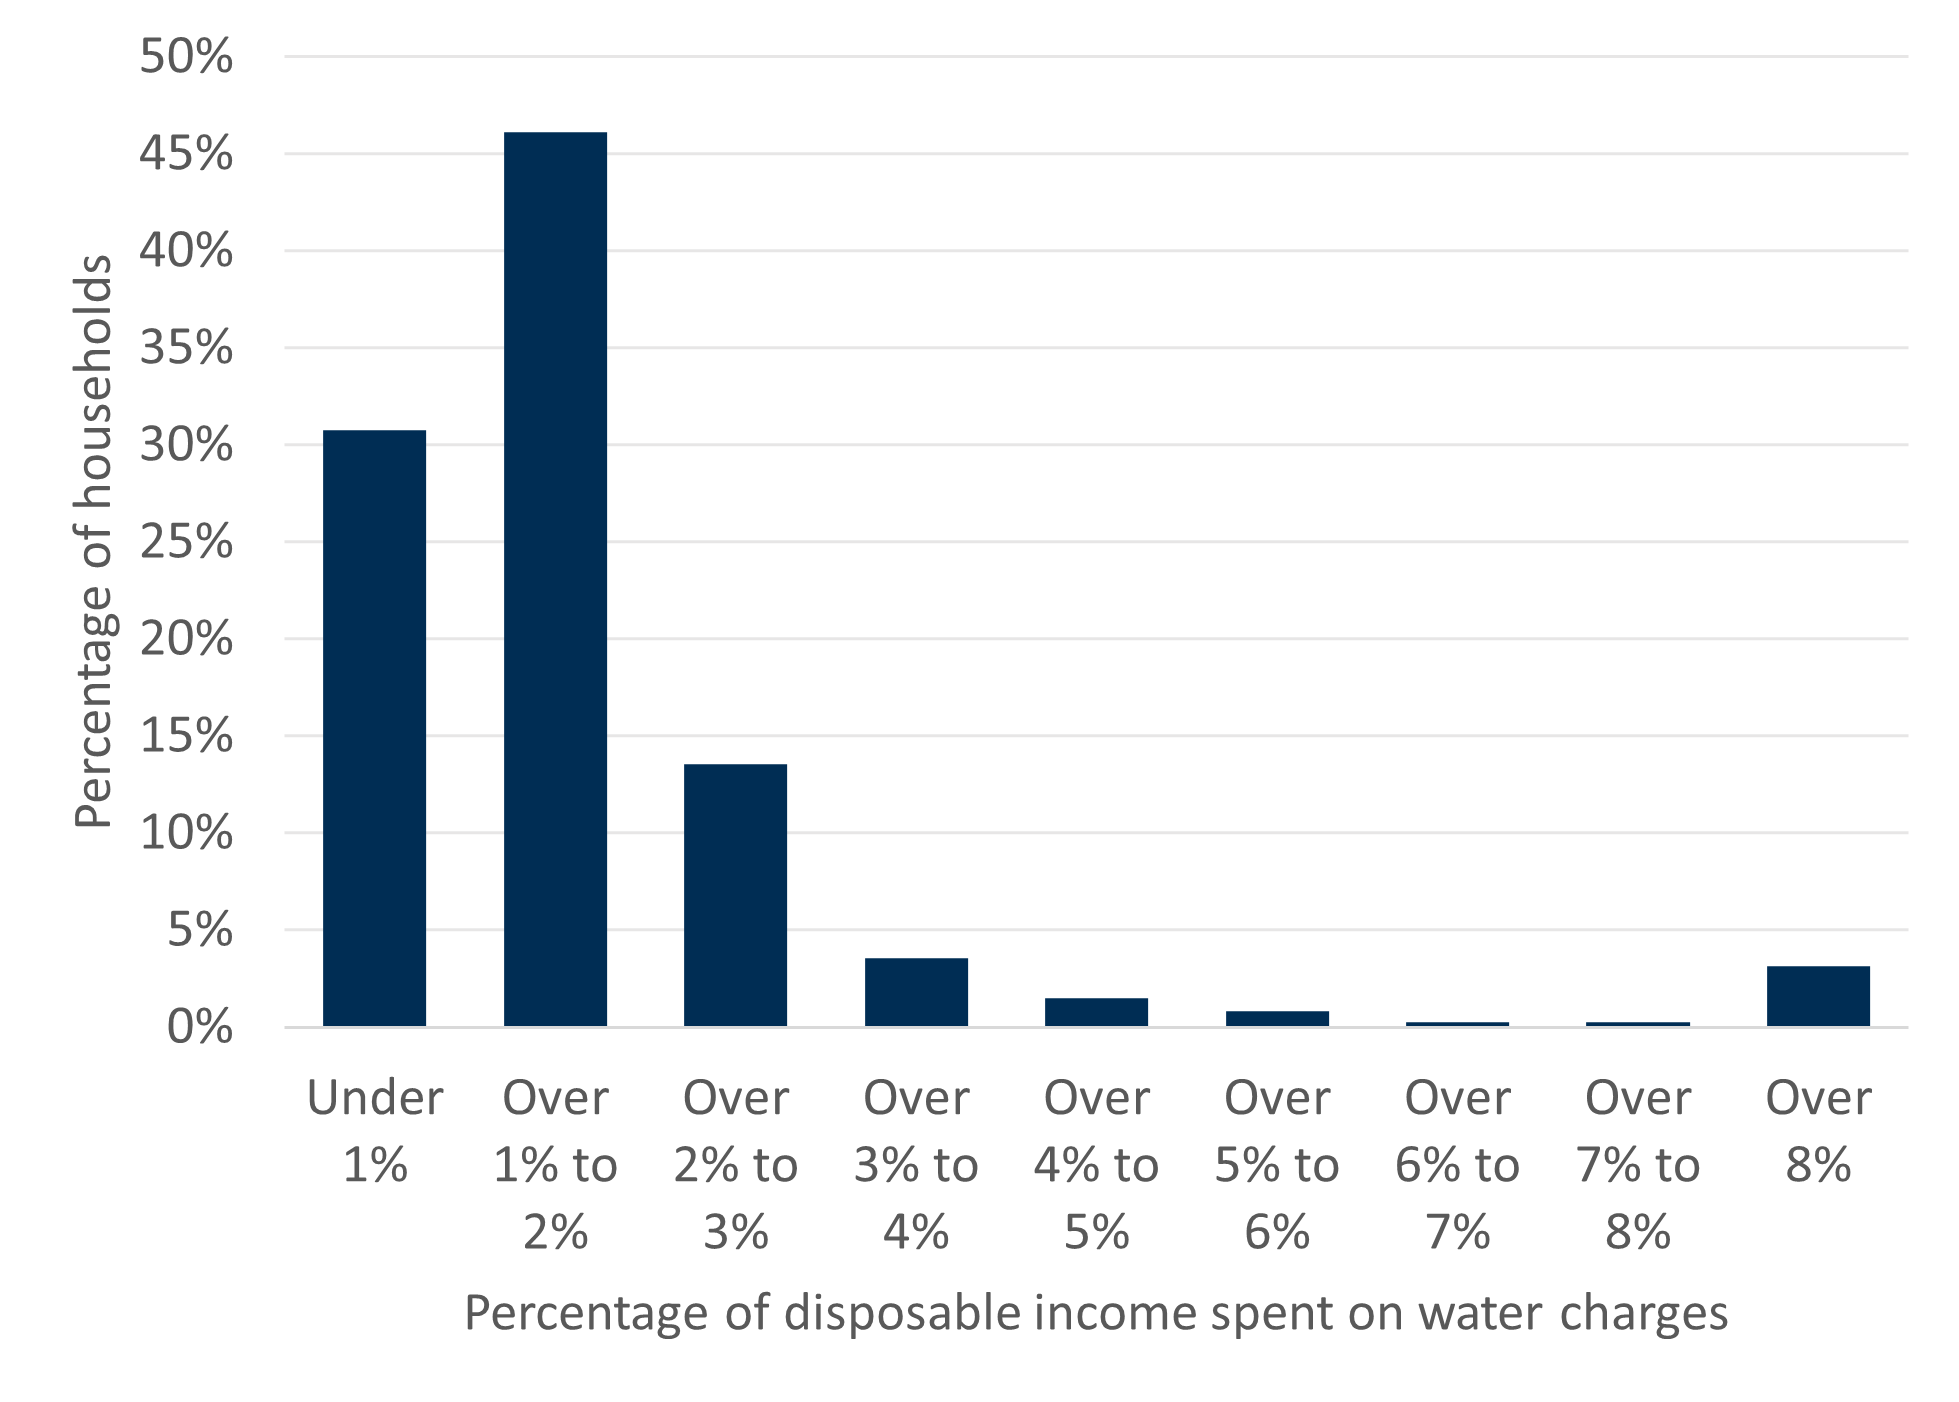
Source: Consumer Scotland analysis of Households Below Average Income dataset 2023-2024. N = 1,684. Note: households with negative income values (and therefore spend less than 0% of their income on water charges) are categorised as in water poverty, in the ‘over 8%’ category. Some estimates are based on low counts (under 30 respondents) so should be interpreted with caution.
Projections for water poverty
Comprehensive survey data on household incomes in Scotland is only available up to 2023-2024. We use UKMOD to project the distribution of household incomes in 2024-2025 and beyond; and combine these projections of household income with projections of the water charges that different households will face.
Chart 3.4 shows our projections for 3% and 5% water poverty rates in Scotland up to 2029-2030, under different scenarios for annual charge increases: CPI+2%, CPI+3%, CPI+4% and CPI+5%. All other aspects of water charge policy are assumed to remain unchanged.
In 2025-2026 (for which water charges are known), we estimate that 10.1% of households in Scotland are in water poverty, and 4.0% are in severe water poverty. This is broadly in line with recent rates (as shown in Chart 3.2).
In subsequent years, the projected rate of water poverty is proportional to the extent to which the charge increases in real terms. For example, by 2029-2030 we estimate water poverty to reach between 12% and almost 15%, depending on whether charges increase by 2% or 5% per annum in real terms, respectively.
Severe water poverty is less sensitive to increases in annual charges. Nonetheless, the general upward trajectory is evident.
Of course, whilst higher charges would increase water poverty rates, the flipside is that this would also generate additional revenue for Scottish Water – which may benefit future consumers through higher investment in this plan period.
An important caveat is that the estimates of water poverty derived from UKMOD are consistently lower, by around one percentage point, than those estimated from the HBAI data (for years for which HBAI data exists, i.e. up until 2023-2024). To this extent, our estimates of water poverty in future years may represent lower bound rather than upper bound estimates.
Chart 3.4: Water poverty rates are expected to approach historic highs
Percentage of households in Scotland spending above 3% or 5% of disposable income on water charges (2024-2025 to 2029-2030)
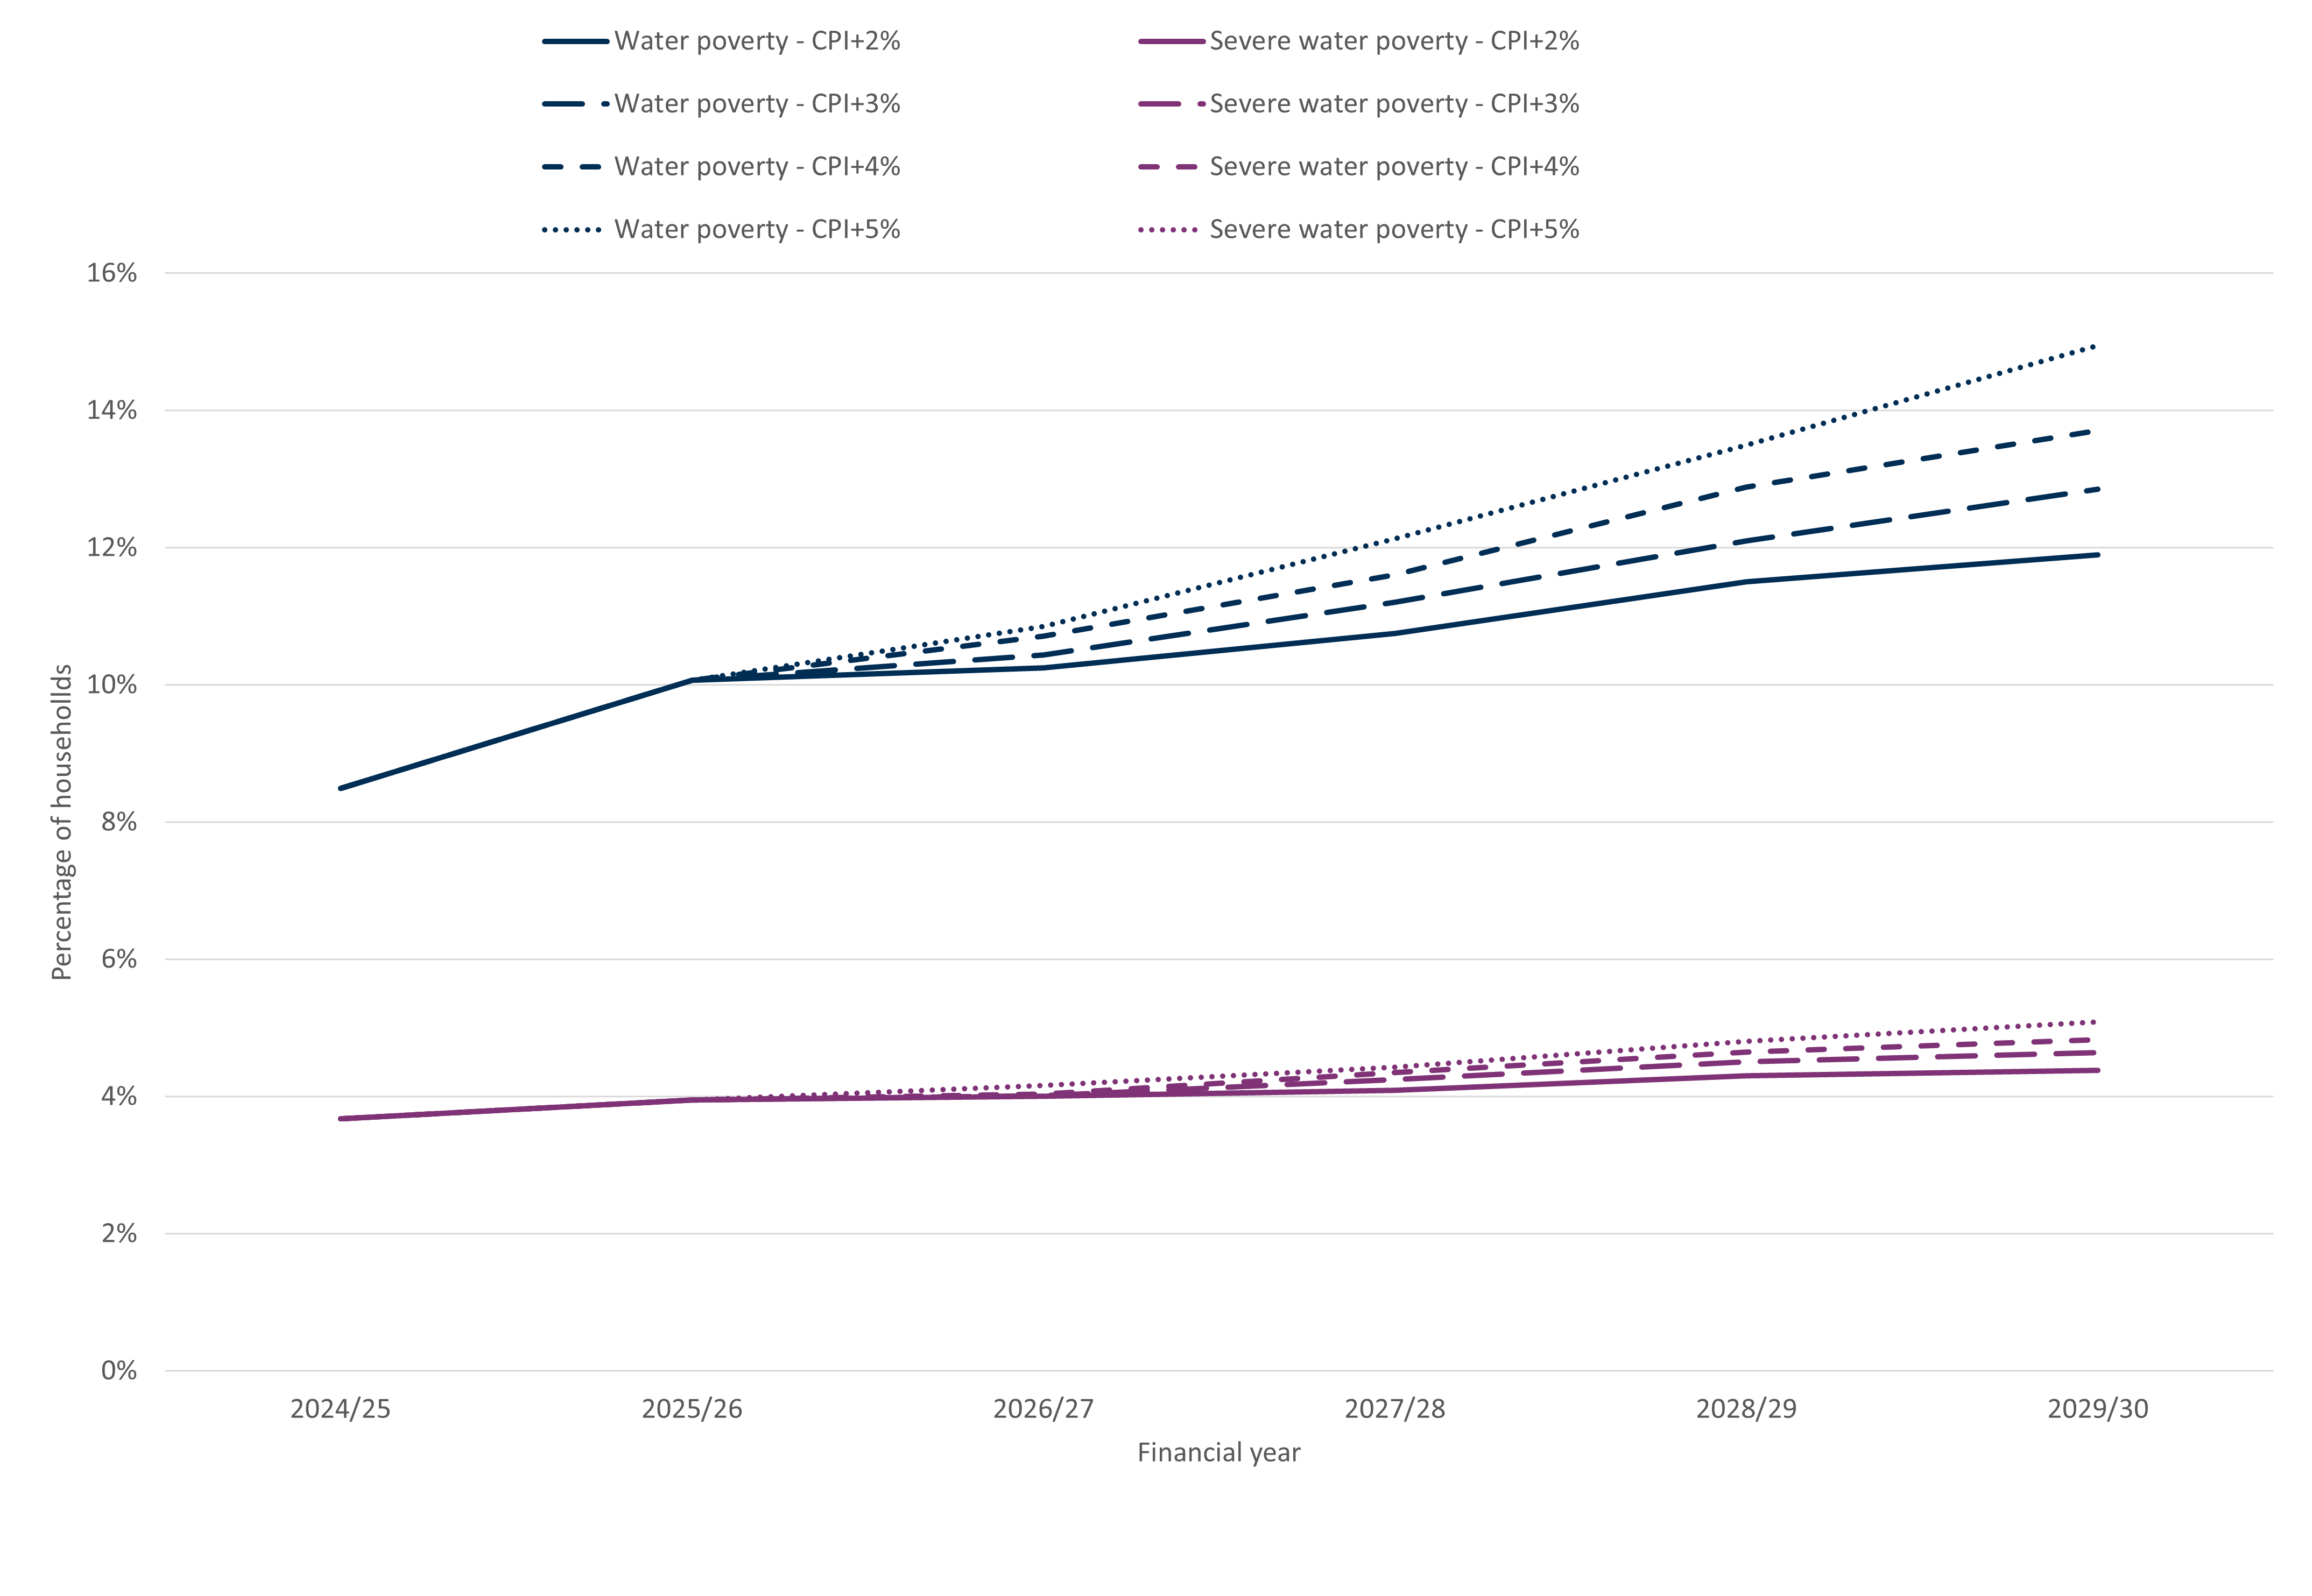
Source: Consumer Scotland analysis of Family Resources Survey via UKMOD. N = 5,662. Note: All analysis assumes that CPI will be 2% for forecasted years. The water charge for 2026-2027 has been set in line with the overall forecast scenario assumptions (e.g., CPI+2%, CPI+3% etc, depending on the scenario) – although there is scope for an increase of up to CPI+5% as it is the final year of SR21, as outlined above.
Longer-term scenario analysis
The projections in Chart 3.4 cover the period to 2029-2030; in other words, they cover the first three years of the six-year SR27 period. These projections are based on the latest official forecasts for the growth in household income by income source (e.g. wages and salaries, occupational pensions, social security payments, etc.), housing costs, inflation and interest rates, and stated government policy towards taxation and social security.
The outlook for the economy and household finances becomes increasingly uncertain as we move further into the future. For these reasons, we do not attempt to project the outlook for water poverty beyond 2029-2030 using the same methodology.
However, to get a sense of the outlook for water poverty across the whole SR27 period, we undertake some scenario analysis. Rather than trying to project the likely rate of water poverty given specific forecasts for underlying economic parameters made by the official forecasters, the scenario analysis aims to give an indication of the potential range of water poverty conditional on different outcomes for household finances.
Specifically, Table 3.2 shows the potential change in the rate of water poverty over the whole SR27 period, conditional on the relationship between the average annual real growth of water charges, and the average annual real growth of household income.
For example, if water charges were to increase by 2% per year in real terms (CPI+2%) whilst disposable household incomes increased by 1.5% per year in real terms (CPI+1.5), then the water poverty rate may increase by less than one percentage point over the SR27 period.
On the other hand, if charges increased each year by CPI+5% and household disposable income increased by just CPI+0.5%, then the water poverty rate could increase by around eight percentage points over the SR27 period – taking it to around 18%.
Unlike the analysis in Chart 3.4, which aims to project water poverty given the latest economic forecasts, the scenario analysis aims not to provide specific projections, but to use scenarios to explore likely outcomes under different economic scenarios. For context, the latest forecasts from the Scottish Fiscal Commission imply disposable income increasing by an average of 0.4% per year from 2025-2026 to 2028-2029, then averaging just under 1% in 2029-2030 and 2030-2031.
However, the actual outcome for water poverty will depend on factors such as the way that specific policy changes (such as on income tax thresholds or social security uprating) affect household incomes for different household types.
Table 3.2: The likely increase in water poverty over SR27 will depend on the relationship between household income growth and growth in water charges
Percentage point change in water poverty rate between 2025-2026 and 2032-2033 under different scenarios for average annual real increases in water charges and household incomes
| Annual real growth in household incomes | ||||
|---|---|---|---|---|
| 0.5% | 1% | 1.5% | ||
| Annual real growth in water charge | 2% | 2.0 | 1.4 | 0.8 |
| 3% | 3.5 | 2.7 | 2.0 | |
| 5.3% | 5.3 | 4.5 | 3.5 | |
| 5% | 8.0 | 6.4 | 5.2 | |
6. Characteristics of households in water poverty
This chapter considers how water poverty rates vary by household characteristic. For this analysis, we pool three years of HBAI data (2021-2022 to 2023-2024) to maximise the sample size. Household income is the strongest predictor of water poverty.
Low income
The key point to note is that water poverty is primarily associated with low income (i.e. have disposable, equivalised income of below 60% of the median).
Specifically, of the households in water poverty, nearly all (around 9 in 10) are in low income poverty. Only 30,000 households (12% of households in water poverty) are not also in income poverty. All households in severe water poverty are in low income poverty.
We can also see the importance of income when looking in more granular levels. For example:
- The majority (68.7%) of households in the lowest decile of income (i.e. the bottom 10%) are in water poverty.
- This falls to 21.1% of households in the second decile, and 7.1% in the third.
- No households in the top half of the income distribution are in water poverty (as shown in Chart 4.1).
Similarly, being in severe water poverty (i.e. spending more than 5% of disposable income on water and sewerage charges) is uniquely a feature of low-income households:
- Almost half (43.5%) of households in the lowest income decile are in severe water poverty – equivalent to 327,000 households.
- Only 3.0% of households in the second decile are in severe water poverty.
- None of the households in higher income deciles are in severe water poverty.
Other characteristics
Other than income, the characteristics of households in water poverty are relatively diverse. This reflects that low income is experienced by a wide range of households – including those in and out of work, in a variety of housing tenures, and a range of different family types.
This can be observed in Chart 4.1. This shows, for example:
- Council tax band: Water poverty rates are higher in council tax bands E, F and G than in bands A-D. This reflects wide variation in household income within each band, and that charges are systematically higher in higher banded properties.
- Family type: Water poverty rates are highest amongst single working-age adult households (13.2%) and lowest amongst single parent households (7.2%) and pensioner households. But the important point to note is that, whilst these differences are statistically significant, they are not substantively very different across groups – water poverty is fairly ubiquitous across household composition.
- Housing tenure: Water poverty rates are higher in private rented (12.9%) and social rented (11.9%) households than those who own with a mortgage (6.6%) or owned outright (10.5%).
- Economic status: Households where nobody is in work are more likely to be in water poverty than those where at least one person is in work.
Chart 4.1: Low-income households are most likely to be in water poverty
Percentage of households in Scotland spending above 3% or 5% of disposable income on water charges, by demographic characteristics (2021-2022 to 2023-2024)
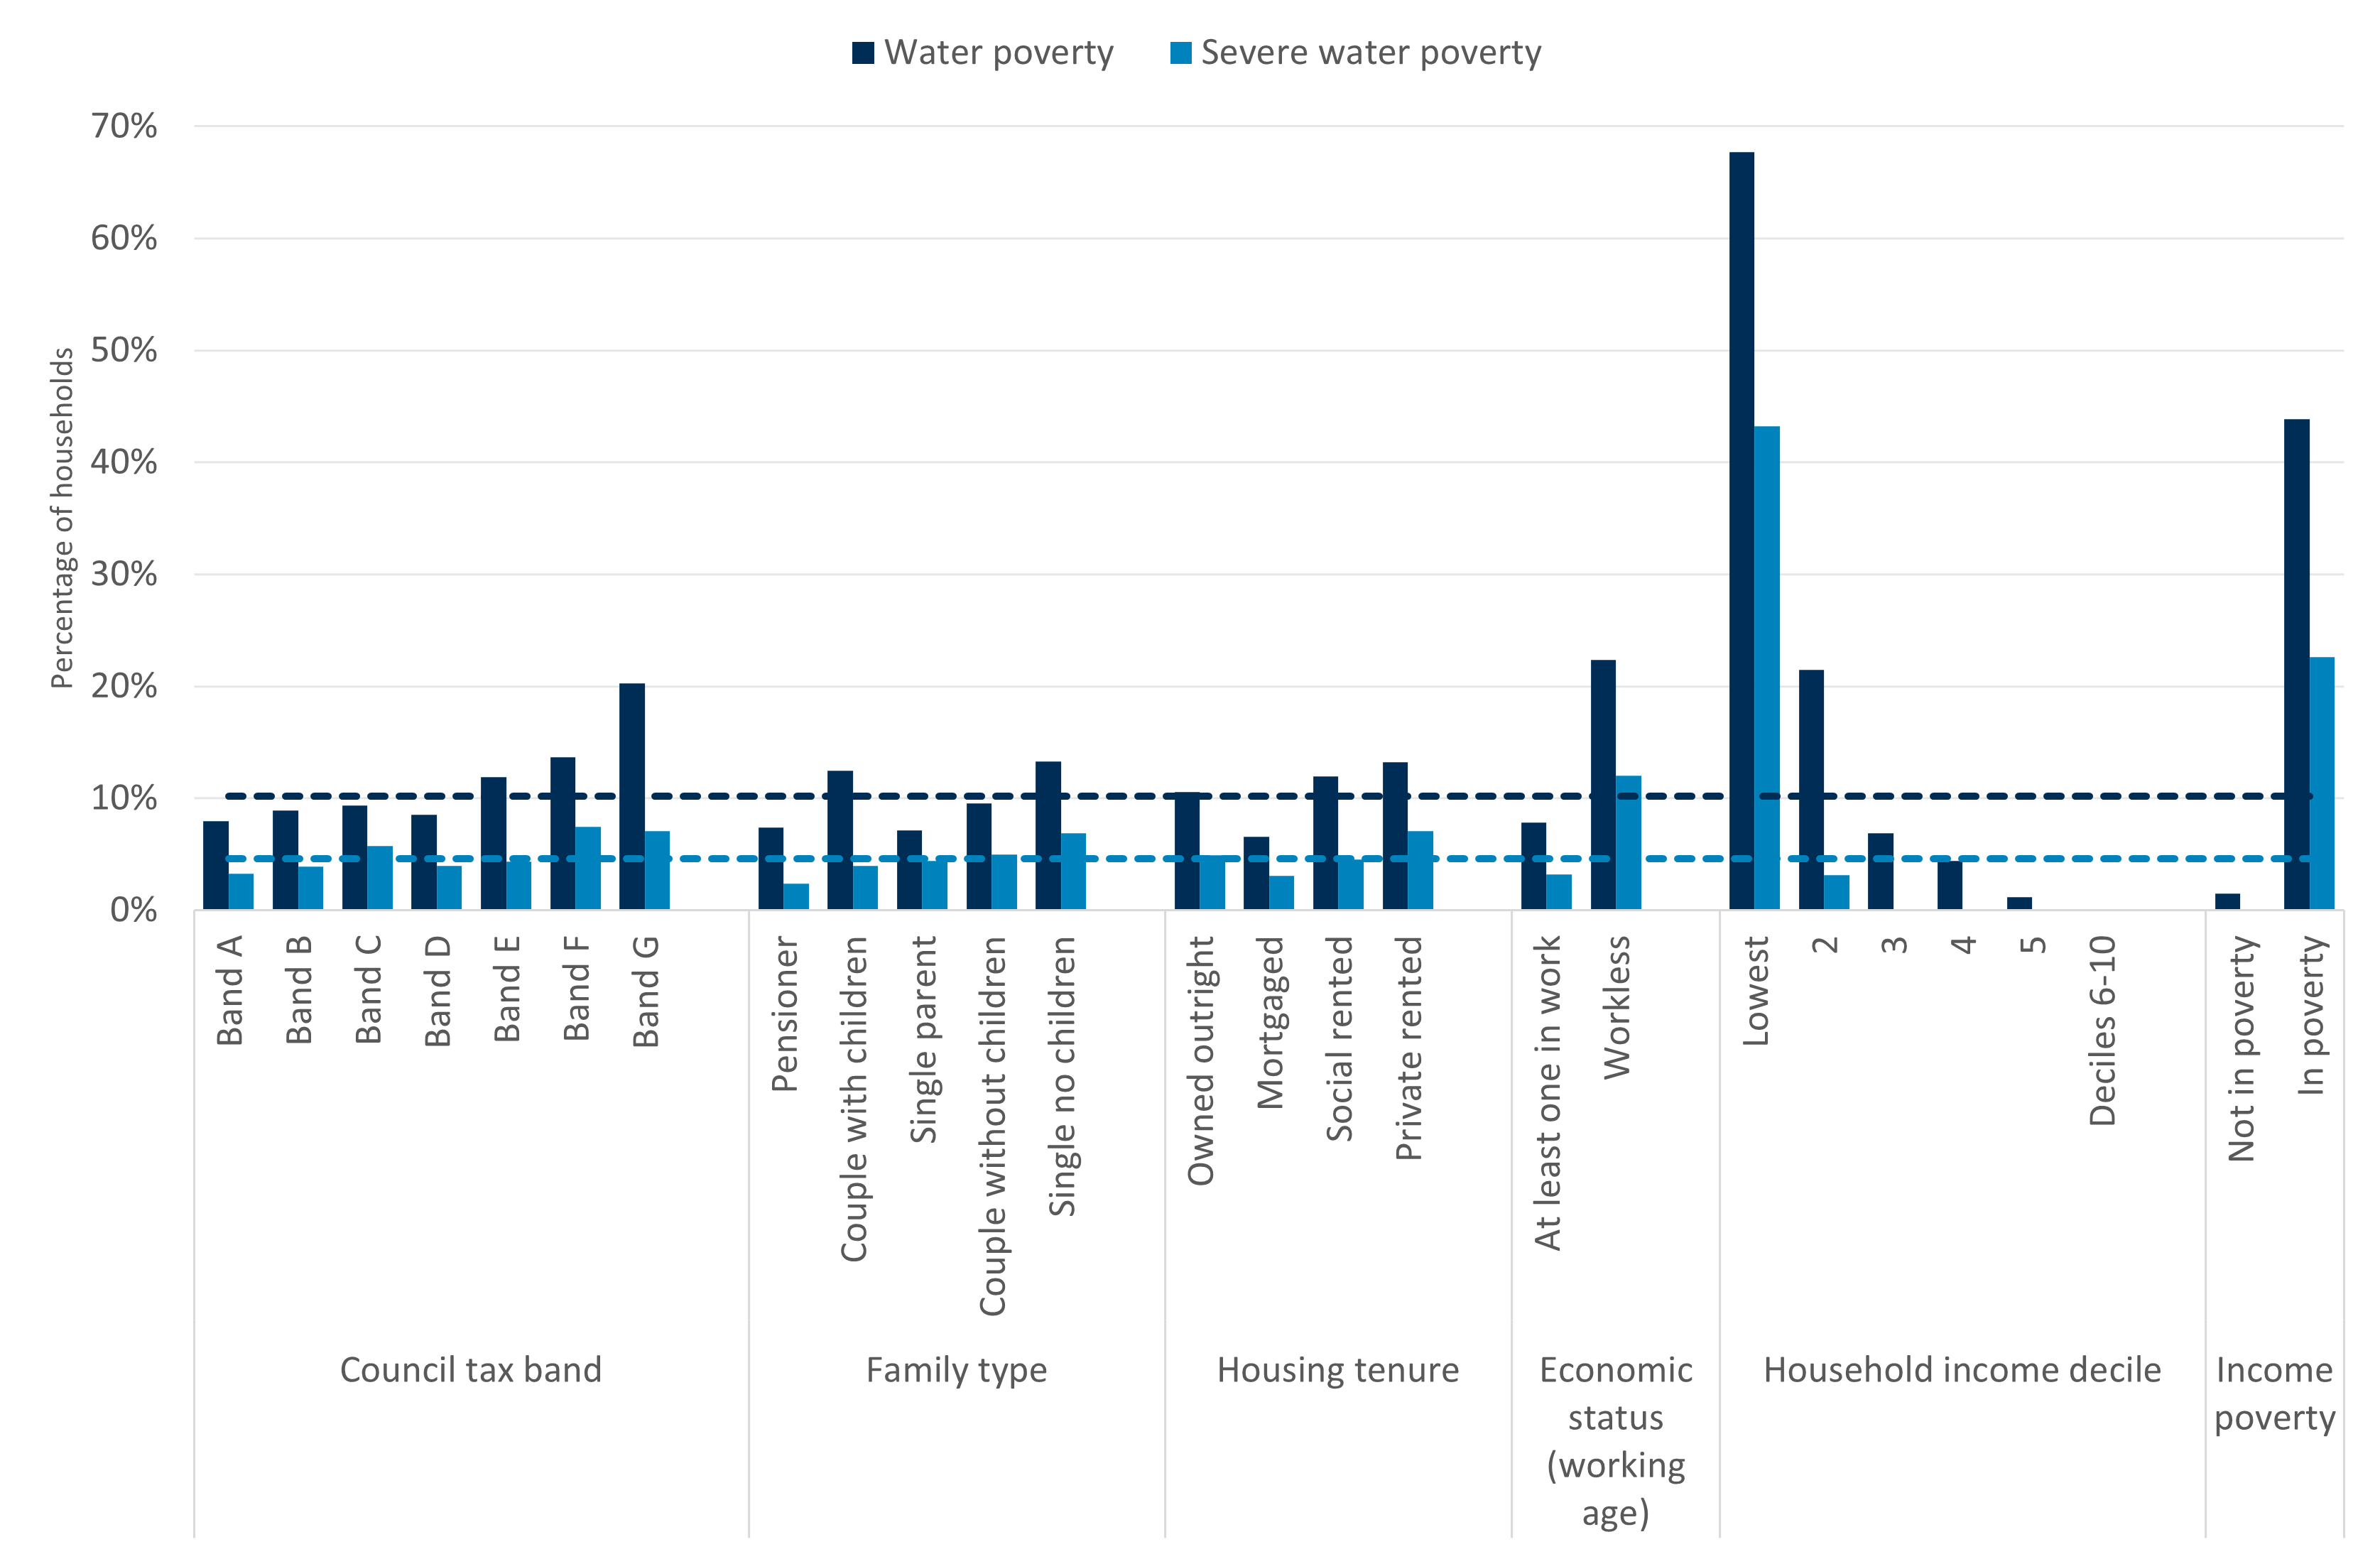
Source: Consumer Scotland analysis of Households Below Average Income dataset (2021-2022 to 2023-2024). Unweighted N = 5,591; weights used for analysis. Dashed lines indicate population mean for water poverty and severe water poverty.
Multivariate analysis
We can get a clearer sense of the importance of income in determining the likelihood of being in water poverty by regressing the probability of water poverty on a selection of household characteristics. A regression that only includes non-income characteristics such as family type, council tax band, and housing tenure, can only explain around 5% of the variation in water poverty across households. However, a regression which also adds household income is able to explain more than 70% of the variation in probability of water poverty across households.
To see why this might be, consider Chart 4.2. This shows how both family type and household income jointly influence the probability of a household being in water poverty. It is based on a regression which models the probability of water poverty as a function of income, family type, housing tenure and council tax band.
Chart 4.2 tells us that, if a household is in the lowest decile of household income, its probability of being in water poverty will range from 55% (single parent) to 93% (working age couples). These differences in poverty rate within a given income decile reflect differences in water charges:
- For a given decile of household income, single parents have a lower likelihood of water poverty because their water bills tend to be lower for two reasons: 1) they receive the single person discount; 2) additionally, the majority receive additional reductions through the WCRS.
- Conditional on income, pensioner and single person households have a similar probability of water poverty, for slightly different reasons: not all pensioner households receive the single person status discount; and fewer single parent adults receive the WCRS than is the case for single parent households.
- Conditional on income, working age couple households are most likely to be in water poverty, since they are relatively less likely to qualify for WCRS.
When we look at decile 2 or decile 3, the relative differences between family type remain. But the probability of being in water poverty falls significantly for all family types as income increases. By decile 5 and above, the probability of being in water poverty is effectively zero, regardless of family type.
This analysis helps to show that, whilst there are some differences in the probability of water poverty across family type, household income is ultimately the key determinant of the probability of water poverty.
Chart 4.2: Income is more significant than family type in influencing the probability of water poverty
Probability of a household being in water poverty, by income decile and family type (2021-2022 to 2023-2024)
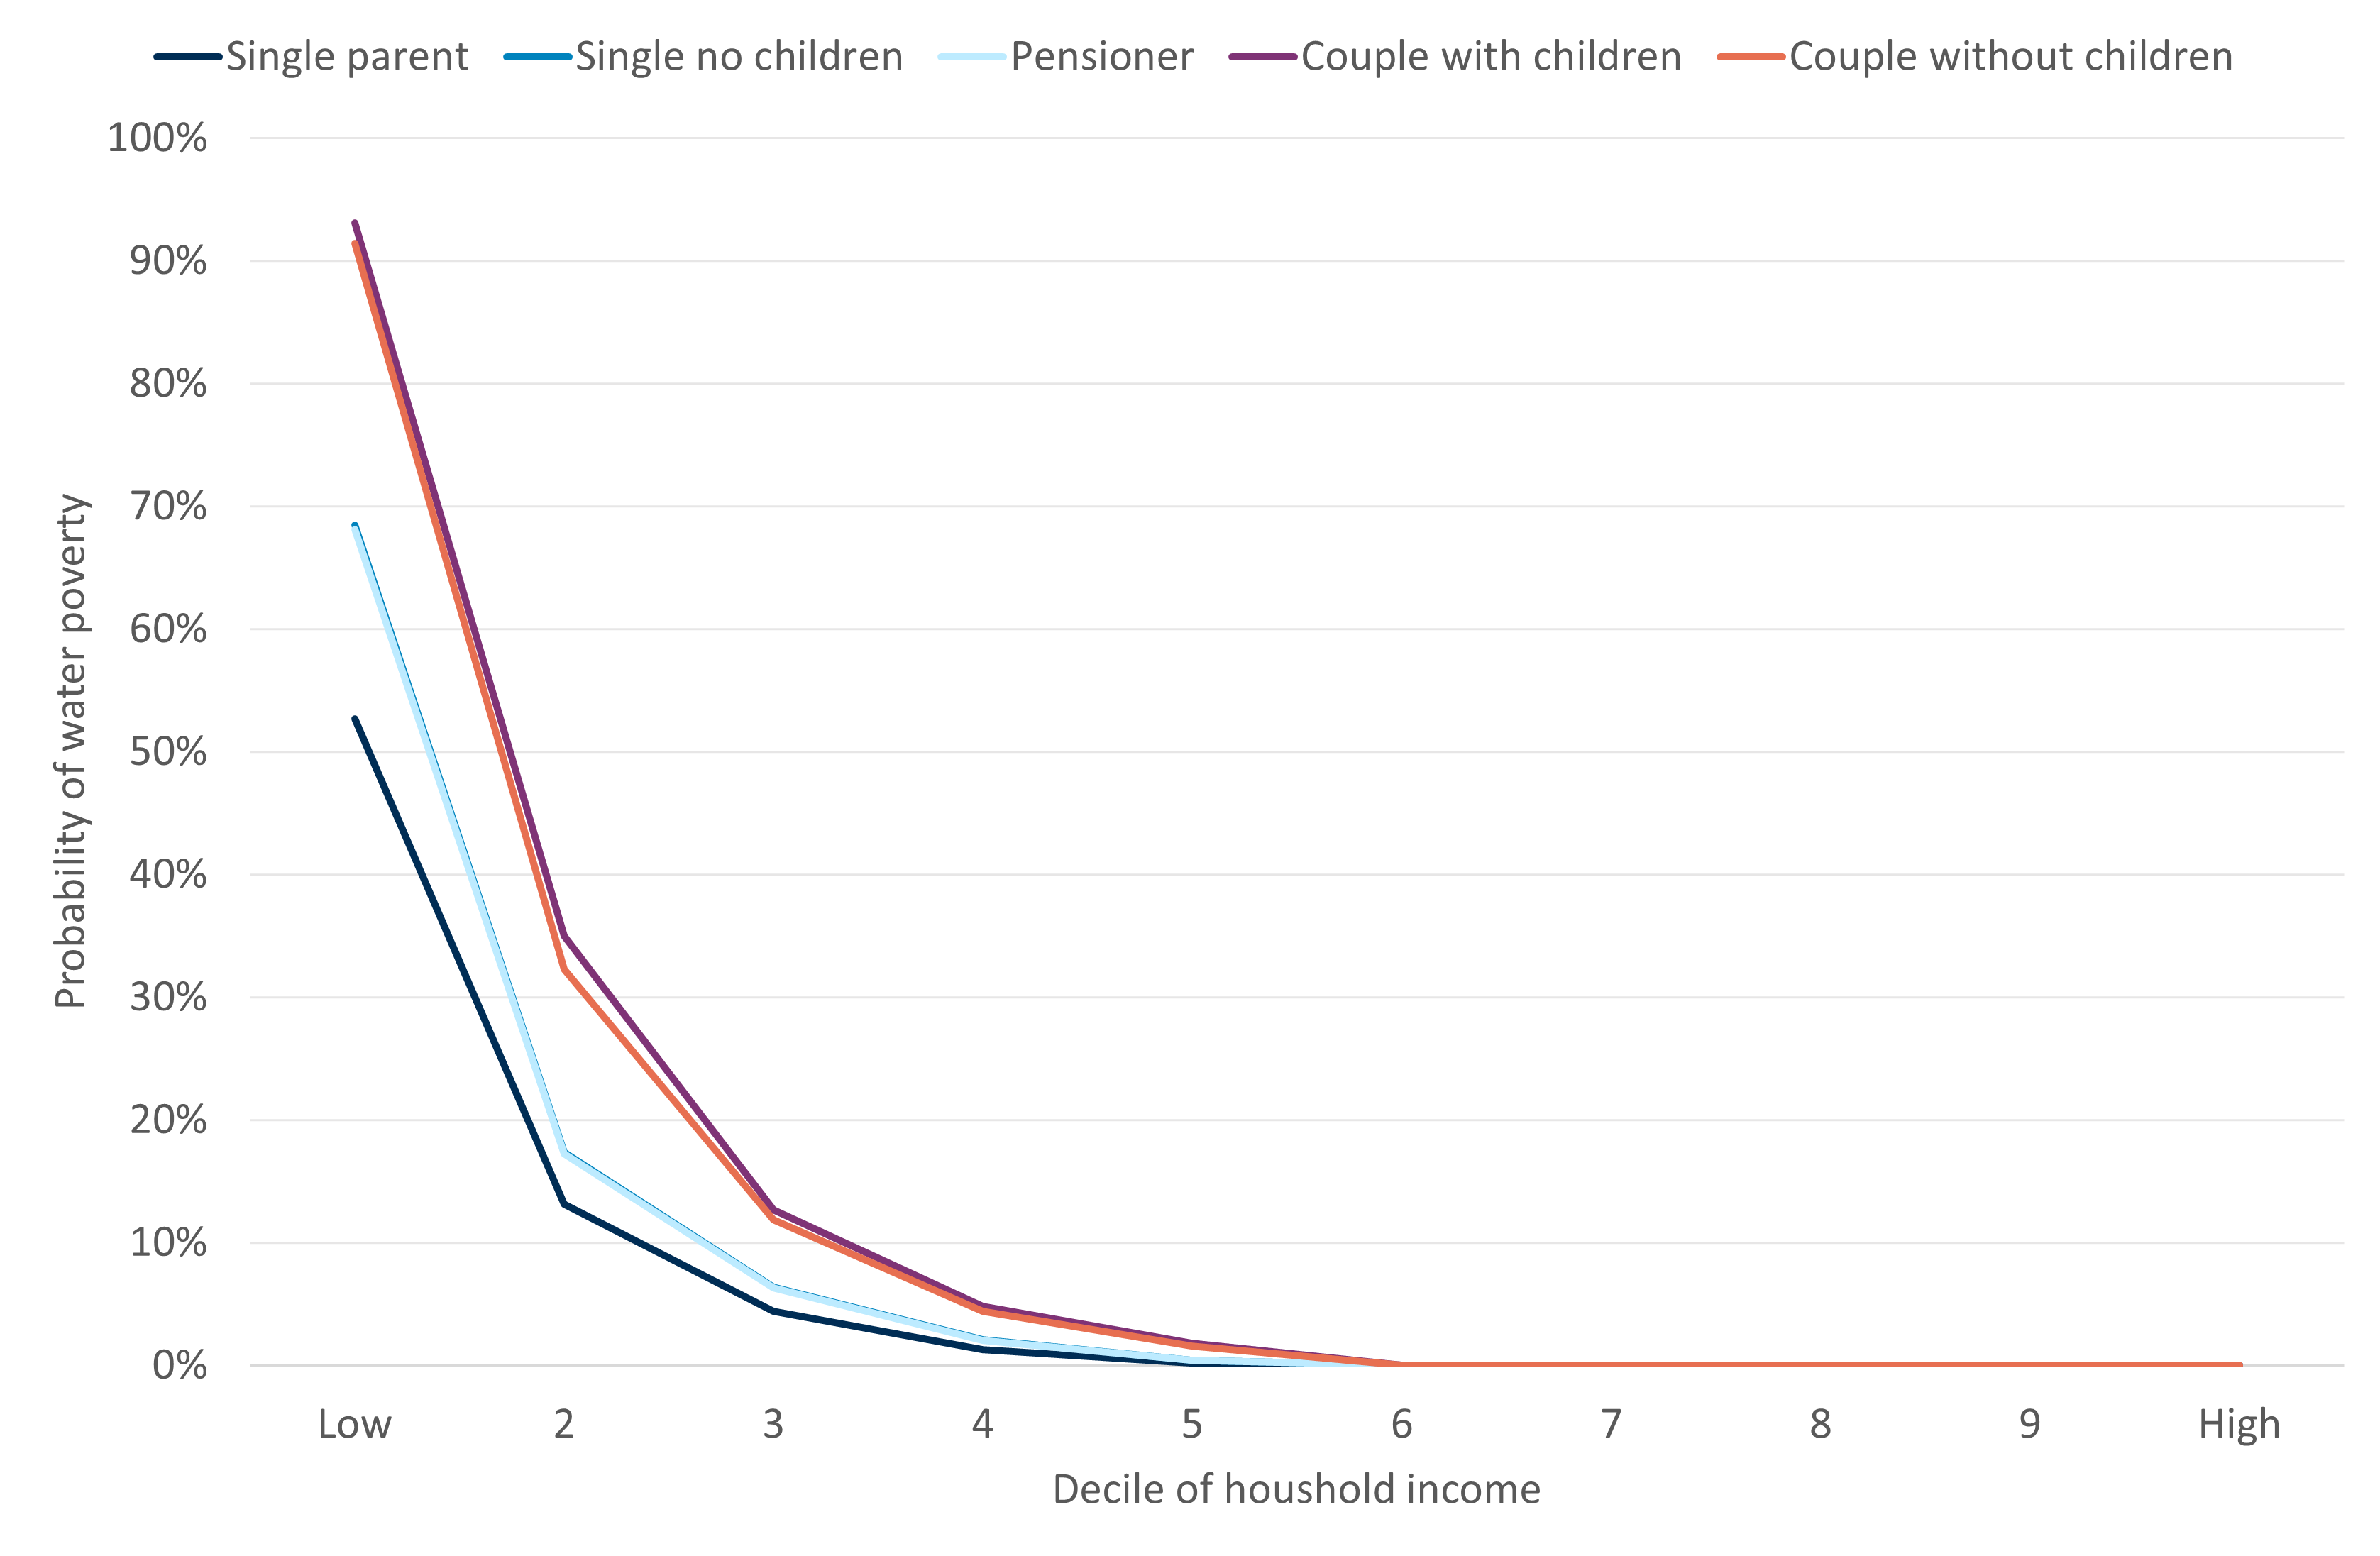
Source: Consumer Scotland analysis of Households Below Average Income dataset (2021-2022 to 2023-2024). Unweighted N = 5,591; weights used for analysis. Results based on a probit regression of water poverty on household income, family type, council tax band, and tenure.
7. The impact of charging policy
This chapter examines the impact of changes to the structure of water charges on water poverty. It considers the impact of increases to the WCRS, including the impacts of increased charges across other billpayers to fund these increases. It compares the impact of funding a WCRS from increased charges for all billpayers, with the policy to fund an increase in WCRS through reductions in the Single Person Discount. Whilst an increase in WCRS is only partially effective in mitigating projected increases in water poverty, the majority of benefit is nonetheless experienced by households in the bottom third of the income distribution.
The impact of varying the Water Charges Reduction Scheme (WCRS)
We estimate that around 426,000 households in Scotland currently receive the Water Charges Reduction Scheme (WCRS). Since 2021-2022 the scheme provides eligible households with up to a 35% discount on their water bills, having increased from a maximum 25% discount provided in the previous charging period.
Table 5.1 summarises the impact of changing the WCRS discount level on rates of water poverty.
For context, the table also shows the impact of removing the WCRS entirely. Without the scheme, an estimated 11.4% of households in Scotland would be in water poverty – 1.4 percentage points higher than under the current 35% discount. This implies that the existing WCRS helps approximately 36,000 households avoid water poverty.
One way to reduce water poverty is to increase the WCRS level beyond 35%. However, this would require higher gross water charges to fund the additional support, so it is important to consider the benefits and costs to consumers. Our analysis suggests that increasing the WCRS from 35% to 50% would cost £24 million per annum. This is equivalent to an increase on bills of two percentage points. Increasing it to 100% would cost a further £82 million per annum. These increased costs are assumed to be funded by higher charges for all customers.
In the analysis that follows, the costs of increasing the WCRS are ‘fully funded’ by reallocating them across all bills.
Increasing the WCRS to 50% would reduce water poverty by around 0.7 percentage points, equivalent to 17,000 fewer households in water poverty (Chart 5.1). A 100% discount would result in a similar reduction – 0.6 percentage points or 16,000 fewer households compared to the current 35% level. Under the 100% scenario, the number of people in water poverty is slightly higher than in the 50% scenario due to the increased gross water charges required to fund the increased discount.[14]
Increasing the WCRS from 25% to 35% brought an additional 223,000 households into the scheme, despite no change in eligibility criteria. This is because under the 25% WCRS, single person households (who already received a 25% bill reduction) did not benefit from further reductions. Once the WCRS increased to 35%, these households received an additional 10 percentage points reduction.[15]
Further increases beyond 35% do not materially change the number of recipient households, but they do increase the average amount of support received per recipient household. [16] If the WCRS were increased to 50% or 100%, the average annual bill support per recipient households would increase to £135 and £336 respectively.
We modelled a range of increased WCRS levels, in 5 percentage point increments from 35% to 100%. The 65% WCRS scenario resulted in the lowest water poverty rates – 9.2%, equivalent to around 239,000 households. This is lower than the 35% scenario, in which 10.1% of households were in water poverty, and only slightly lower than the 50% and 100% scenarios (both 9.4%).
It is worth noting that an increase in the WCRS from 35% to 50% would be sufficient to offset the real-terms rises in the water bills for those households who receive it, under a scenario where water charges increase by 4% annually in real terms. In other words, under a scenario where water charges increase at CPI+4% and the WCRS increases to 50%, WCRS recipients will face a bill that is slightly lower in real terms at the end of SR27 than at the start. However, if bills were to increase annually by 5%, an increase in WCRS to 50% would not quite offset the real increases in bills for recipients.
Table 5.1: Increasing the WCRS would reduce water poverty by up to 1 percentage point
Impact of varying the Water Charges Reduction Scheme on water poverty, number of recipients and scheme cost (2025-2026)
|
|
0% WCRS |
25% WCRS |
35% WCRS |
50% WCRS |
65% WCRS |
100% WCRS |
|---|---|---|---|---|---|---|
|
Water poverty rate (3% threshold) |
11.4% |
10.4% |
10.1% |
9.4% |
9.2% |
9.4% |
|
Severe poverty rate (5% threshold) |
4.2% |
4.0% |
4.0% |
3.9% |
3.8% |
3.8% |
|
No. of households in water poverty (3% threshold) |
289,000 |
263,000 |
256,000 |
239,000 |
234,000 |
240,000 |
|
No. of WCRS recipients |
NA |
203,000 |
426,000 |
439,000 |
446,000 |
454,000 |
|
Average annual reduction per WCRS recipient |
NA |
£92 |
£80 |
£135 |
£193 |
£336 |
|
Total annual revenue (£m) |
£1,350 |
£1,331 |
£1,315 |
£1,316 |
£1,316 |
£1,317 |
Source: Consumer Scotland analysis of Family Resources Survey via UKMOD. N = 5,662. Note: Figures for WCRS scenarios above 35% are modelled by increasing gross water charges to yield a similar total annual revenue as the baseline scenario.
Chart 5.1: Water poverty would be around 0.7 percentage points lower if WCRS were increased to 50%
Percentage of households in Scotland spending above 3% or 5% of disposable income on water charges, by WCRS scenario (2025-2026 to 2029-2030)

Source: Consumer Scotland analysis of Family Resources Survey via UKMOD. N = 5,662. Note: All analysis assumes a CPI of 2% and water charges of CPI+4% for forecasted years. Figures for WCRS scenarios above 35% are modelled by increasing gross water charges to yield a similar total annual revenue as the baseline (35% WCRS) scenario.
Even without accounting for higher charges needed to fund higher discounts, a 100% WCRS would still leave an estimated 7.9% of households in Scotland in water poverty. (Chart 5.2)
Chart 5.2: Even without socialising the costs of increased WCRS to 100%, there would still be a considerable proportion of people in water poverty
Percentage of households in Scotland spending above 3% of disposable income on water charges, by WCRS scenario (2025-2026 to 2029-2030)
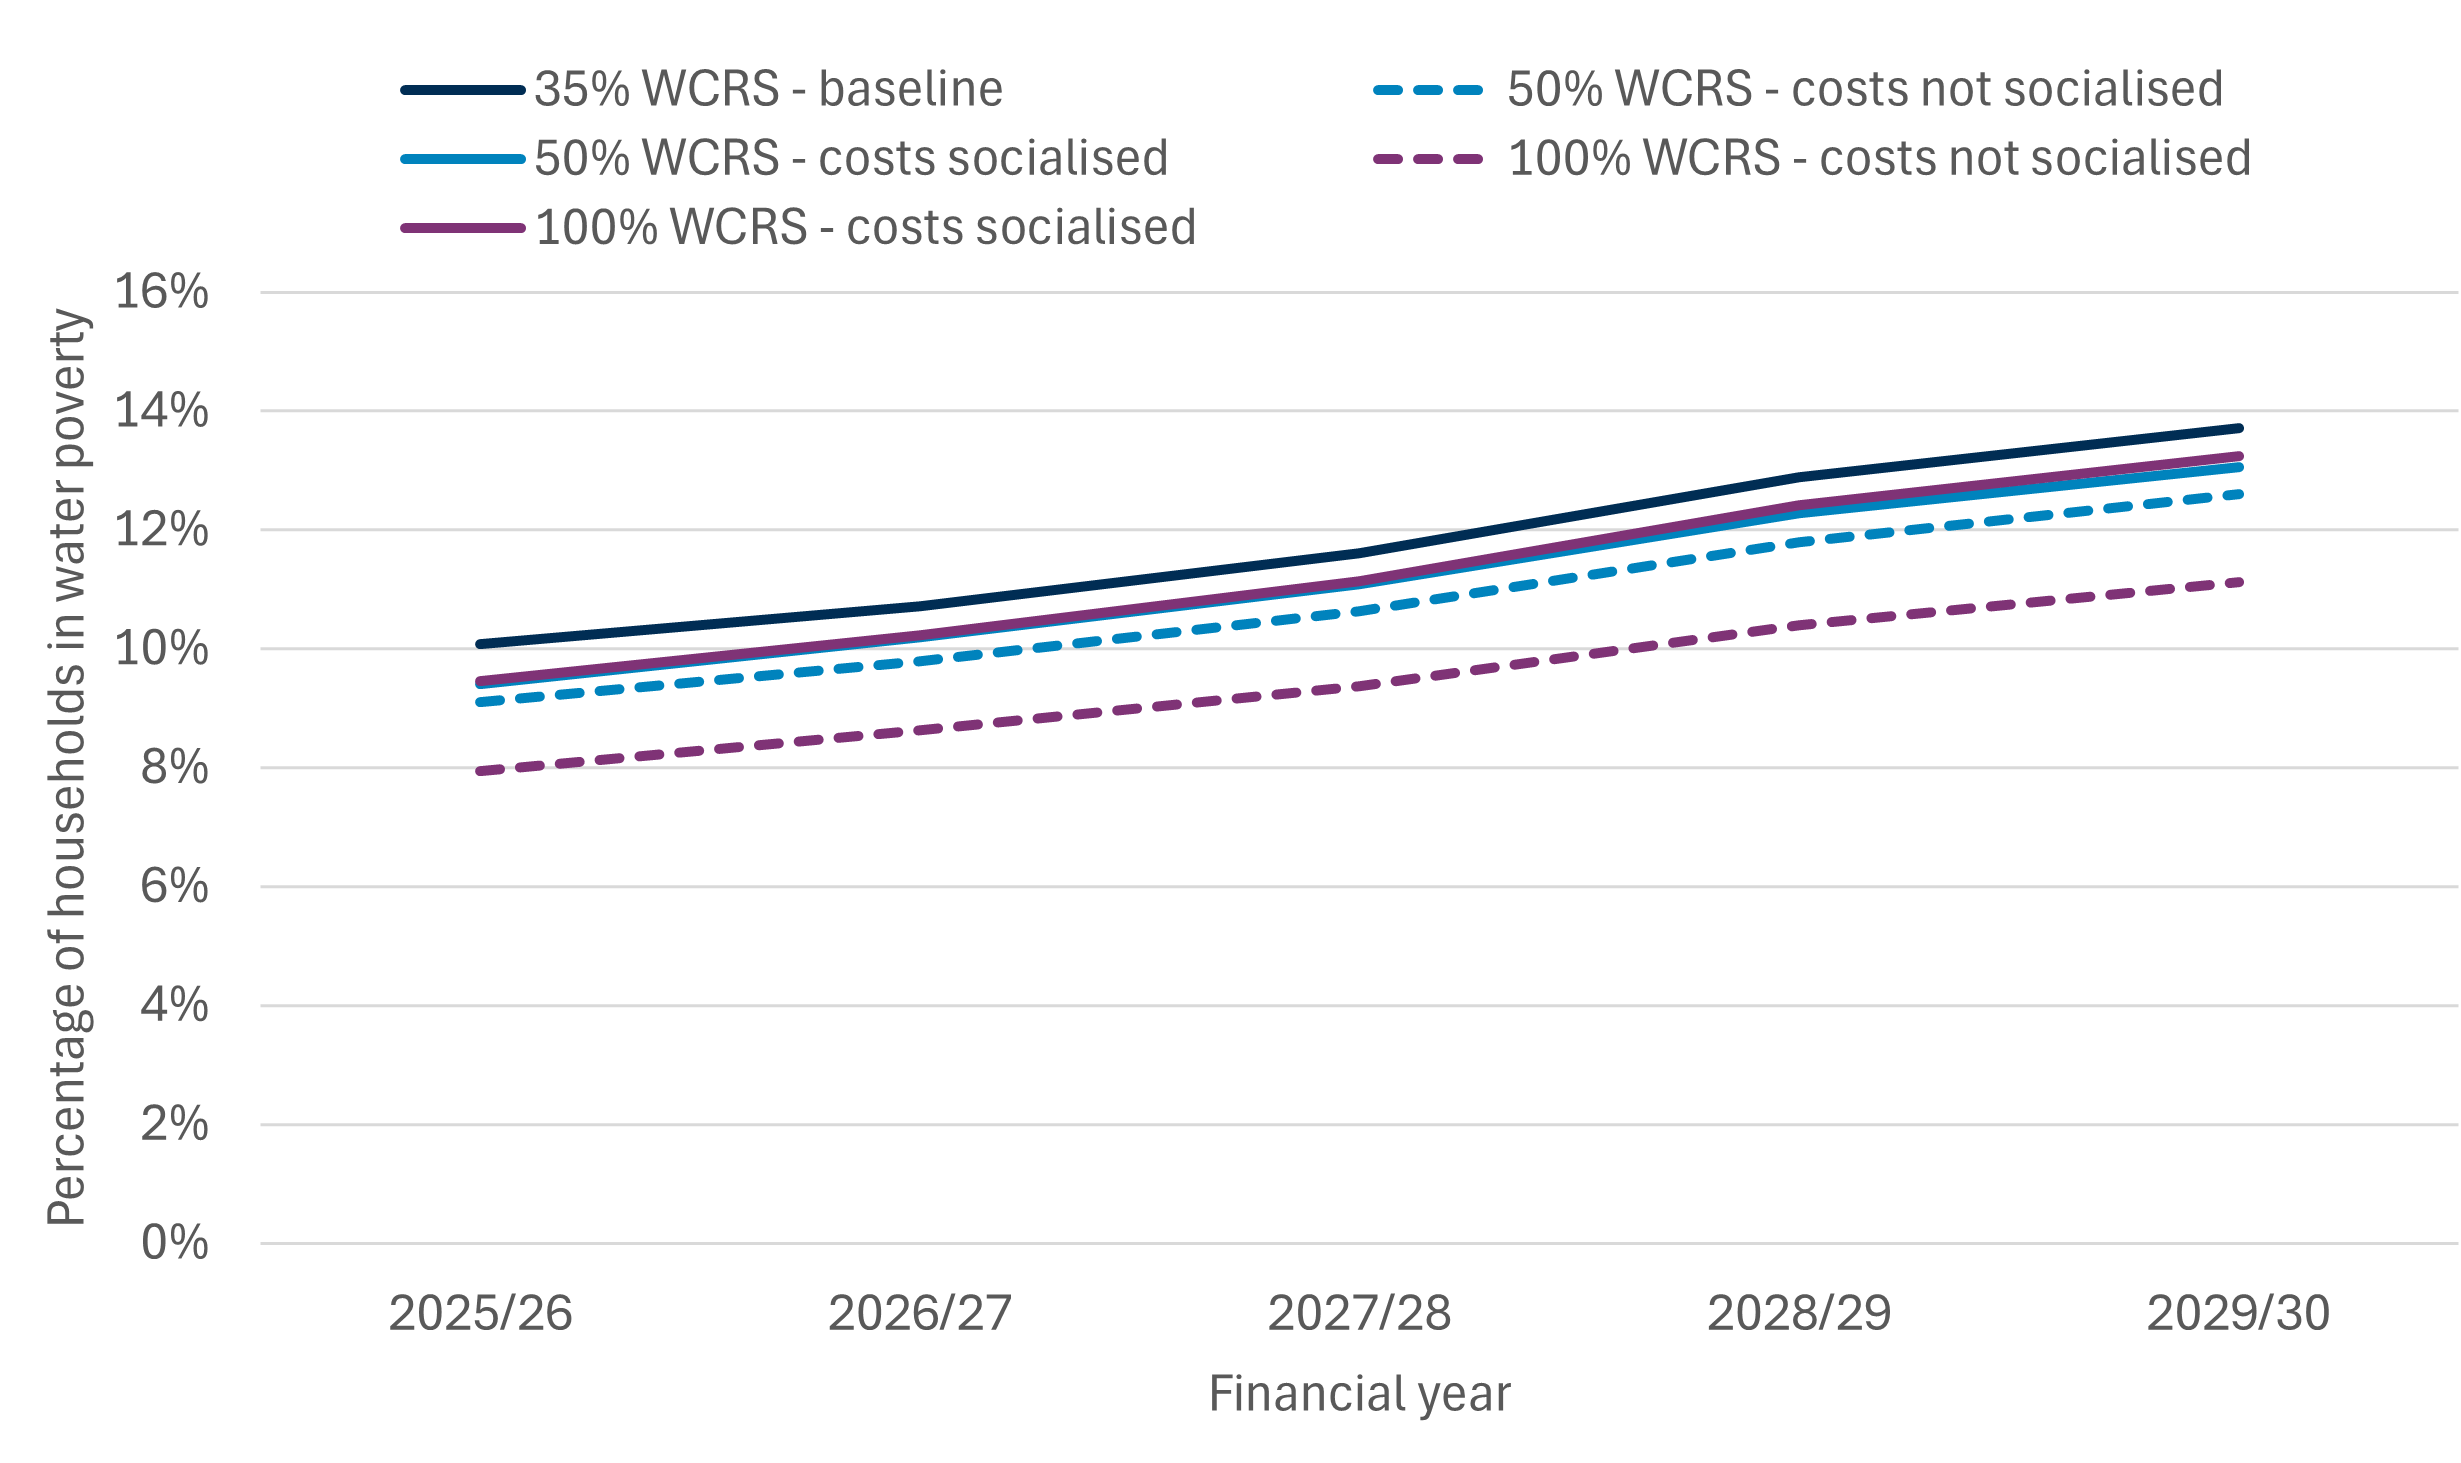
Source: Consumer Scotland analysis of Family Resources Survey via UKMOD. N = 5,662. Note: All analysis assumes a CPI of 2% and water charges of CPI+4% for forecasted years. ‘Socialised costs’ scenarios are modelled by increasing water charges to yield a similar total annual revenue as the baseline (35% WCRS) scenario.
The relationship between water poverty and the WCRS
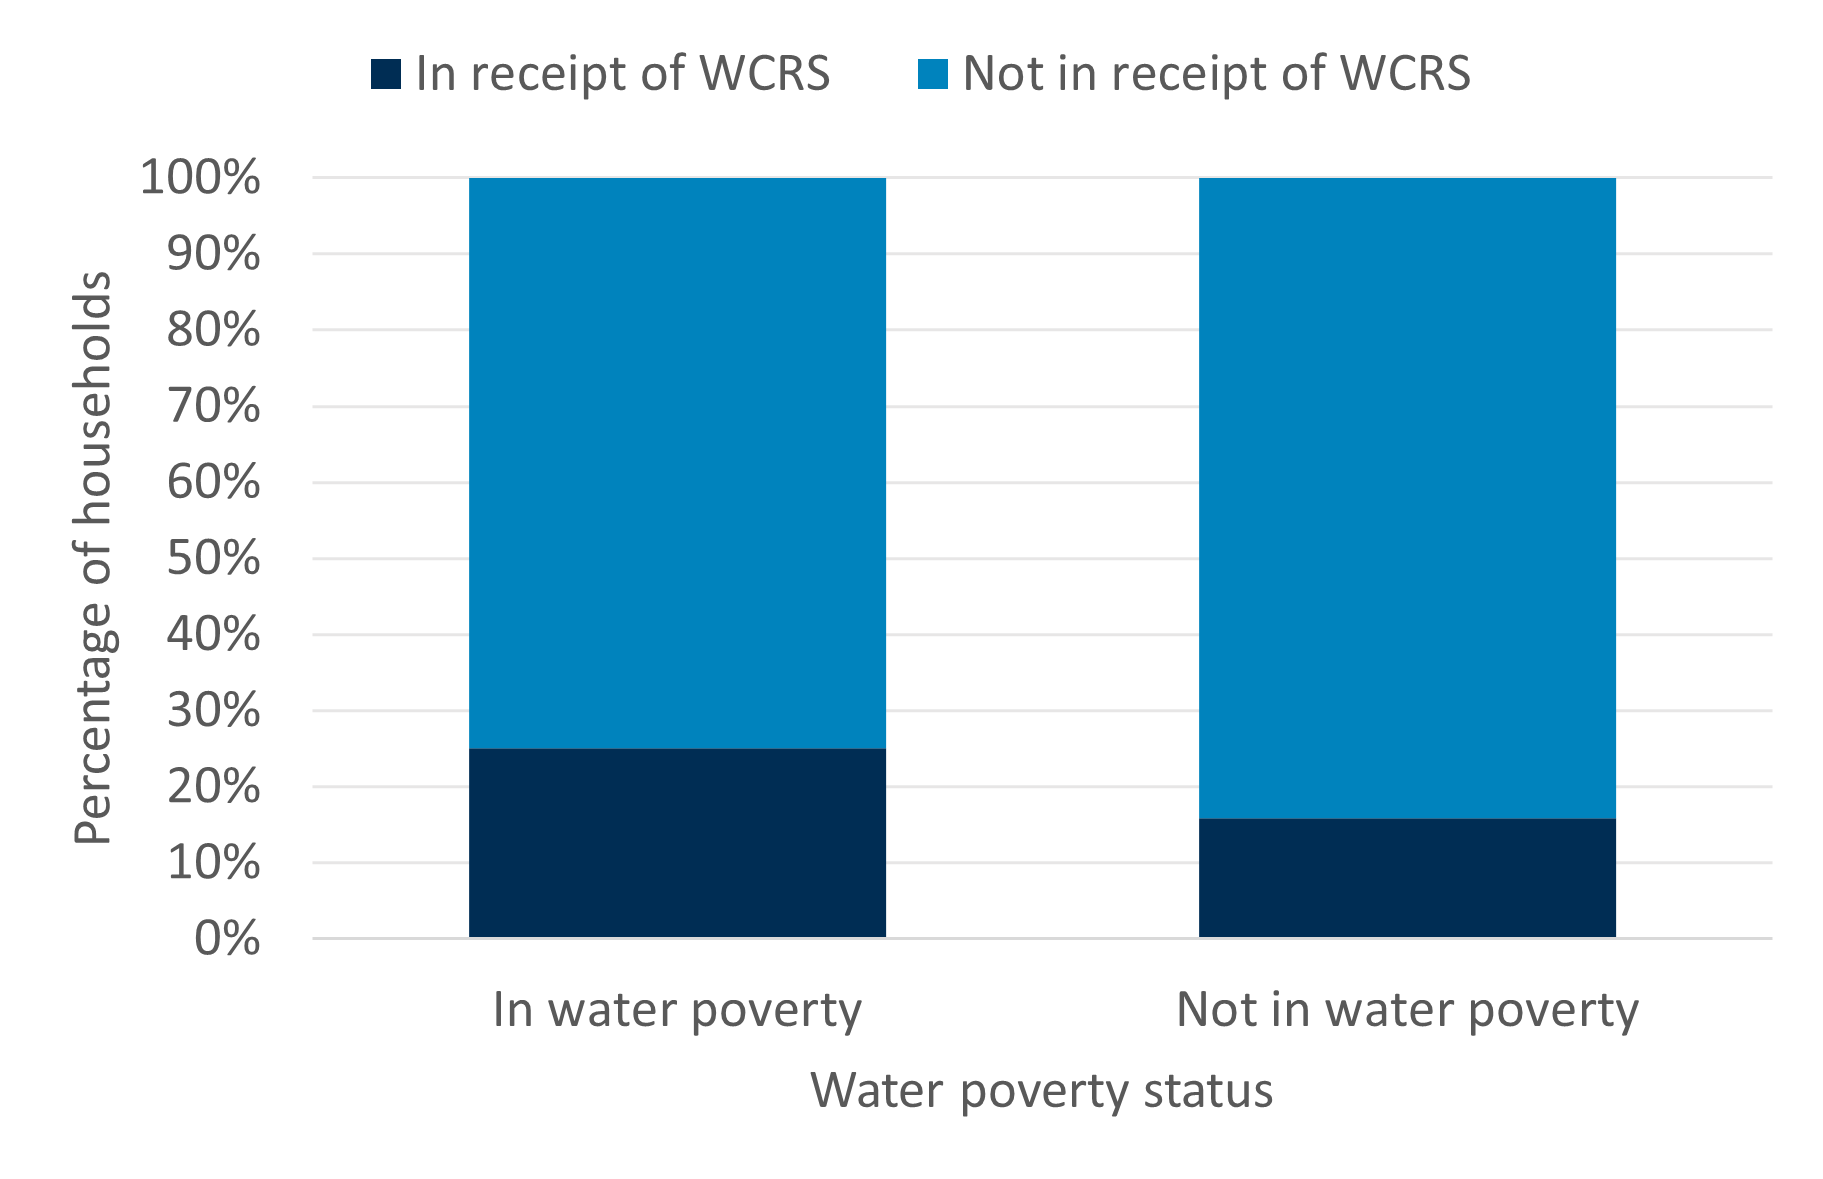
The analysis above indicates that increasing the level of bill reduction provided by WCRS provides a relatively limited impact on the number of households in water poverty – even if the costs of the policy are not socialised across other bill payers.
This result is driven by the point that only around a quarter (25%) of households experiencing water poverty are in receipt of the WCRS (Chart 5.3). This means that the majority of those in water poverty receive no WCRS – equivalent to 192,000 households. On the other hand, most households (85%) who do receive the WCRS are not in water poverty.
An important point is that around 33,000 of these households who are not in water poverty but do receive WCRS would be in water poverty in the absence of the scheme. This is an important reminder that households in receipt of WCRS but being above the water poverty line does not entirely indicate policy inefficiency.
Chart 5.3: A minority of households who are in water poverty receive WCRS support
Percentage of households in Scotland spending above 3% of disposable income on water charges, by WCRS receipt (2025-2026)
Source: Consumer Scotland analysis of Family Resources Survey via UKMOD. N = 5,662.
Nonetheless, the fact that relatively few households who are in water poverty receive WCRS may seem surprising. What is behind this?
The first factor that drives this is under-claiming. Some households are eligible for WCRS but do not receive it. Less than full uptake of WCRS could occur for several reasons. Eligible recipients may not claim because of a lack of awareness of support, a sense of stigma associated with benefit receipt, or a perception that application processes are too onerous in the context of the support provided. This latter circumstance might arise in particular where claimants have, at the time they are surveyed, experienced a reduction in income which they anticipate will be temporary or short-term.
These explanations can apply to the benefits that act to passport claimants onto Council Tax Reduction (such as Universal Credit), or to Council Tax Reduction itself. Relatedly, the process of automatically passporting claimants from DWP means-tested benefits to CTR does not always work as smoothly as might be assumed for a variety of reasons relating to the data-share process.
Our own analysis, based on UKMOD, suggests that the proportion of households in water poverty who are in receipt of WCRS might increase to around 50% if all households who are eligible for WCRS received it (analysed further in the subsequent section).
Nonetheless, even with full uptake, a significant proportion of households in water poverty are likely to be ineligible for support through WCRS. Whilst this eligibility gap can again sometimes seem surprising, the eligibility gap can have a wide range of explanations. These include:
- Capital limits: Even households with very low incomes, and hence in water poverty, would tend to be ineligible for means tested benefits if their ‘capital’ (mainly savings) exceeds certain limits. For CTR, capital above £16,000 excludes a household from any entitlement, whilst capital above £6,000 but below £16,000 results in reduced entitlement.
- Single person households on partial CTR: Single person households in receipt of partial CTR may not be eligible for WCRS. Specifically, a single person household who receives less than a 70% reduction on their council tax bill will not be eligible for WCRS.[17]
- Divergent income thresholds: this is likely to be a key driver of ineligibility for WCRS amongst households in water poverty. In short, the income thresholds to qualify for CTR (and hence WCRS) fall below the thresholds that demarcate water poverty.
The latter point can be illustrated with a hypothetical example. Consider a couple household with a joint income before housing costs of £20,000 and housing costs of £3,000. If the couple occupy a band C property in 2025, they will face an annual water bill of £534. This household is thus in water poverty because its water bill exceeds 3% of after housing cost income (£17,000). But the household is unlikely to be eligible for CTR. For an adult couple, with no dependents or disabilities, the income threshold below which full CTR is payable is around £7,500 per year (before housing costs); above this income, the amount of CTR the household is eligible for is reduced, until it falls to 0 at an income of around £17,500. This household is therefore in water poverty, but its before housing costs (BHC) income of £20,000 exceeds the threshold above which CTR is no longer available.
The point of this example is that it is not difficult to envisage situations where a household can have an after housing cost income low enough to be in water poverty, but a BHC income that exceeds relevant CTR thresholds.
The mismatch between poverty measures and the effectiveness of means-tested benefits as a targeting mechanism is seen in other domains. For example, in terms of child poverty, the Scottish Parliament shows that – even with relatively generous assumptions on take-up – around two thirds of families with children in poverty receive the Scottish Child Payment. On the same topic, IPPR analysis shows that ‘a significant proportion of the child poverty total comes from couple families who do not receive universal credit (or equivalent benefits)’[18]. A similar mismatch is in evidence in relation to fuel poverty.
It might be hoped that a greater proportion of households in severe water poverty were in receipt of WCRS than is the case for water poverty. Unfortunately, analysis suggests that only around one in five households (19%) in severe water poverty are in receipt of WCRS – which would increase almost half (46%) with full take up.
This mismatch between water poverty and receipt of the WCRS demonstrates the challenges in targeting bill support. A degree of ‘mismatch’ is inevitable. As well as examining the relationship between WCRS and water poverty, it is also important to consider the relationship between WCRS and household income.
Chart 5.4 shows how the recipients of WCRS are distributed across household income deciles. The majority of recipients are in the bottom third of the income distribution. This indicates that, whilst the WCRS does not target water poverty very effectively, it does largely benefit households that are amongst the most likely to be struggling financially.
Chart 5.4: Most recipients of WCRS are in the lower three deciles of household income
Percentage of households in Scotland in receipt of WCRS, by decile of household disposable income (2025-2026)

Source: Consumer Scotland analysis of Family Resources Survey via UKMOD. N = 5,662.
Impact of increasing take-up
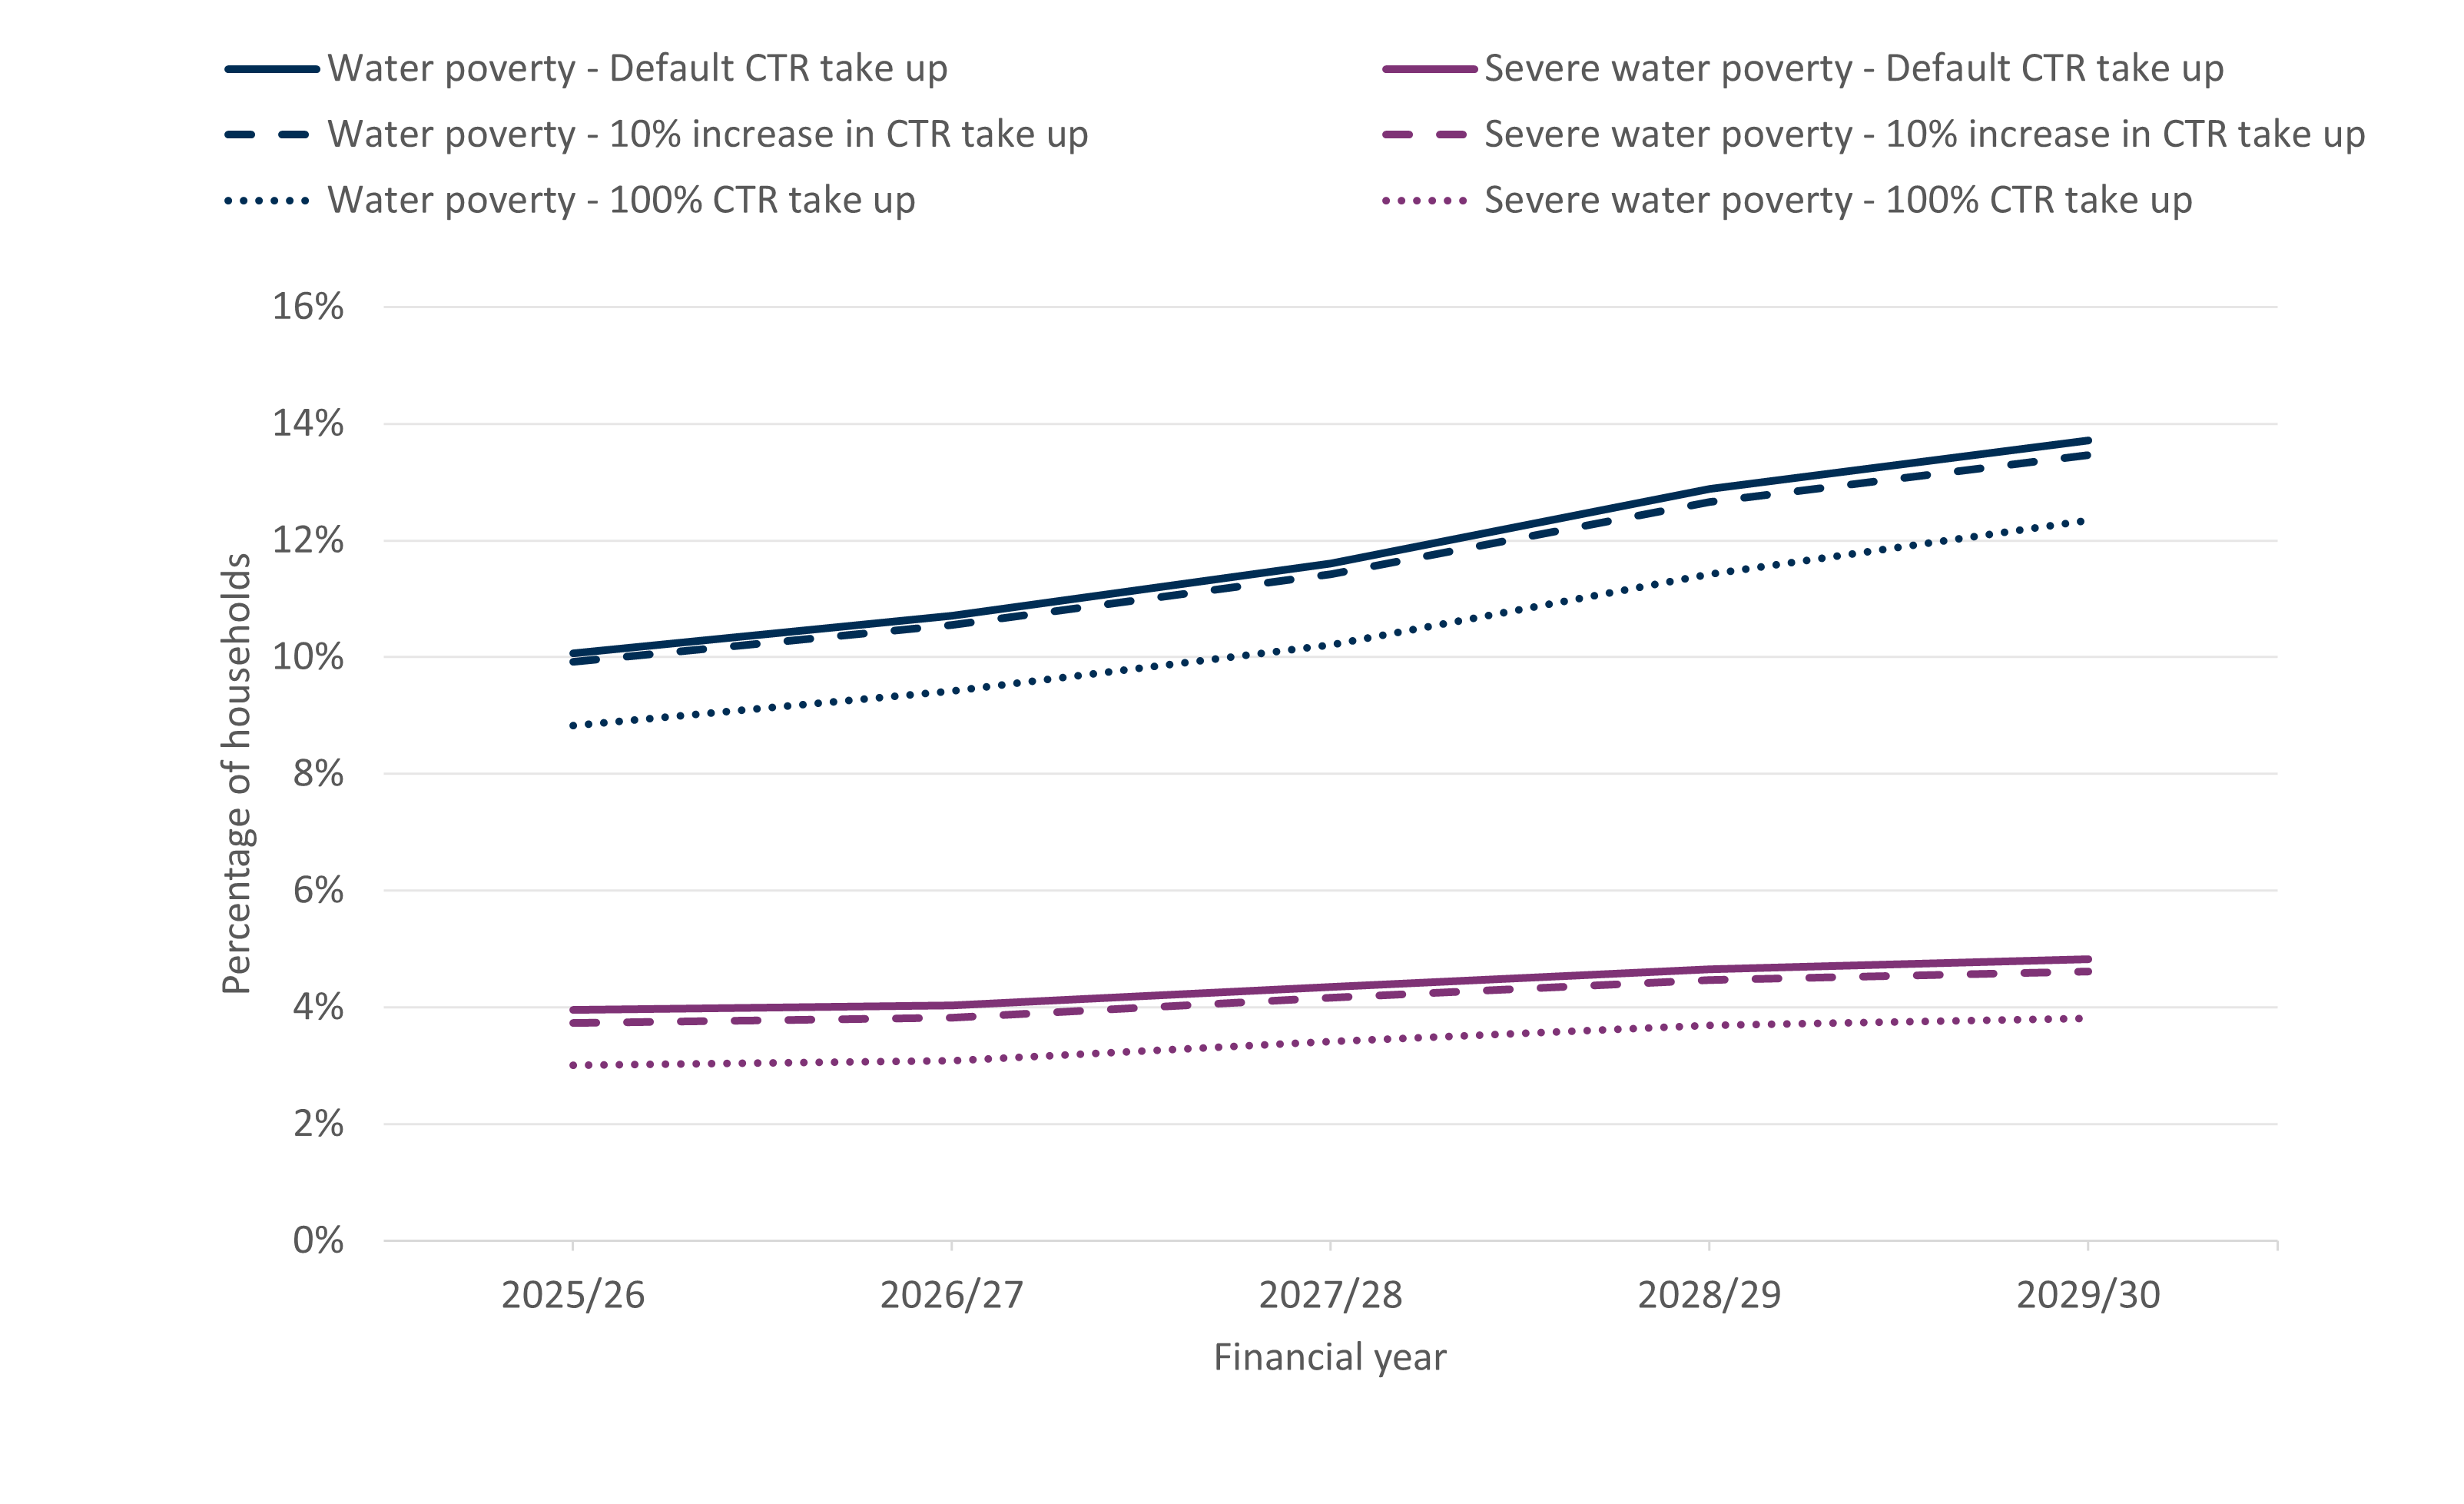
As discussed above, the coverage of CTR – the proportion of households in water poverty who receive it – is relatively low, in part driven by low take-up. It is not necessarily easy to increase take-up rates – this requires addressing issues around lack of awareness and stigma – but it is important to consider what impact an increase in take-up of CTR would have on water poverty.
Our analysis indicates that increasing CTR take-up by 10% – a challenging figure but still some way short of 100% take-up – would reduce water poverty (Chart 5.5). In 2025-2026, water poverty would decline to 9.9% (from 10.1%), and severe water poverty to 3.7% (from 4.0%). However, this analysis does not include the costs of this increased take-up on other bill-payers.
The modest impact on water poverty derives from the fact that around 35,000 households are affected under this scenario, fewer than 2% of all households. Nonetheless, the bill reductions will make a material difference for some of these households.
We also explored an illustrative scenario with a 100% take-up rate to understand its potential impact. Under this scenario, water poverty rates would be considerably lower. For example, in 2025-2026, water poverty would fall to 8.8% (from 10.1%), and severe water poverty would drop to 3.0% (from 4.0%).
This scenario would result in an additional 160,000 households receiving WCRS, a 38% increase in recipients. It would also improve targeting of the reduction, with 51% of households in water poverty receiving it compared to just 25% of those under the default take-up scenario.
Even under full take-up, water poverty is not eradicated, highlighting ongoing targeting challenges.
Chart 5.5: Increasing CTR take-up could reduce water poverty rates
Percentage of households in Scotland spending above 3% or 5% of disposable income on water charges, by CTR take-up (2025-2026 to 2029-2030)
Source: Consumer Scotland analysis of Family Resources Survey via UKMOD. N = 5,662. Note: All analysis assumes a CPI of 2% and water charges of CPI+4% for forecasted years.
The impact of changing the Single Person Discount
Currently, eligible households can receive a 25% reduction in their Council Tax (and water charge) bills through the Single Person Discount (SPD). According to Scottish Water data, approximately 1 million households (37% of all households in Scotland) receive a single person status discount. What would happen if the level of SPD were to change?
There is an interaction between the SPD and WCRS that is important to note when considering this policy option. For households in receipt of SPD and WCRS, reductions in the Single Person Discount will be automatically offset by a corresponding increase in the reduction provided by WCRS.
This is because the 35% maximum bill reduction provided through WCRS is not additional to the 25% SPD. A single person household receiving a 25% status discount and in receipt of full CTR would see their bill reduced by 35% in total – 25% SPD and 10% WCRS. If the SPD were halved to 12.5%, then the household would still see a 35% total discount on their bill, split 12.5% SPD + 22.5% WCRS.
This offsetting feature of the current system means that single person households in receipt of WCRS are effectively protected from reductions in SPD. Unfortunately, however, as our analysis has already demonstrated, there are plenty of single person households in water poverty who do not receive WCRS, and hence would not be cushioned from reductions to SPD.
If the SPD were halved, water poverty would increase by 0.3 percentage points – equivalent to an additional 7,000 households in water poverty (Table 5.2).[19] This would generate an estimated £47 million in additional annual revenue for Scottish Water.
Removing the SPD entirely would increase water poverty by around 0.7 percentage points – equivalent to 20,000 additional households compared to the current 25% level. This scenario would correspond with an increased annual revenue of £88 million.
This suggests that the SPD currently helps to lift around 20,000 households out of water poverty.
Table 5.2: The Single Person Discount lifts 20,000 households out of water poverty
Impact of varying the SPD on water poverty and revenue (2025-2026)
|
|
Baseline (35% WCRS and 25% SPD) |
50% WCRS and halved SPD (12.5%) |
|---|---|---|
|
Water poverty rate (3% threshold) |
10.1% |
9.4% |
|
Severe water poverty rate (5% threshold) |
4.0% |
4.0% |
|
No. of households in water poverty (3% threshold) |
256,000 |
239,000 |
|
No. of WCRS recipients |
426,000 |
454,000 |
|
No. of SPD recipients |
946,000 |
946,000 |
|
Total annual revenue (£m) |
£1,315 |
£1,335 |
Source: Consumer Scotland analysis of Family Resources Survey via UKMOD. N = 5,662.
The impact of changing WCRS and SPD simultaneously
So far, we have examined the effects on water poverty when either the Water Charges Reduction Scheme or Single Person Discount were to change. In previous scenarios, increases in WCRS were funded by redistributing costs across water charges, maintaining overall revenue levels. But what if the increased WCRS were instead funded by reducing SPD?
A 50% WCRS could be (slightly more than) funded by halving SPD. For no loss in revenue, this would reduce water poverty from 10.1% to 9.4% (in 2025-2026). However, severe water poverty rates would remain at a similar level to the baseline (Table 5.3, Chart 5.6)
Table 5.3: Increasing the WCRS to 50% could be funded by reducing SPD
Impact of varying the WCRS and SPD on water poverty and revenue (2025-2026)
|
Baseline (35% WCRS and 25% SPD) |
50% WCRS and halved SPD (12.5%) | |
|---|---|---|
| Water poverty rate (3% threshold) |
10.1% |
9.4% |
| Severe water poverty rate (5% threshold) |
4.0% |
4.0% |
| No. of households in water poverty (3% threshold) |
256,000 |
239,000 |
| No. of WCRS recipients |
426,000 |
454,000 |
| No. of SPD recipients |
946,000 |
946,000 |
| Total annual revenue (£m) |
£1,315 |
£1,335 |
Source: Consumer Scotland analysis of Family Resources Survey via UKMOD. N = 5,662.
Chart 5.6: Increasing the WCRS to 50% and halving the Single Person Discount would reduce the water poverty rate
Percentage of households in Scotland spending above 3% or 5% of disposable income on water charges, under the baseline policy scenario and a policy to increase in the WCRS but reduce the Single Person Discount (2025-2026 to 2029-2030)
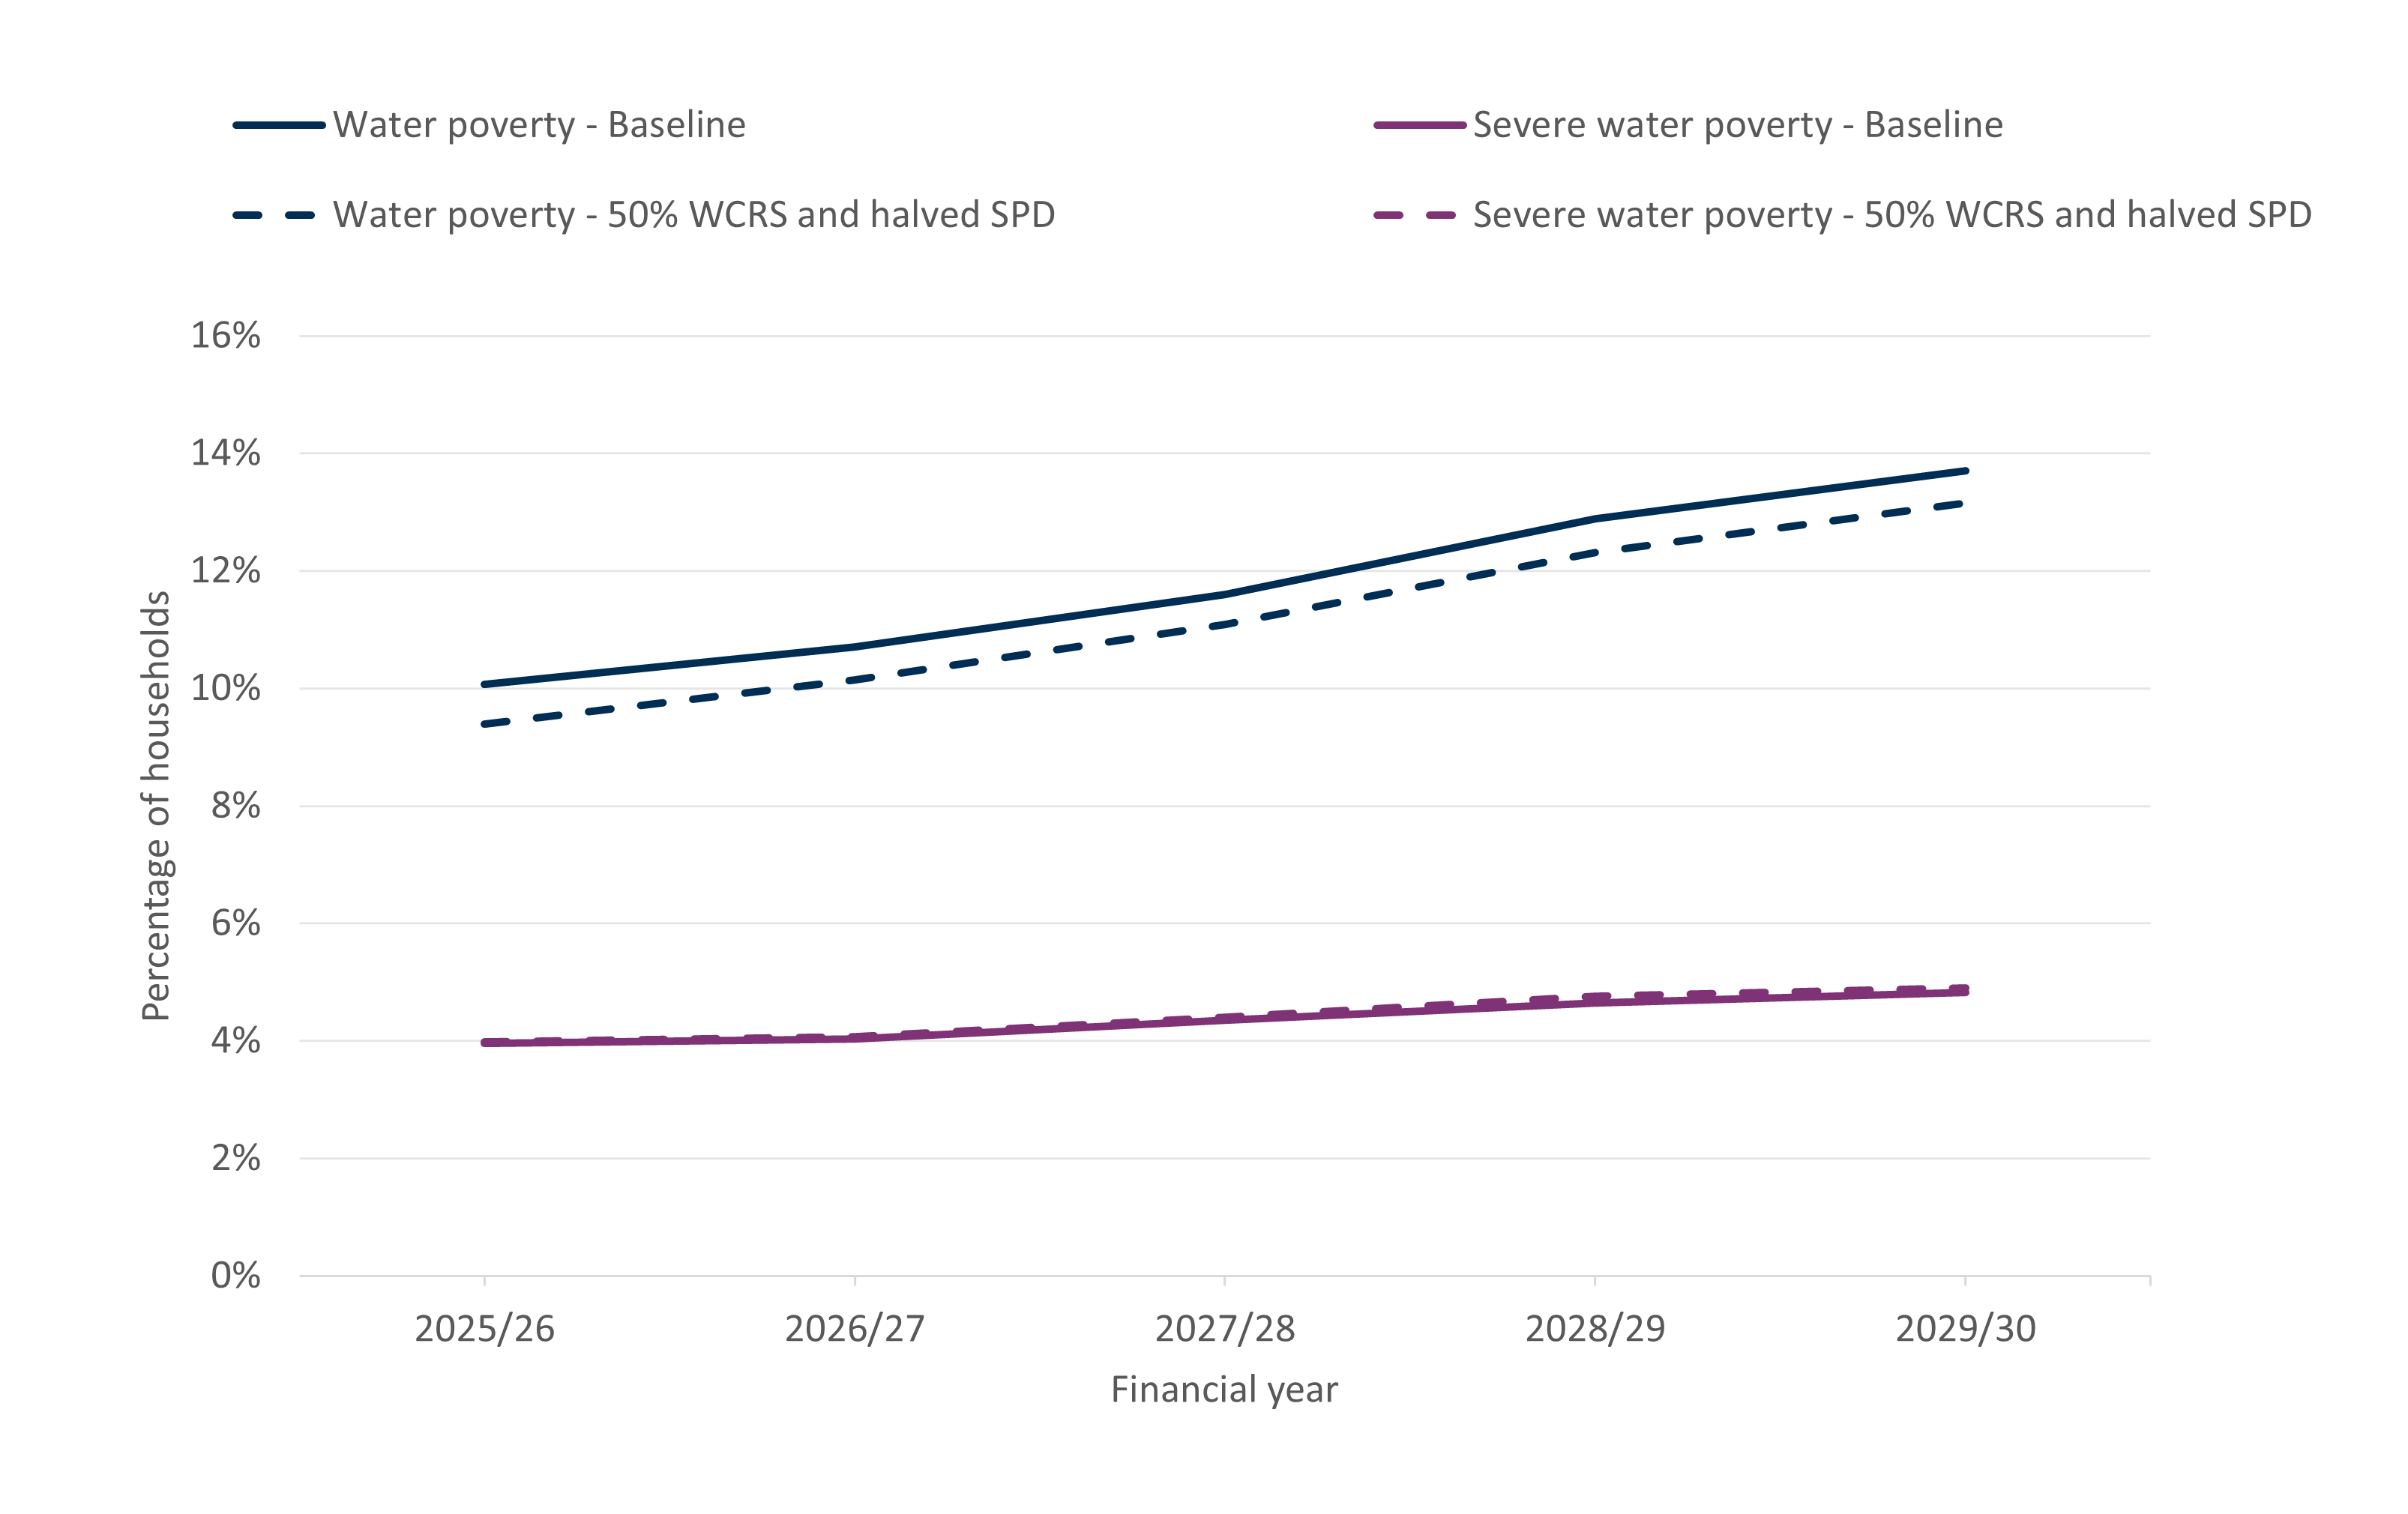
Source: Consumer Scotland analysis of Family Resources Survey via UKMOD. N = 5,662. Note: All analysis assumes a CPI of 2% and water charges of CPI+4% for forecasted years.
Distributional analysis
Up until now we have been considering the impacts of policy change on rates of water poverty and severe water poverty specifically. These are important metrics, but it is also informative to examine the distribution of benefits and costs more generally – in other words, who gains and who loses from these policy proposals?
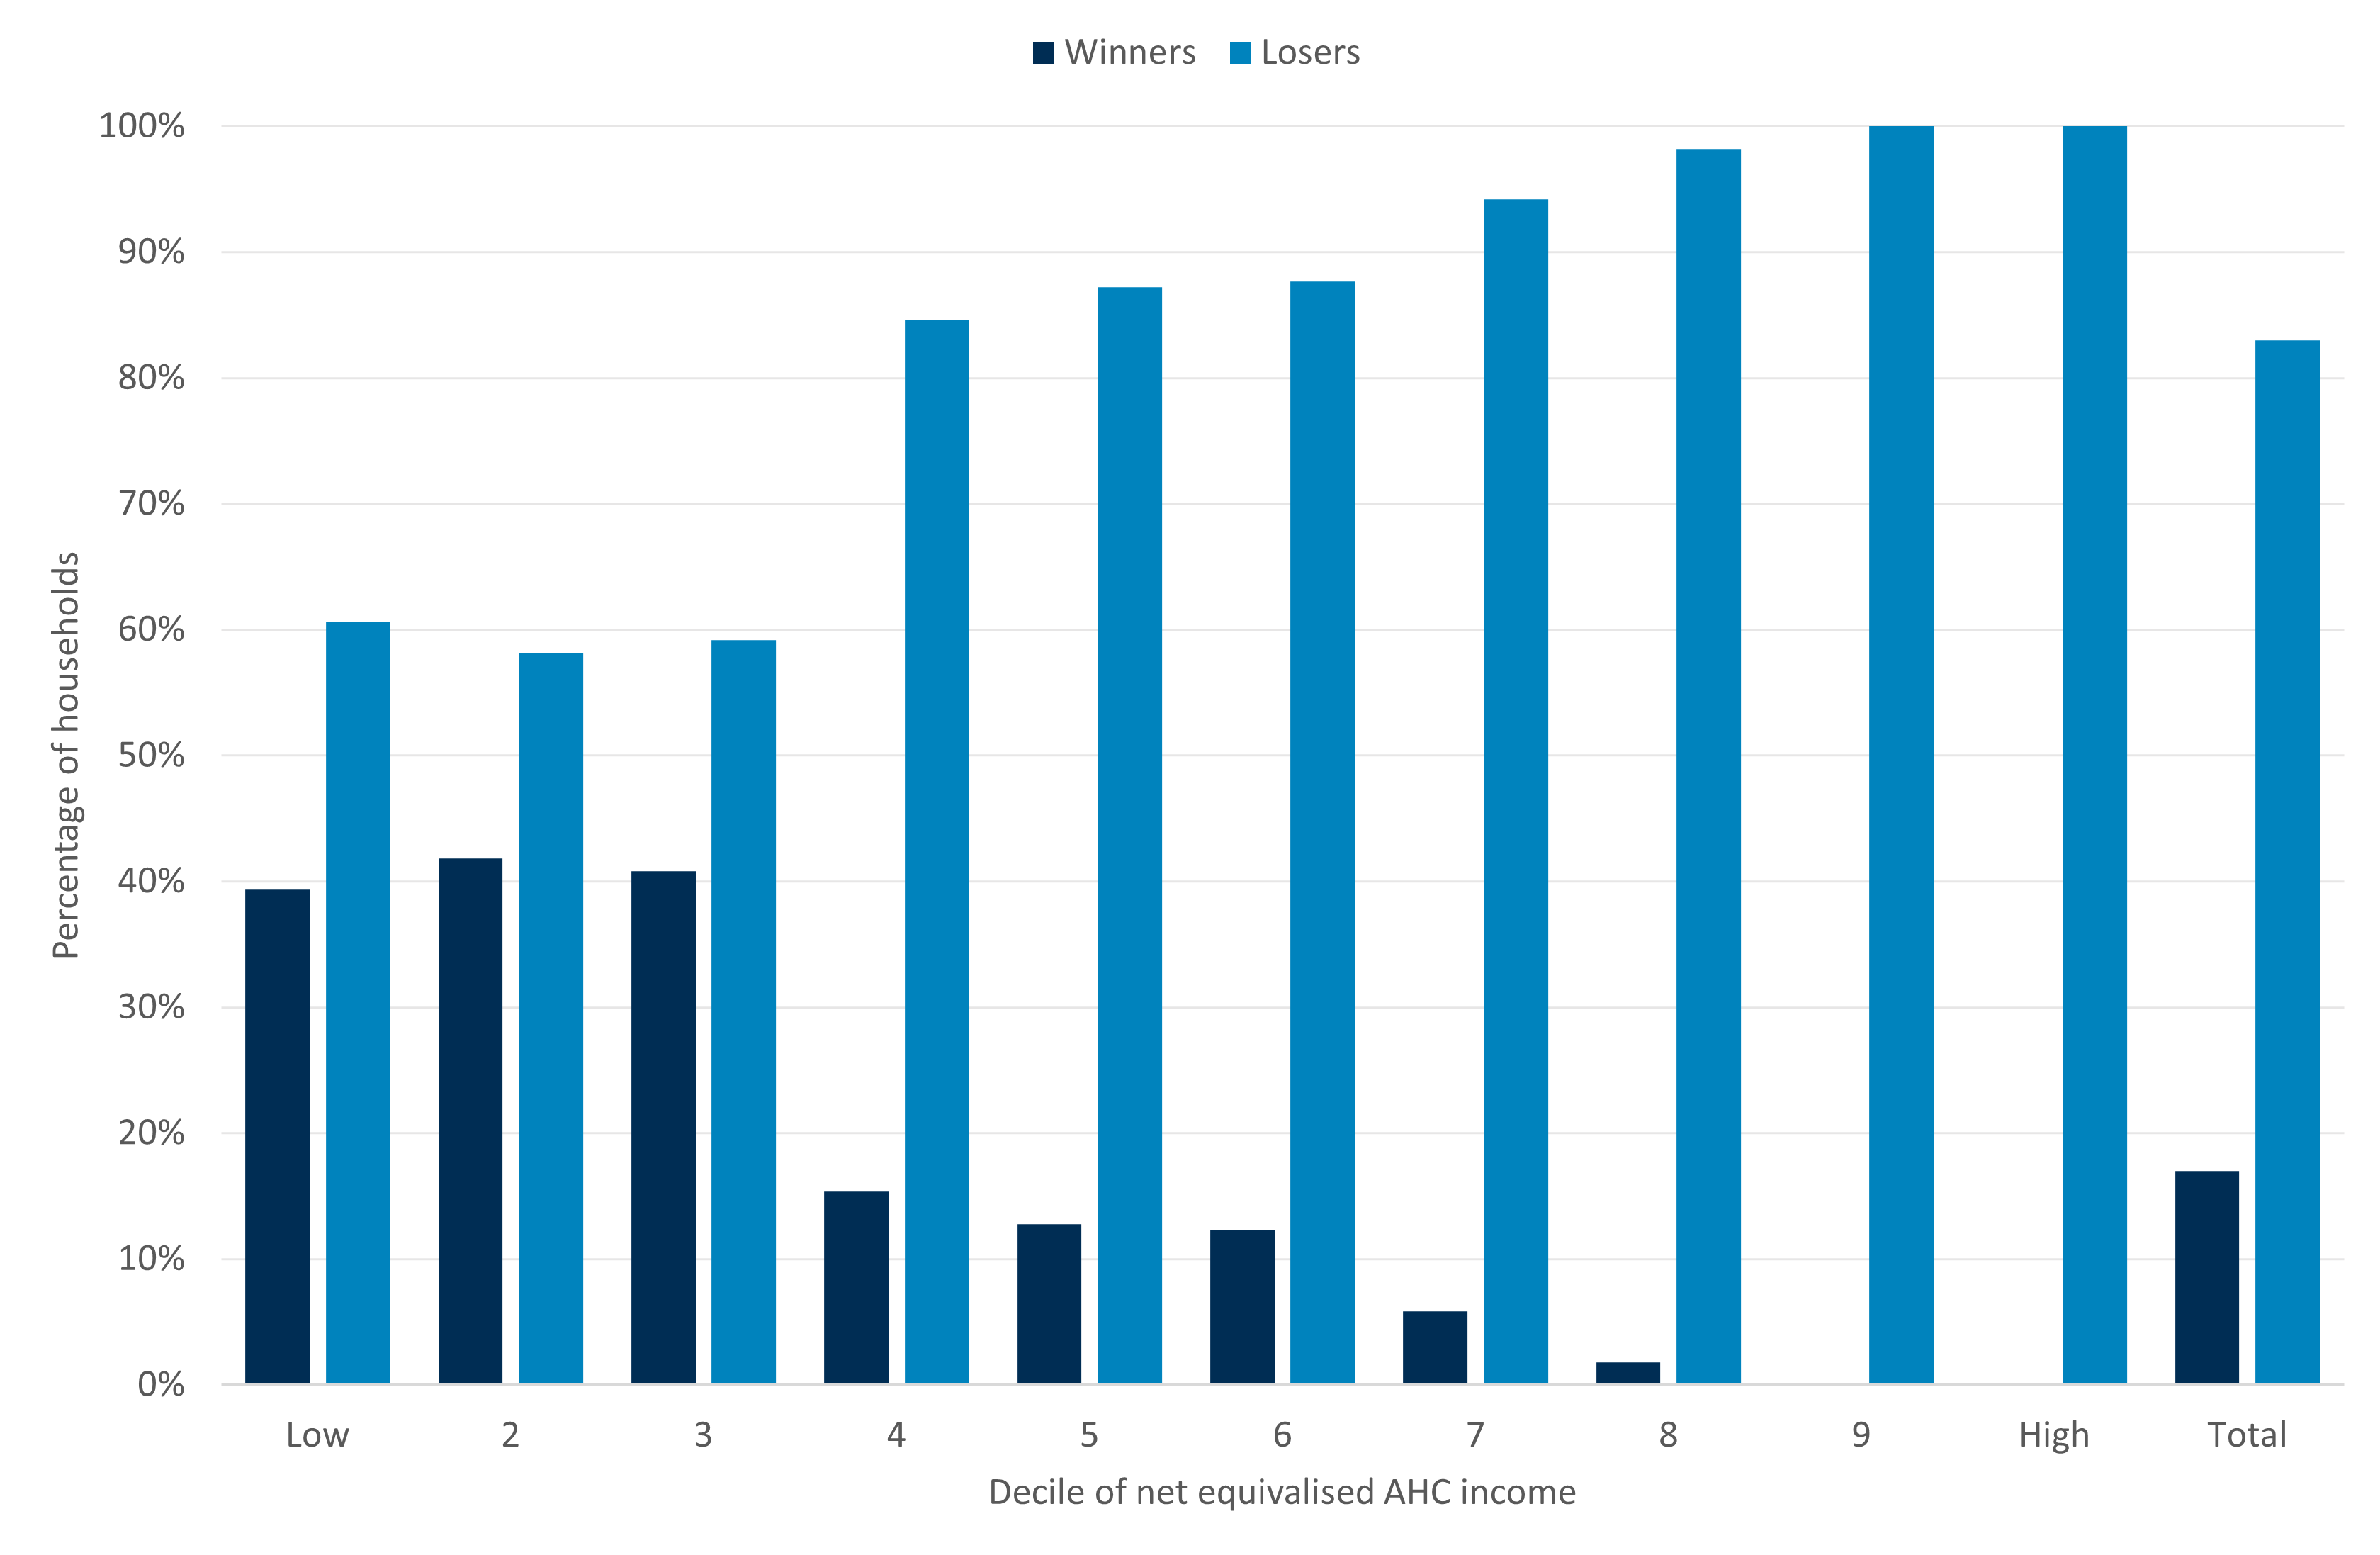
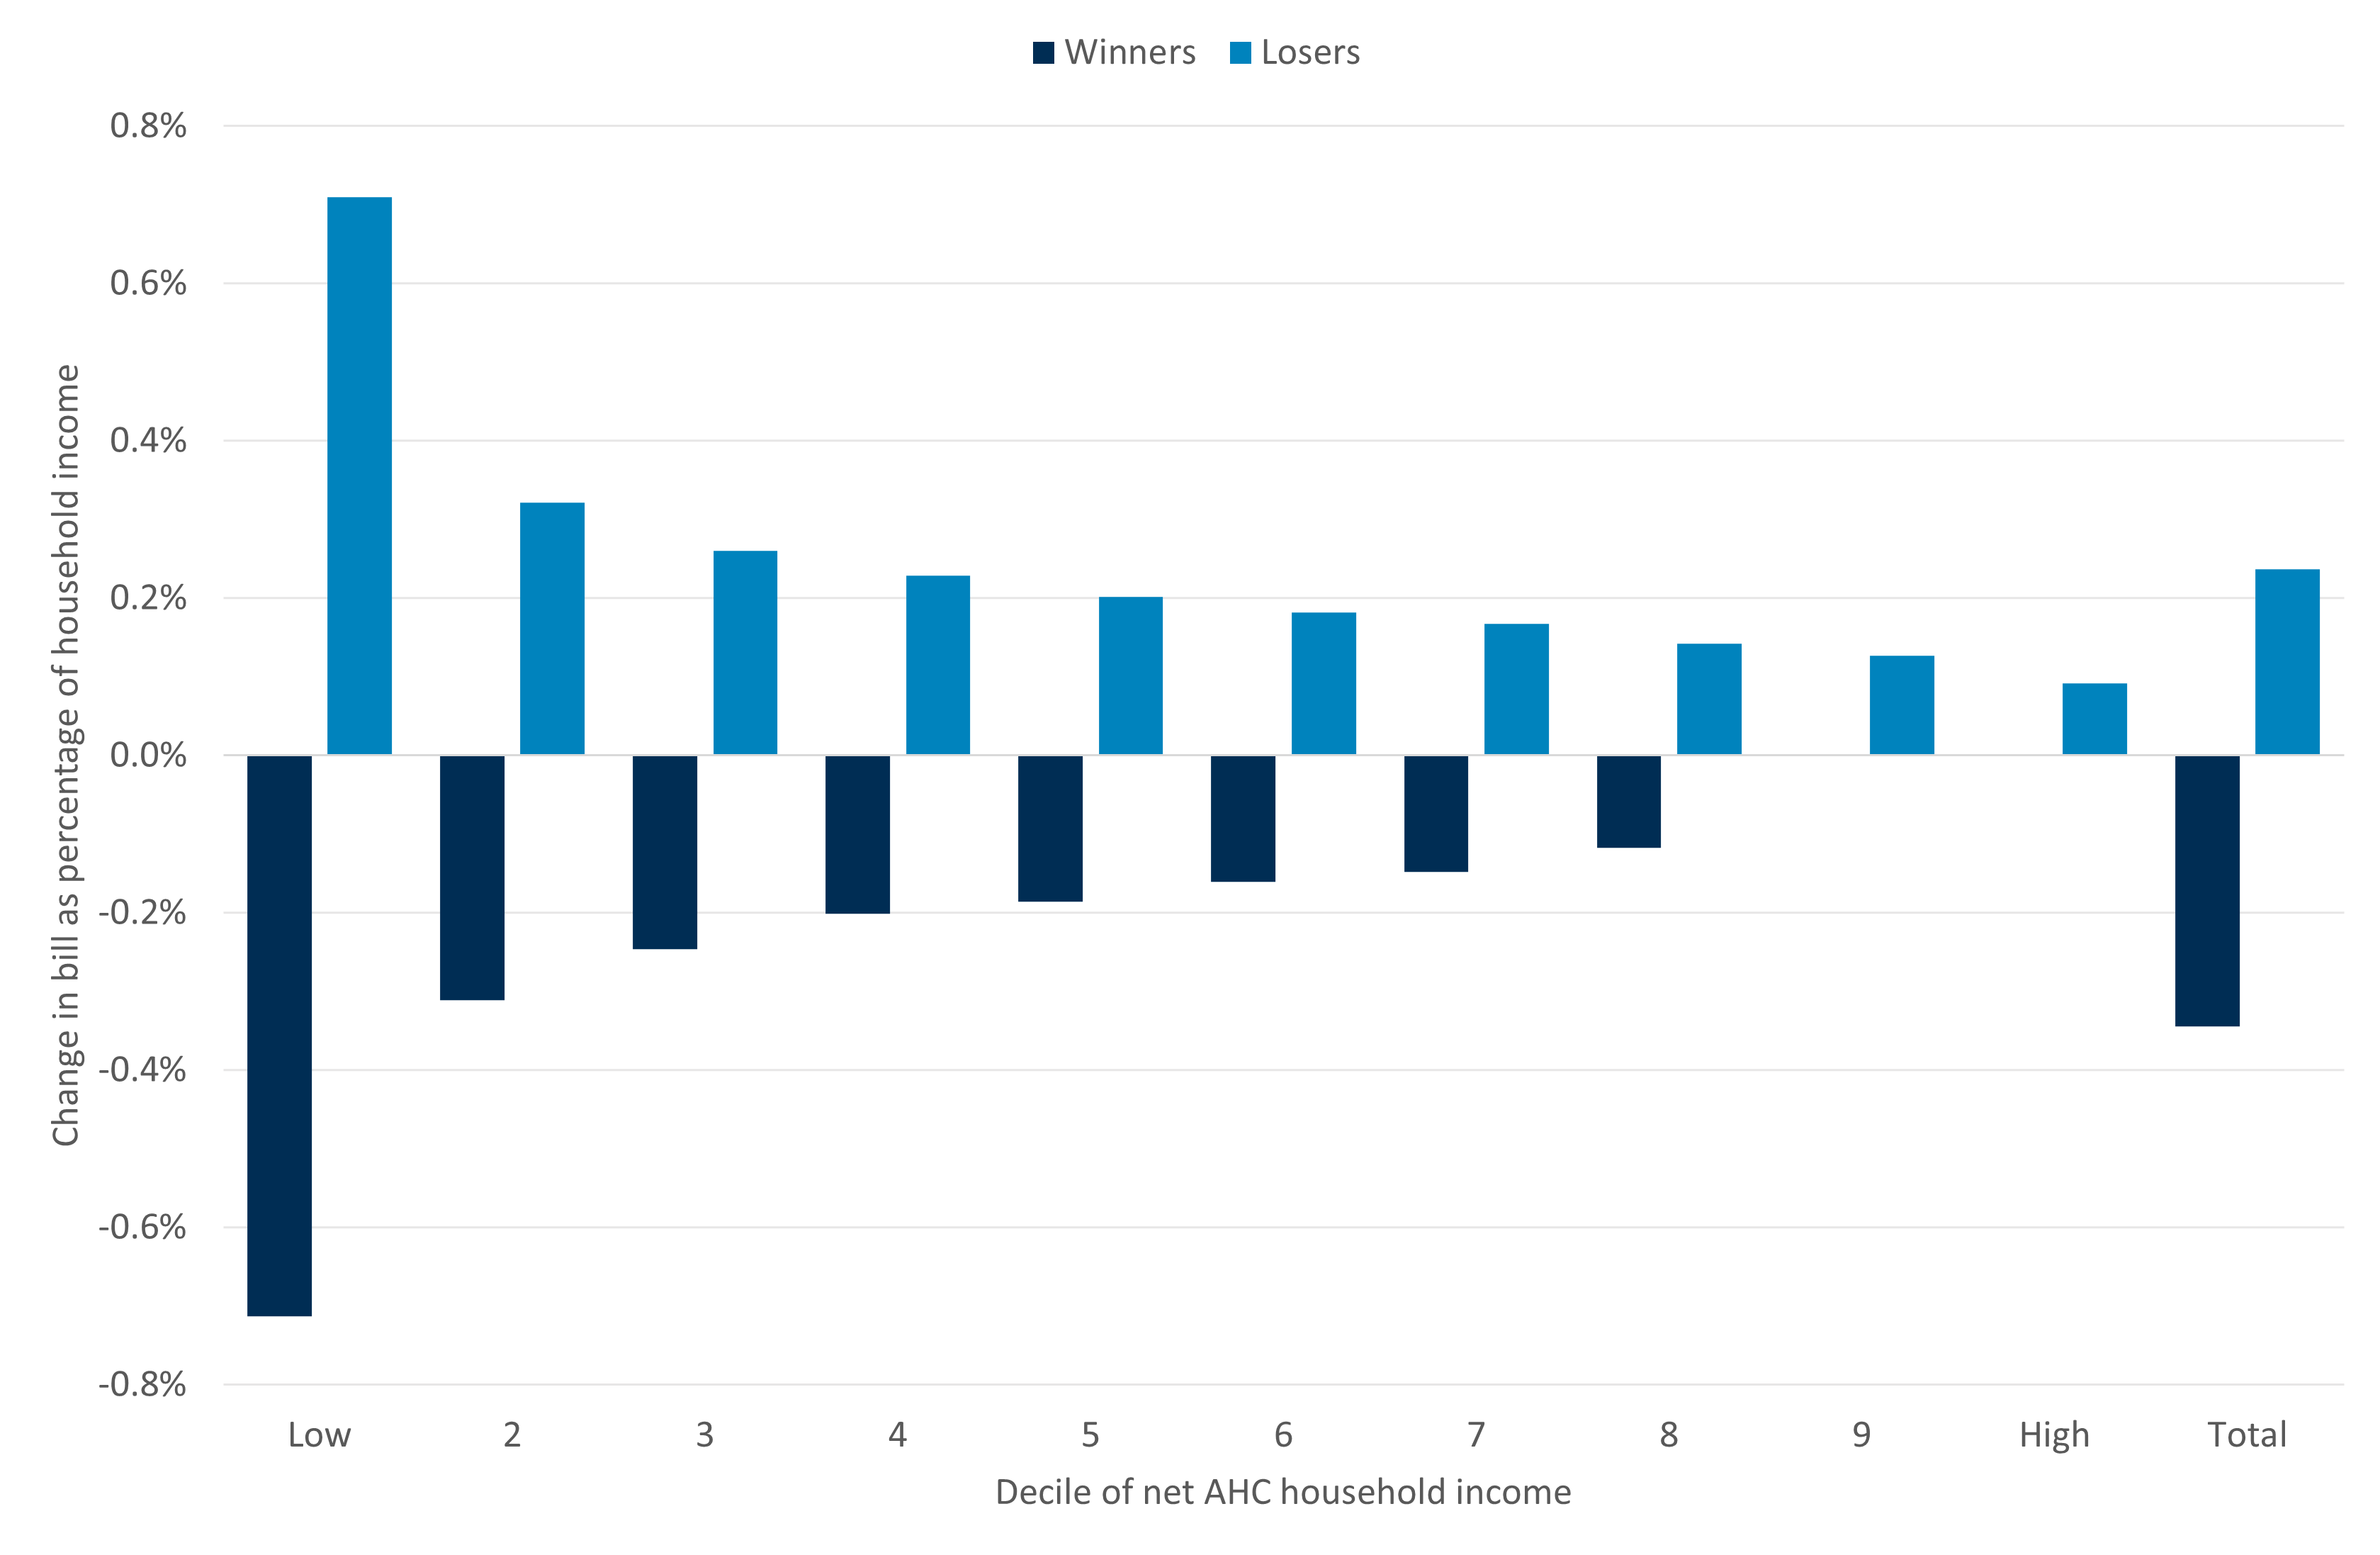
For the policy to increase WCRS to 50%, funded by a general increase in all bills, Chart 5.7 shows the distribution of ‘winners’ (those whose bills would be lower under the policy scenario) and ‘losers’ (those whose bills would be higher under the policy scenario across the income distribution. The ‘winners’ from this policy are those in receipt of WCRS – who are largely found in the lower third of the income distribution. All other households are ‘losers’ – in the sense that their bills increase to fund the increase in WCRS.
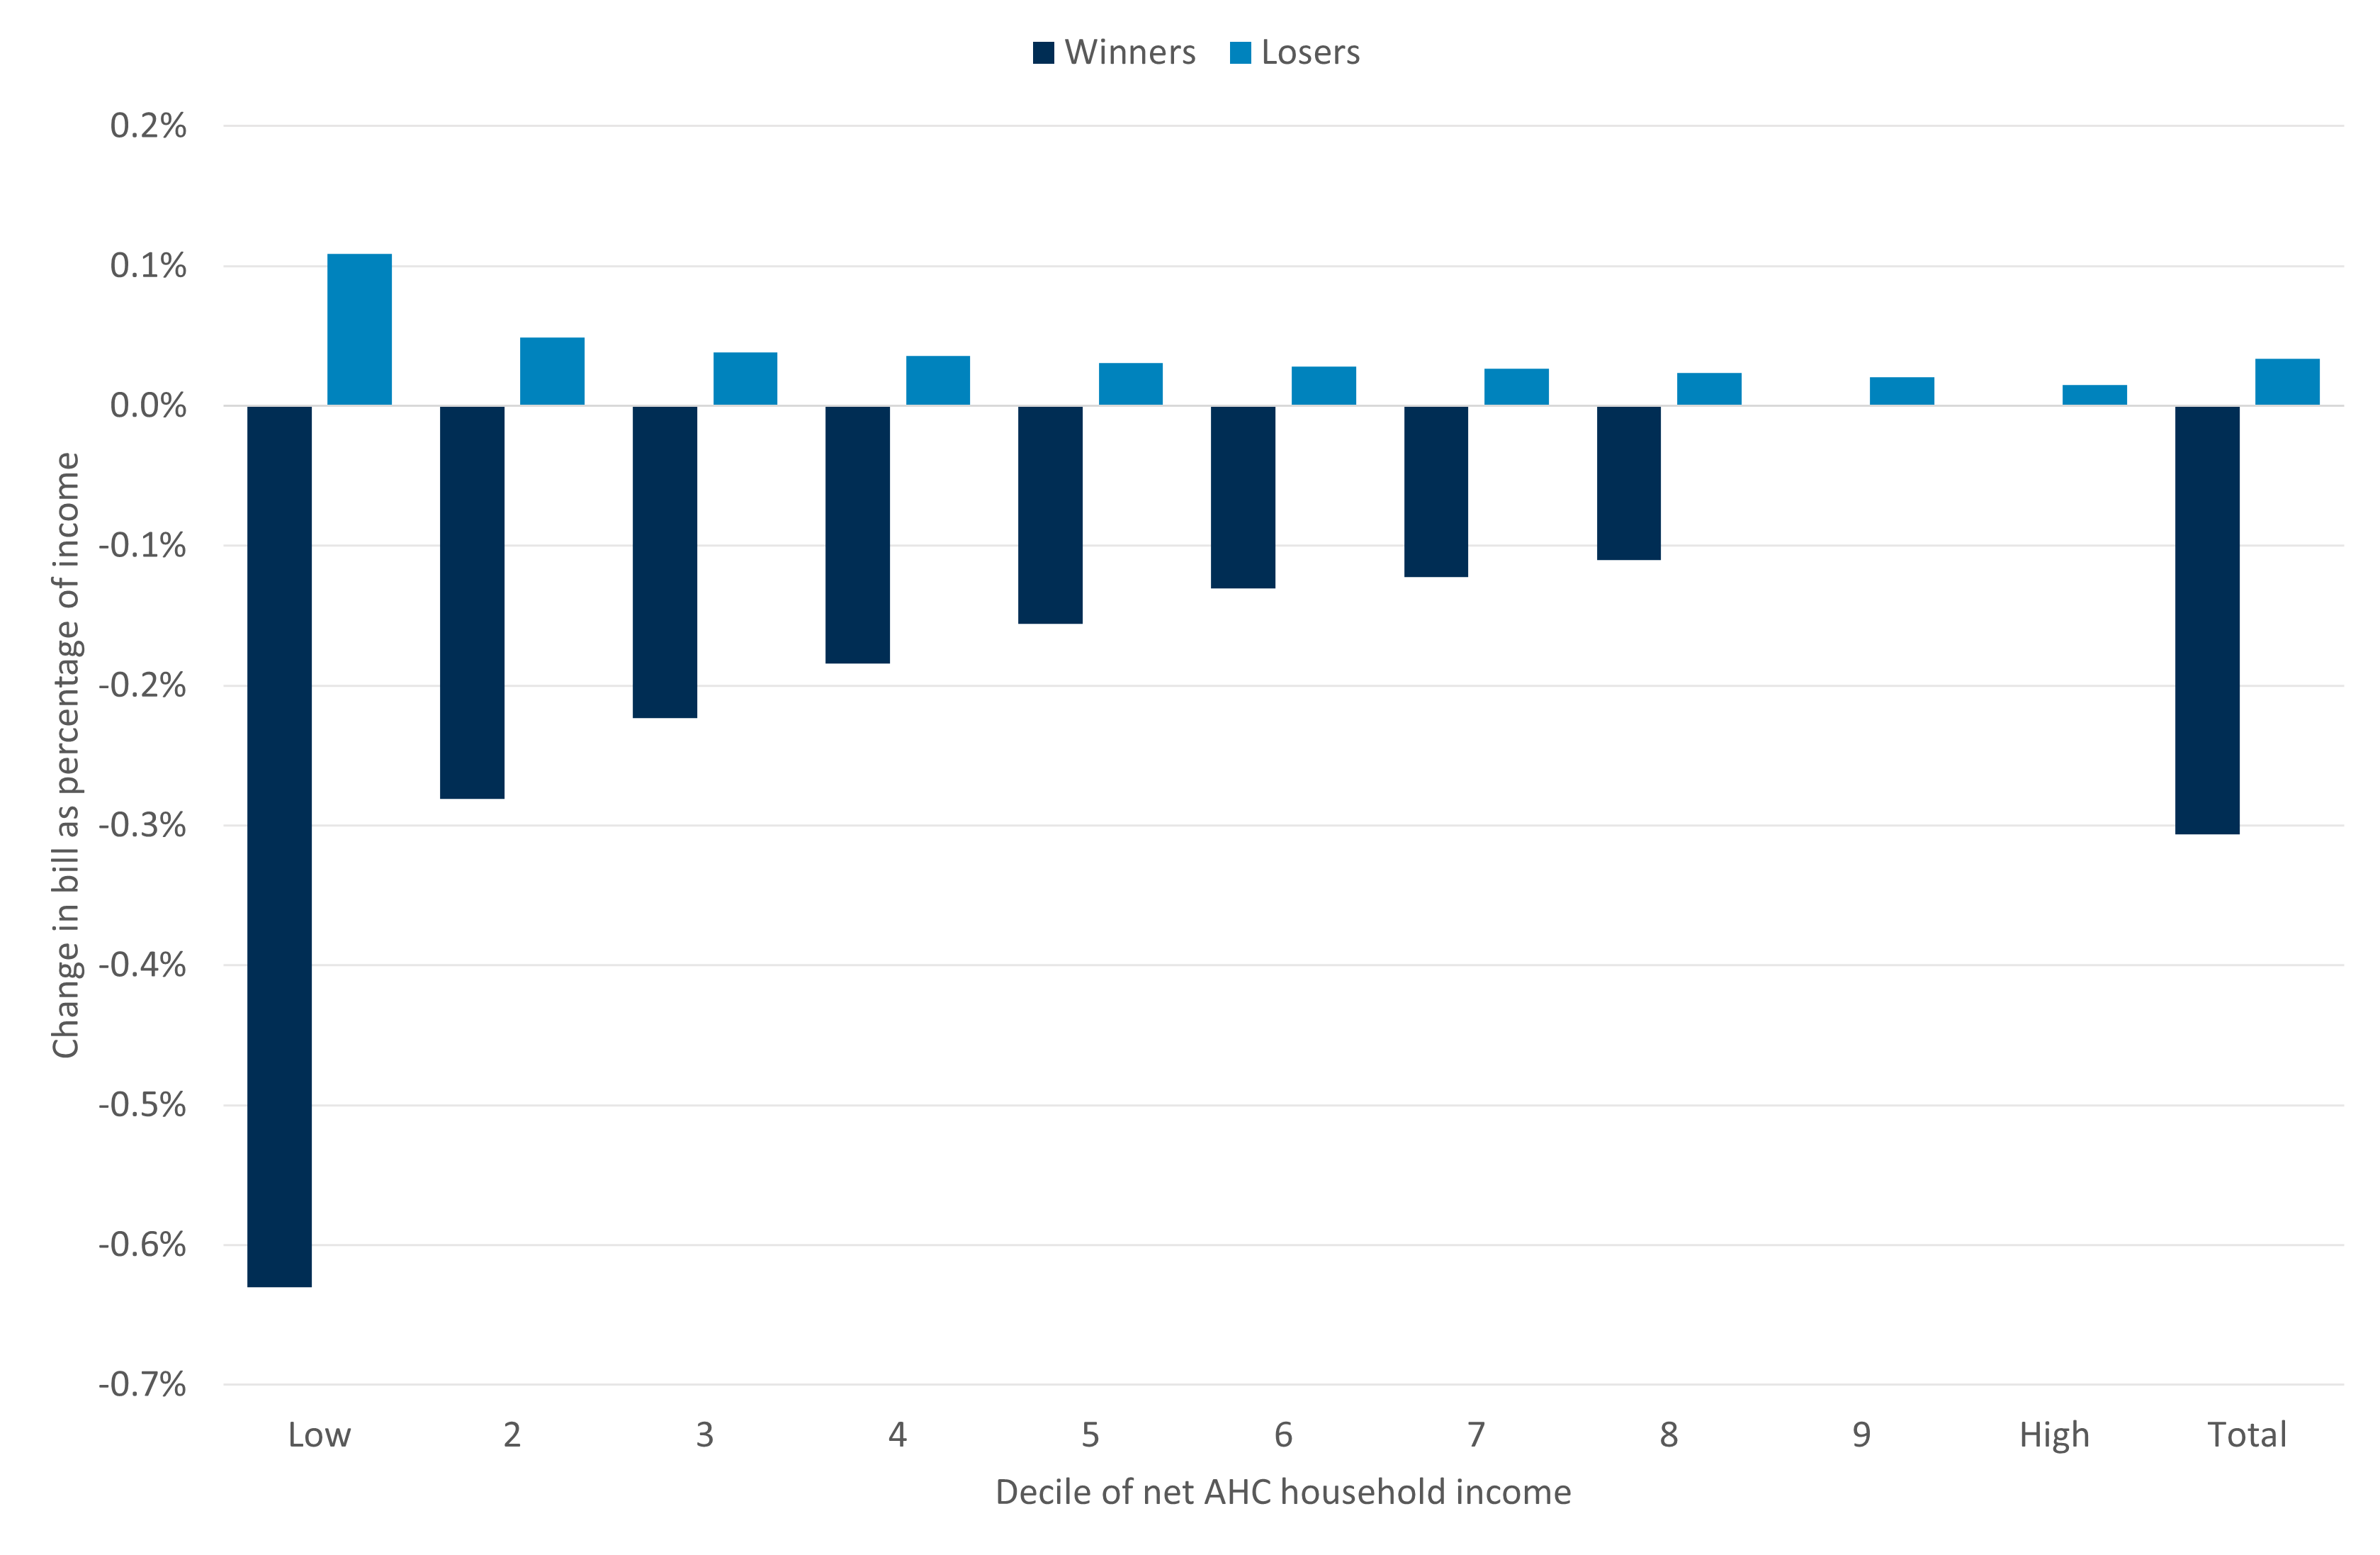
As well as considering the number of ‘winners’ and ‘losers’, it is also important to consider the value of financial gains and losses for the two groups. Chart 5.8 shows that ‘winners’ see their bills fall proportionately more than ‘losers’ see their bills rise. More importantly, the size of the gains is much more significant for low income households than it is for middle and high income households.
Chart 5.7: Increasing the WCRS to 50% (funded through general bill increases) mainly benefits households in the lower third of the income distribution
Percentage of households seeing their bills decrease (winners) and increase (losers) by decile of household income
Source: Consumer Scotland analysis of Family Resources Survey via UKMOD. N = 5,662. Note: All analysis assumes a CPI of 2% and water charges of CPI+4% in year 2026/27.
Chart 5.8: The beneficiaries of increasing WCRS to 50% (funded through general bill increases) gain more as a percentage of income than those who lose
Change in water bill as a percentage of household income for each decile of household income
Source: Consumer Scotland analysis of Family Resources Survey via UKMOD. N = 5,662. Note: All analysis assumes a CPI of 2% and water charges of CPI+4% in year 2026/27.
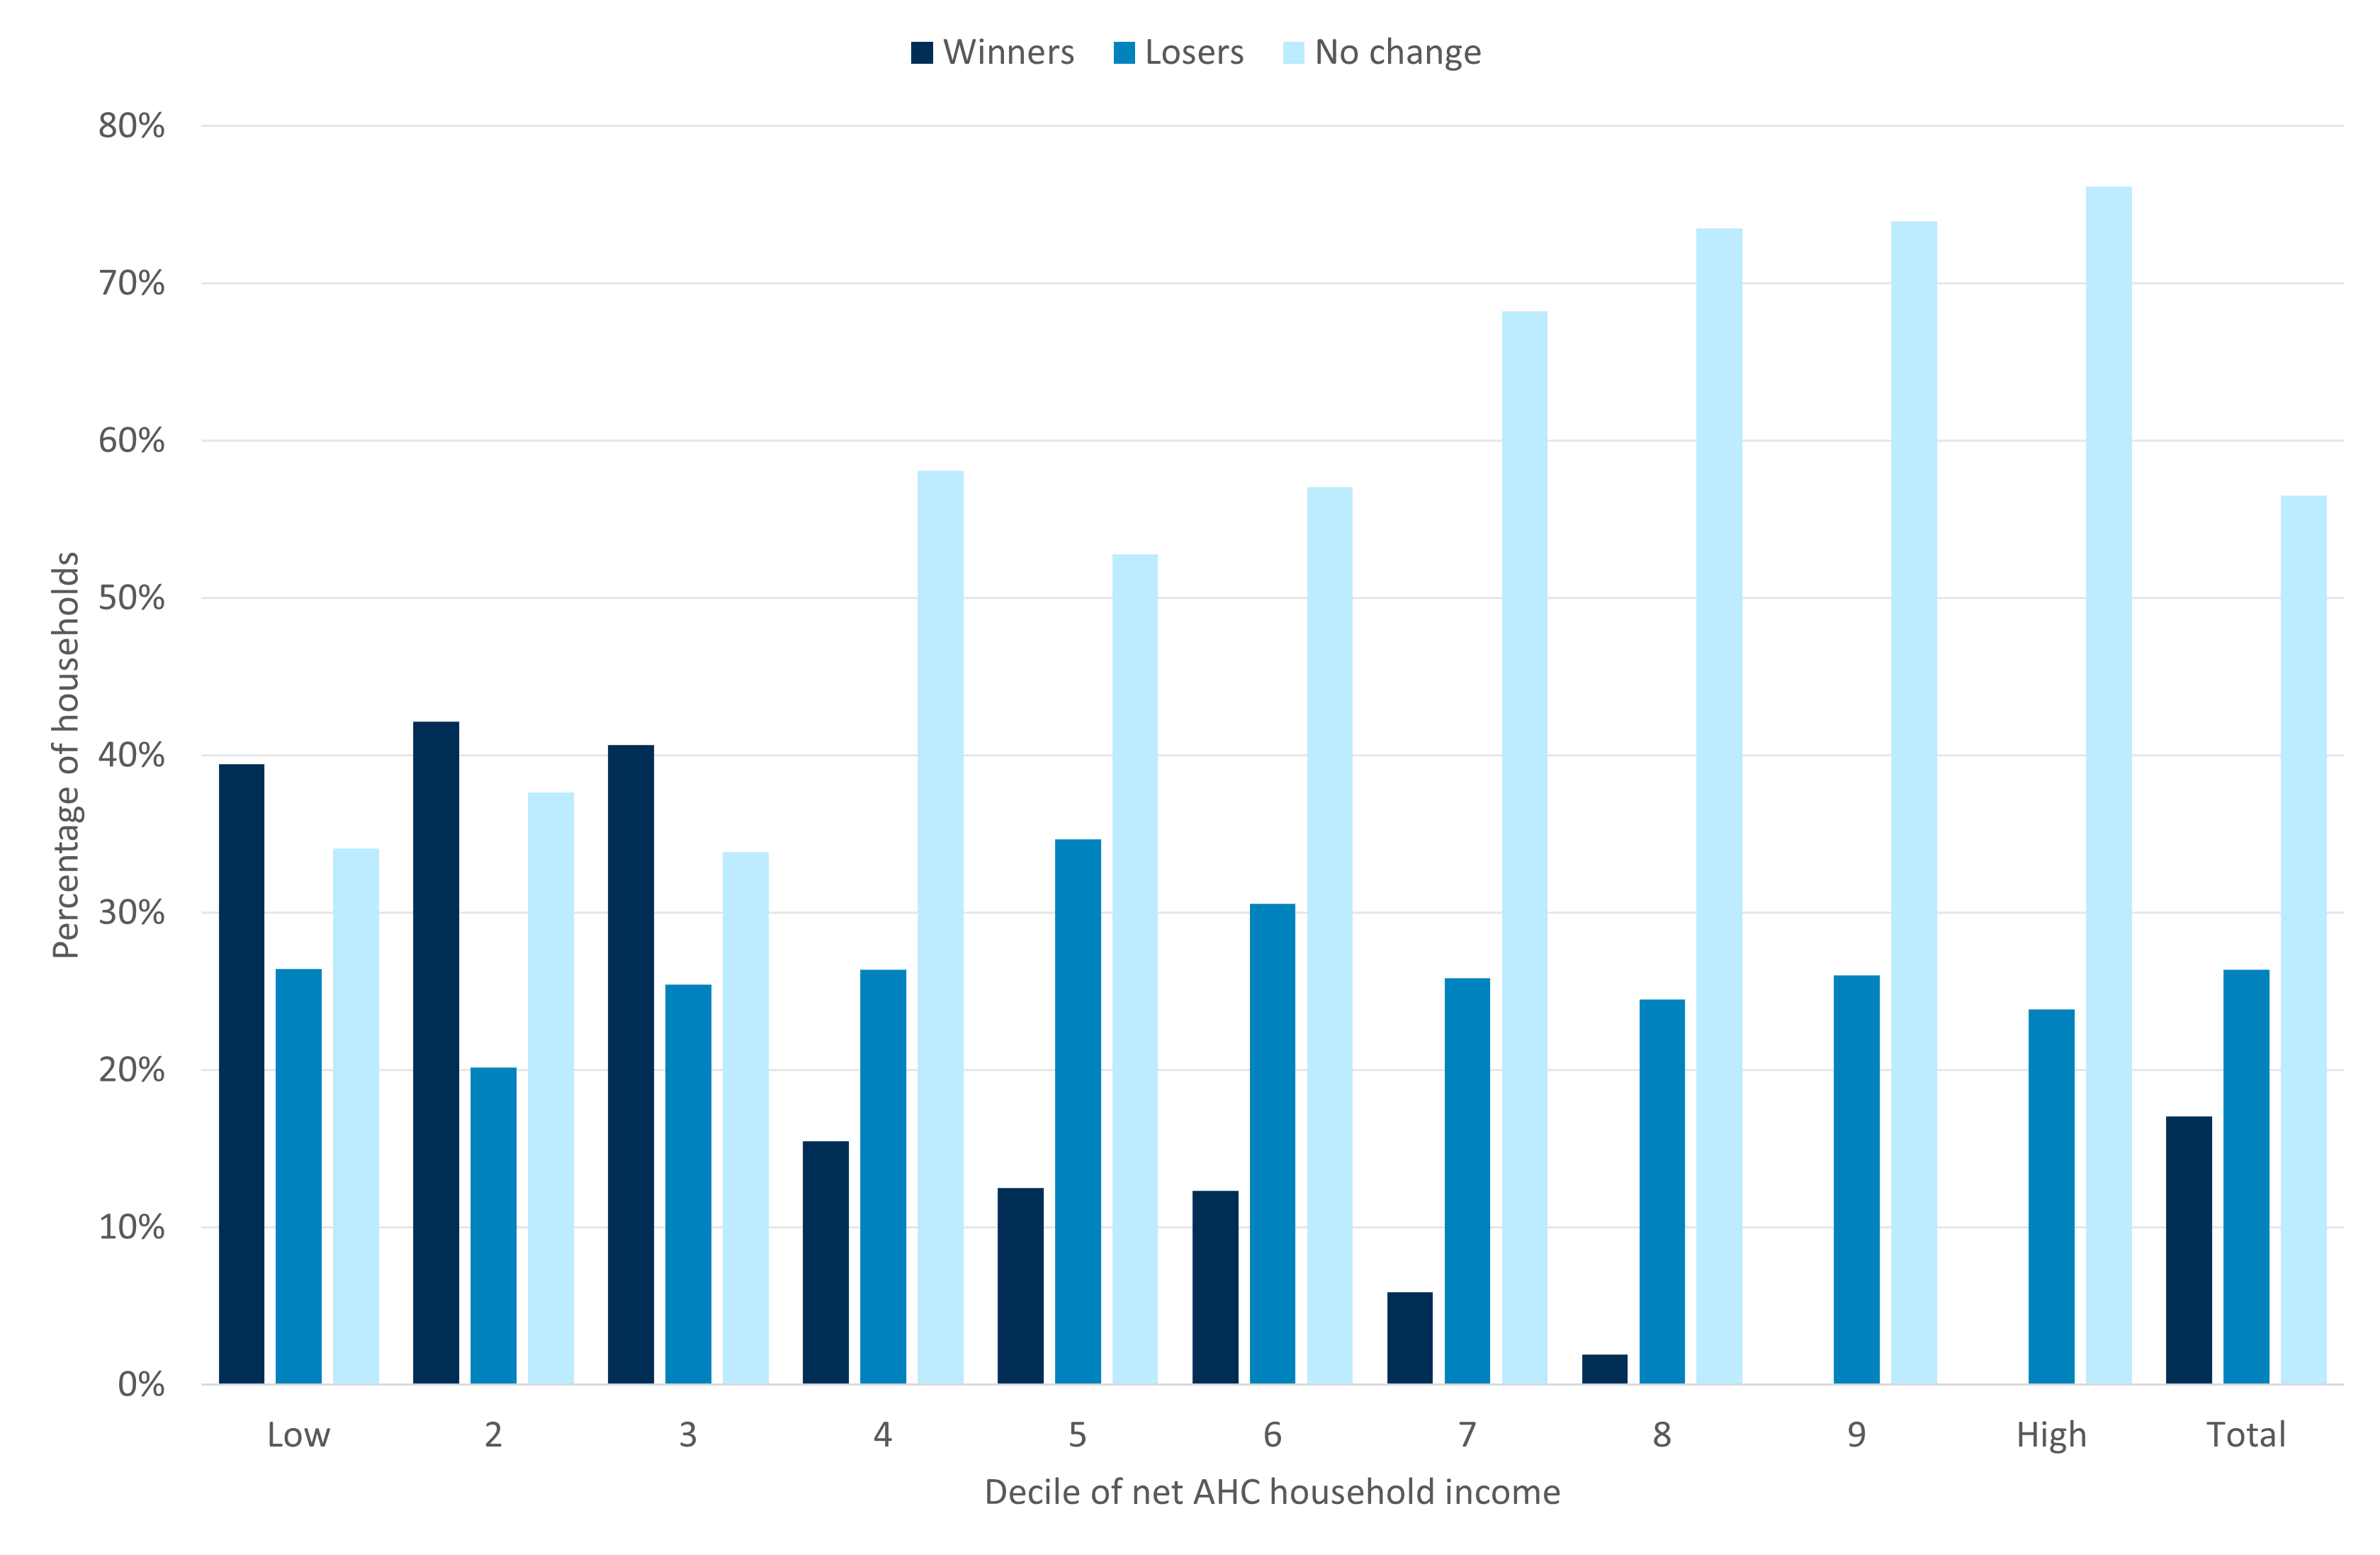
Chart 5.9 and Chart 5.10 show the same information, but for a policy where the increase in WCRS is funded through a halving of SPD. The distribution of ‘winners’ is the same as previously. There are fewer ‘losers’, since the policy is funded by single person households only, although it is still the case that one quarter of households are losers. Most households (56%) neither gain nor lose.
Because of this however, the ‘losers’ each see their bills increase proportionately more than was the case under the scenario where bills are funded across all bill payers. Moreover, the burden falls particularly heavily on single person households in the lowest income deciles.
Chart 5.9: Increasing the WCRS to 50% (funded through cuts to Single Person Discount) creates as many losers as winners; although the winners are more likely to have low income
Percentage of households seeing their bills decrease (winners) and increase (losers) by decile of household income
Source: Consumer Scotland analysis of Family Resources Survey via UKMOD. N = 5,662. Note: All analysis assumes a CPI of 2% and water charges of CPI+4% in year 2026/27.
Chart 5.10: Increasing the WCRS to 50% (funded through cuts to Single Person Discount) benefits some low income households but costs others
Percentage of households seeing their bills decrease (winners) and increase (losers) by decile of household income – under a policy to fund an increase in WCRS to 50% through a halving of Single Person Discount
Source: Consumer Scotland analysis of Family Resources Survey via UKMOD. N = 5,662. Note: All analysis assumes a CPI of 2% and water charges of CPI+4% in year 2026/27.
8. Conclusion
The outlook for water affordability
Water and sewerage charges in Scotland are set to increase significantly above inflation during the SR27 period (2027-2028 to 2032-2033). Whilst the specific outlook for bill increases is still to be determined, bill increases will almost certainly outstrip the growth of household incomes. Water bills will there inevitably increase as a percentage of income for all households.
In assessing the impact of these bill increases on the affordability of bills, it makes sense to focus on the households which are likely to face the biggest affordability challenges as a result of these increases – i.e., the households for whom water charges represent the largest proportion of household income.
This report has examined the affordability of water and sewerage charges using a well-established measure of water poverty, based on the proportion of households’ disposable income spent on water and sewerage.
The analysis reveals that rates of water poverty in Scotland are on course to increase over the SR27 period. The extent of these increases will depend on both the level of increase in charges, and the real growth in household income.
If bills were to increase by four percentage points above inflation each year, it is likely that water poverty rates would, within the first three years of the SR27 period, have reached levels not seen in Scotland for 20 years.
The impacts of policy change
Increasing the WCRS to 50%, from its current 35%, would offset the real terms impact on bills for the households that receive it. The WCRS recipient households are not all in water poverty, but are almost entirely in the lower third of the income distribution.
The policy would have limited impacts in offsetting the rise in water poverty. This is mainly because of limited coverage of the WCRS amongst households in water poverty – itself reflecting less than full take-up, and less than perfect targeting. But it is also because of the assumption that increases in the WCRS would need to be funded through increases in bills elsewhere in the domestic system. An increase in the WCRS to 50% would around around two percentage points to bills (in the context of a proposed real terms increase of over 26% over the six year period of the next Strategic Review period).
An increase in the WCRS from 35% to 50% would reduce water poverty by 0.7 percentage points, equivalent to about 18,000 households, if it were funded by an increase in bills generally. It would reduce water poverty by two percentage points, equivalent to over 50,000 households, if funded ‘externally’ (i.e. without cross subsidisation amongst consumer bills).
The imperfection of the targeting mechanism is not unique to the water market. Similar (if not quite as pronounced) issues occur when trying to provide financial support to households in child poverty, or to households in fuel poverty.
Recommendations
Whilst increases in the WCRS cannot mitigate the forthcoming rise in water poverty, there is nonetheless a strong case for it to increase to 50%. This level of increase would protect recipient households from real terms bill rises during the next Strategic Review period. And whilst the recipients of WCRS are not all households in water poverty, nearly all recipient households in the lower part of the income distribution, and so are amongst those most likely to be struggling.
Recommendation 1: Consumer Scotland recommends to the Scottish Government that the WCRS is increased to 50% in SR27. The policy would offset the impact of real terms bill increases for over 400,000 households, most of whom are in the lower part of the income distribution.
But this policy leaves many households at risk of water poverty who do not qualify for or receive WCRS. There is a case for developing a water hardship fund which could provide support for families with incomes below the thresholds for water poverty and who do not qualify for WCRS.
Recommendation 2: Consumer Scotland recommends the establishment of a water hardship fund. The fund could provide support for families with incomes below the thresholds for water poverty but who do not qualify for WCRS. There might be different models for distributing this, which could include by referral through organisations such as Citizens Advice Bureau or Advice Direct Scotland
Actions beyond SR27
In the longer term, policy should move toward a fairer and more targeted charging system. However, given the constraints of the 2027-2033 period, fundamental reform is unlikely to be feasible. Improvements to affordability policy must therefore be pragmatic and workable within the existing system. An enhanced WCRS, supplemented by a ‘by-application’ safety net, represents a practical and impactful approach worthy of serious consideration.
Recommendation 3: During SR27, the Scottish Government and Scottish Water should undertake further work to identify suitable mechanisms to improve the automatic targeting of affordability support in the following charging period. A new scheme of affordability support, that more effectively targets water poverty, should be introduced by the start of the 2033 regulatory period.
9. Endnotes
[2] Affordability of water and sewerage charges: The outlook for water poverty in Scotland | Consumer Scotland
[3] For full breakdown, see: Unmetered Charges 2025-26 - Scottish Water
[4] Throughout this report, when we refer to ‘water charges’ this includes both water and sewerage charges
[6] If all occupiers are disregarded, then there is a 50% reduction in bill
[7] For examples of this approach, see Bradshaw and Huby (2013) for application to England and Wales Water poverty in England and Wales in: Journal of Poverty and Social Justice Volume 21 Issue 2 (2013) (bristoluniversitypressdigital.com), and more recently Consumer Council for Water (2021). Independent Review of Water Affordability. Consumer Council for Water, Birmingham, UK.
[8] See Fraser of Allander Institute (2019) and Fraser of Allander Institute (2020)
[9] Sylvester et al. (2023) Water poverty in England and Wales in: Journal of Poverty and Social Justice Volume 21 Issue 2 (2013) (bristoluniversitypressdigital.com)
[12] Richiardi M, Collado D, Popova D (2021). UKMOD – A new tax-benefit model for the four nations of the UK. International Journal of Microsimulation, 14(1): 92-101. DOI: 10.34196/IJM.00231.
[13] UKMOD is a static tax-benefit microsimulation model. It uses FRS and HBAI data to simulate the effects of tax and benefit policy changes on different households. It has a wide range of users within academia, institutions, the third sector, and the public sector. For last year’s modelling, we used another model (IPPR) so the results are not exactly comparable.
[14] All policy modelling referred to in this report (exploring impacts of varying WCRS or SPD) applies to the 2025-2026 financial year, but generally the scale of the modelled impacts on water poverty in 2025-2026 should be transferable to future years. We would expect that, the faster that future charges rise above inflation, the larger the likely impact of a given policy scenario on water poverty rates.
[15] The increase in WCRS from 25% to 35% does not result in an increase in the overall average WCRS per household because single person households are eligible for a maximum of bill reduction of 10% through the WCRS over and above their Single Person Discount.
[16] There are small increases in the number of WCRS recipients as the WCRS increases. This relates to the way that the WCRS for Single Person households who receive less than a 100% Council Tax Reduction. To illustrate, imagine a single person household which receives a 70% council tax reduction. If the WCRS is 35%, this household does not receive any WCRS reduction on its water bill, because 35% of 70% is less than the Single Person status discount of 25% which they would already receive. But if the WCRS increased to 50%, the household would be entitled to a reduction of 50% of 70% which is 35%. They would therefore receive, through the WCRS, a further 10 percentage points reduction on their water bill over and above the Single Person status discount.
[17] This is because the maximum WCRS discount of 35% is not additional to the single person discount.
[18] IPPR (2025) Achieving_2030_child_poverty_target_March25.pdf
[19] Throughout this report, percentages are typically rounded to 1 decimal place, and number of households to the nearest 1,000. As a result, some numbers may not sum exactly.